

Screening of biomarkers for diagnosing chronic kidney disease and heart failure with preserved ejection fraction through bioinformatics analysis
- PMID: 39877037
- PMCID: PMC11773089
- DOI: 10.1016/j.bbrep.2024.101911
Screening of biomarkers for diagnosing chronic kidney disease and heart failure with preserved ejection fraction through bioinformatics analysis
Abstract
Background: Previous research has established that chronic kidney disease (CKD) and heart failure with preserved ejection fraction (HFpEF) often coexist. Although we have a preliminary understanding of the potential correlation between HFpEF and CKD, the underlying pathophysiological mechanisms remain unclear. This study aimed to elucidate the molecular mechanisms associated with CKD and HFpEF through bioinformatics analysis.
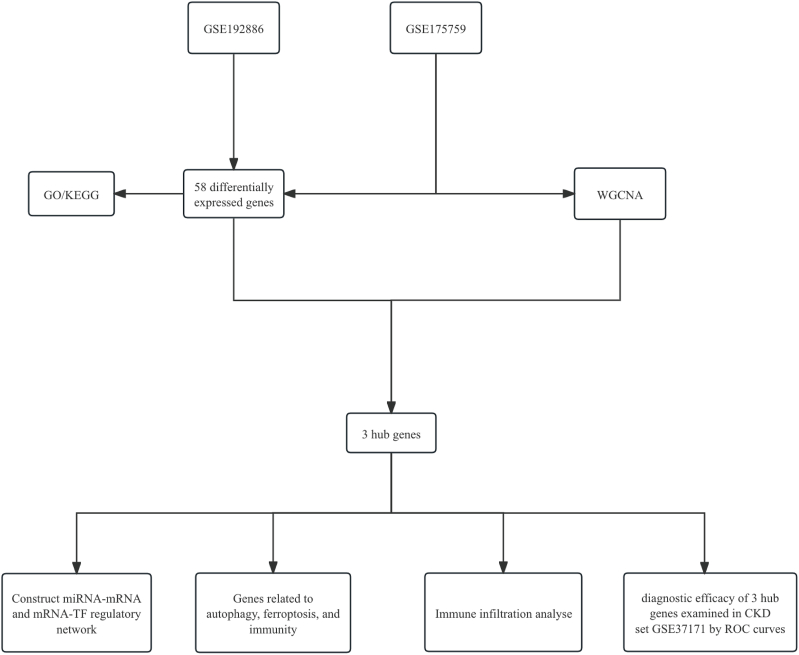
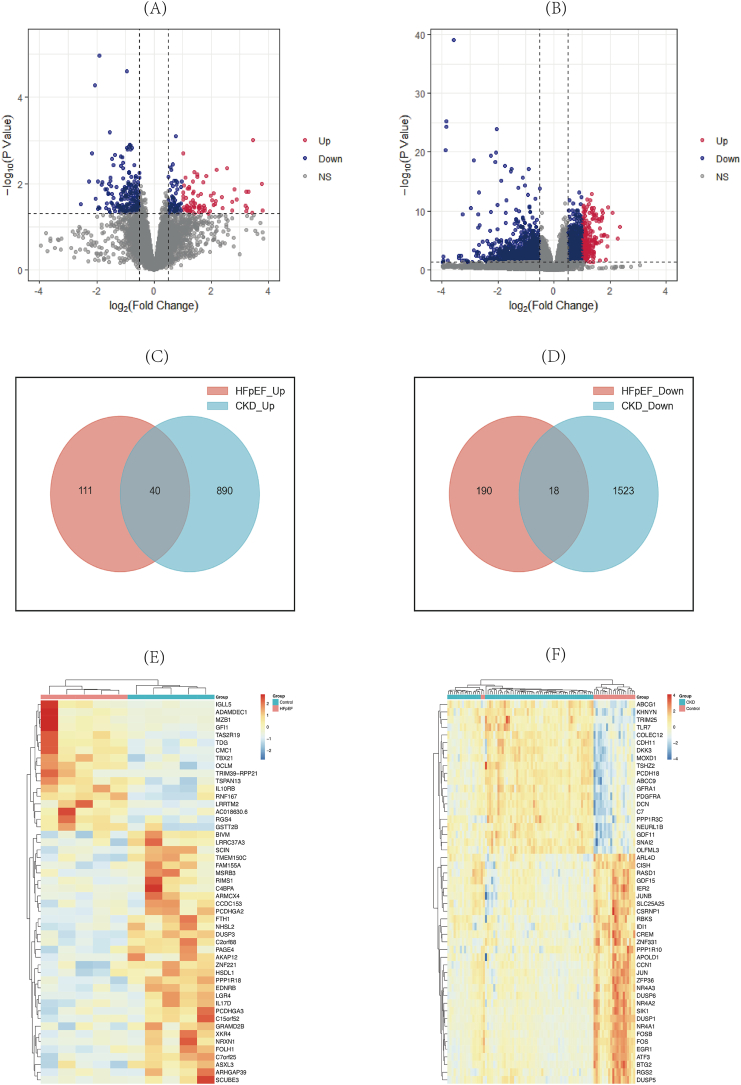
Methods: Datasets for HFpEF and CKD were obtained from the Gene Expression Omnibus (GEO) database. The R software package "limma" was employed to conduct differential expression analysis. Functional annotation was performed using the Kyoto Encyclopedia of Genes and Genomes (KEGG) and Gene Ontology (GO). We conducted weighted gene co-expression network analysis (WGCNA), correlation analysis with autophagy, ferroptosis, and immune-related processes, as well as transcriptional regulation analysis, immune infiltration analysis, and diagnostic performance evaluation. Finally, the diagnostic potential of the identified hub genes for CKD and HFpEF was assessed using ROC curve analysis (GSE37171).
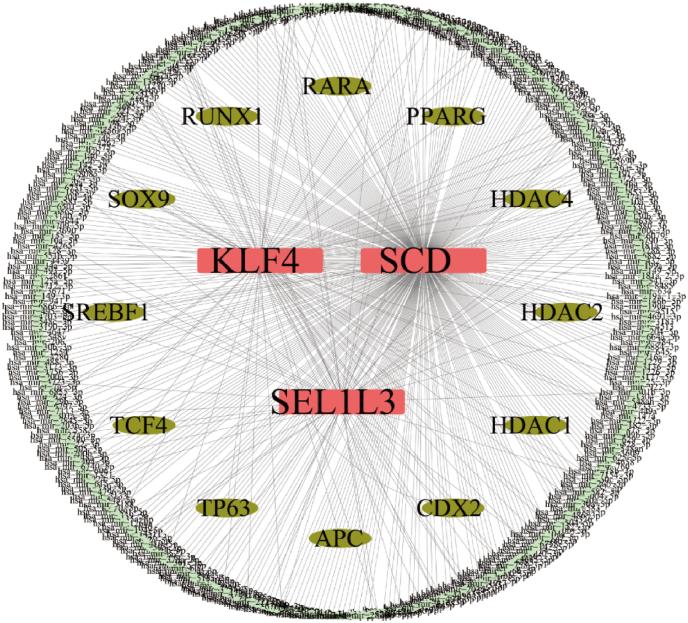
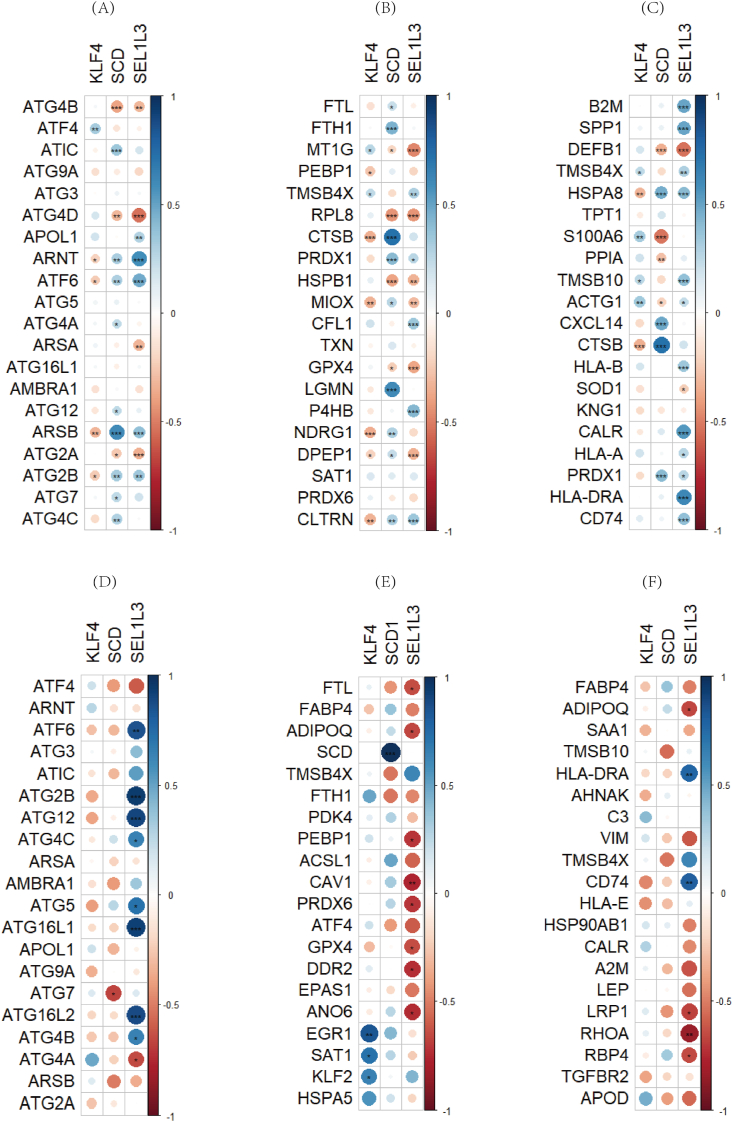
Results: Differential expression analysis revealed 58 overlapping genes, comprised of 40 up-regulated and 18 down-regulated genes. Both GO and KEGG analyses indicated enriched pathways relevant to both disorders. WGCNA identified 4086 genes associated with CKD. Further comparison with differentially expressed genes (DEGs) identified three hub genes (KLF4, SCD, and SEL1L3) that were linked to autophagy, ferroptosis, and immune processes in both conditions. Additionally, a miRNA-mRNA regulatory network involving 376 miRNAs and 12 transcription factors (TFs) was constructed. ROC curve analysis was performed to evaluate the diagnostic utility of the hub genes for CKD and HFpEF.
Conclusion: This study elucidated shared pathogenic mechanisms and identified diagnostic markers common to both HFpEF and CKD. The identified hub genes show promise as potential tools for early diagnosis and treatment strategies for these conditions.
Keywords: Bioinformatics; Chronic kidney disease (CKD); Heart failure with preserved ejection fraction (HFpEF); Immune infiltration.
© 2025 The Authors.
Conflict of interest statement
The authors declare that they have no known competing financial interests or personal relationships that could have appeared to influence the work reported in this paper.
Figures


References
-
- Zannad F., Rossignol P. Cardiorenal syndrome revisited. Circulation. 2018;138(9):929–944. - PubMed
-
- Heidenreich P.A., et al. 2022 AHA/ACC/HFSA guideline for the management of heart failure: a report of the American college of Cardiology/American heart association joint committee on clinical practice guidelines. Circulation. 2022;145(18) 1032. - PubMed
-
- Eknoyan G. Chronic kidney disease definition and classification: the quest for refinements. Kidney Int. 2007;72(10):1183–1185. - PubMed
LinkOut - more resources
Full Text Sources
