

This is a preprint.
A microbial natural product fractionation library screen with HRMS/MS dereplication identifies new lipopeptaibiotics against Candida auris
- PMID: 39877096
- PMCID: PMC11774467
- DOI: 10.21203/rs.3.rs-5802877/v1
A microbial natural product fractionation library screen with HRMS/MS dereplication identifies new lipopeptaibiotics against Candida auris
Update in
-
Coniontins, lipopetaibiotics active against Candida auris identified from a microbial natural product fractionation library.Nat Commun. 2025 Aug 8;16(1):7337. doi: 10.1038/s41467-025-62630-z. Nat Commun. 2025. PMID: 40781075 Free PMC article.
Abstract
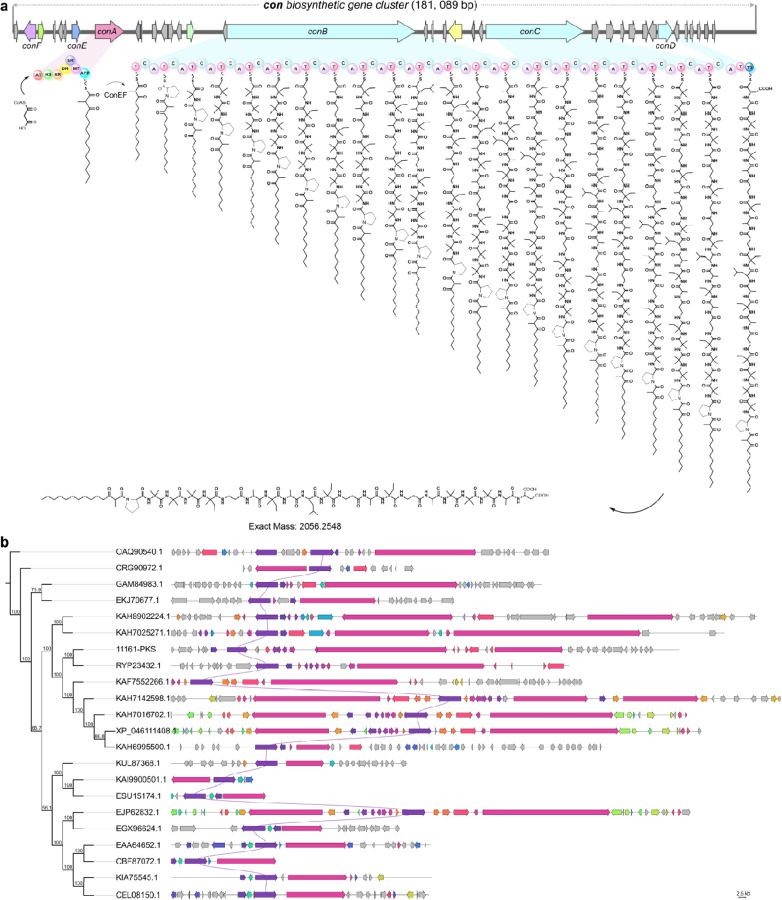
The rise of drug-resistant fungal pathogens, including Candida auris, highlights the urgent need for novel antifungal therapies. We developed a cost-effective platform combining microbial extract prefractionation with rapid MS/MS-bioinformatics-based dereplication to efficiently prioritize new antifungal scaffolds. Screening C. auris and C. albicans revealed novel lipopeptaibiotics, coniotins, from Coniochaeta hoffmannii WAC11161, which were undetectable in crude extracts. Coniotins exhibited potent activity against critical fungal pathogens on the WHO Fungal Priority Pathogens List, including C. albicans, C. neoformans, multidrug-resistant C. auris, and Aspergillus fumigatus, with high selectivity and low resistance potential. Coniotin A targets β-glucan, compromising fungal cell wall integrity, remodelling, and sensitizing C. auris to caspofungin. Identification of a PKS-NRPS biosynthetic gene cluster further enables the discovery of related clusters encoding potential novel lipopeptaibiotics. This study demonstrates the power of natural product prefractionation in uncovering bioactive scaffolds and introduces coniotins as promising candidates for combating multidrug-resistant fungal pathogens.
Conflict of interest statement
Additional Declarations: Yes there is potential Competing Interest. L.E.C. is a co-founder and shareholder in Bright Angel Therapeutics, a platform company for the development of novel antifungal therapeutics.E.D.B is the CEO and L.E.C. and G.D.W. are Science Advisors for Kapoose Creek, a company that harnesses the therapeutic potential of fungi. All other authors have no competing interests to declare.
Figures


References
-
- Denning D. W. Global incidence and mortality of severe fungal disease. Lancet Infect. Dis. 24, e428–e438 (2024). - PubMed
-
- Brown G. D. et al. Hidden Killers: Human Fungal Infections. Sci. Transl. Med. 4, 165rv13–165rv13 (2012). - PubMed
-
- Fisher M. C., Hawkins N. J., Sanglard D. & Gurr S. J. Worldwide emergence of resistance to antifungal drugs challenges human health and food security. Science 360, 739–742 (2018). - PubMed
Publication types
Grants and funding
LinkOut - more resources
Full Text Sources
Miscellaneous
