. 2025 Jan 10:47:32-50.
doi: 10.1016/j.bioactmat.2024.12.031. eCollection 2025 May.

Graphene oxide scaffolds promote functional improvements mediated by scaffold-invading axons in thoracic transected rats

Affiliations

Graphene oxide scaffolds promote functional improvements mediated by scaffold-invading axons in thoracic transected rats

Marta Zaforas et al. Bioact Mater. .

Abstract

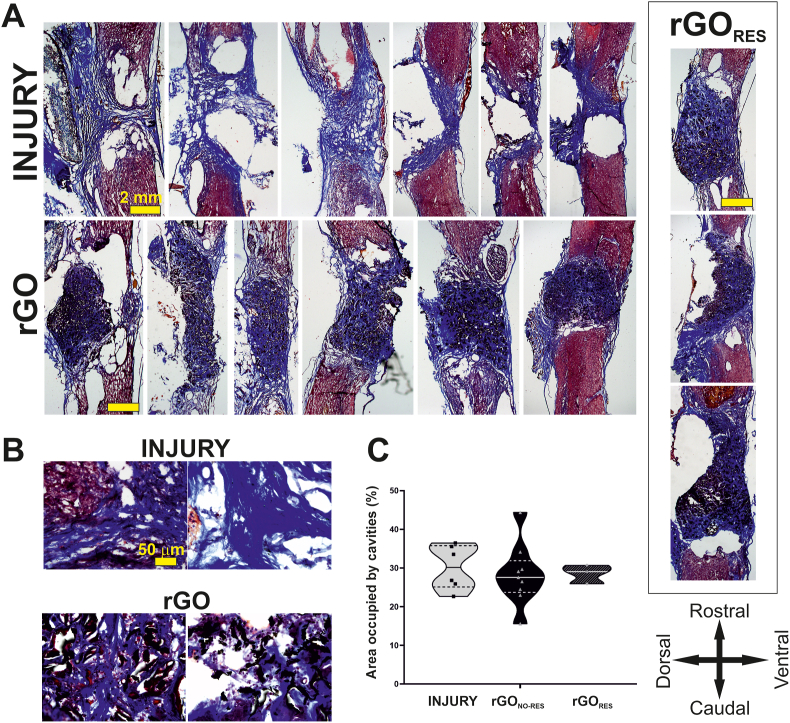
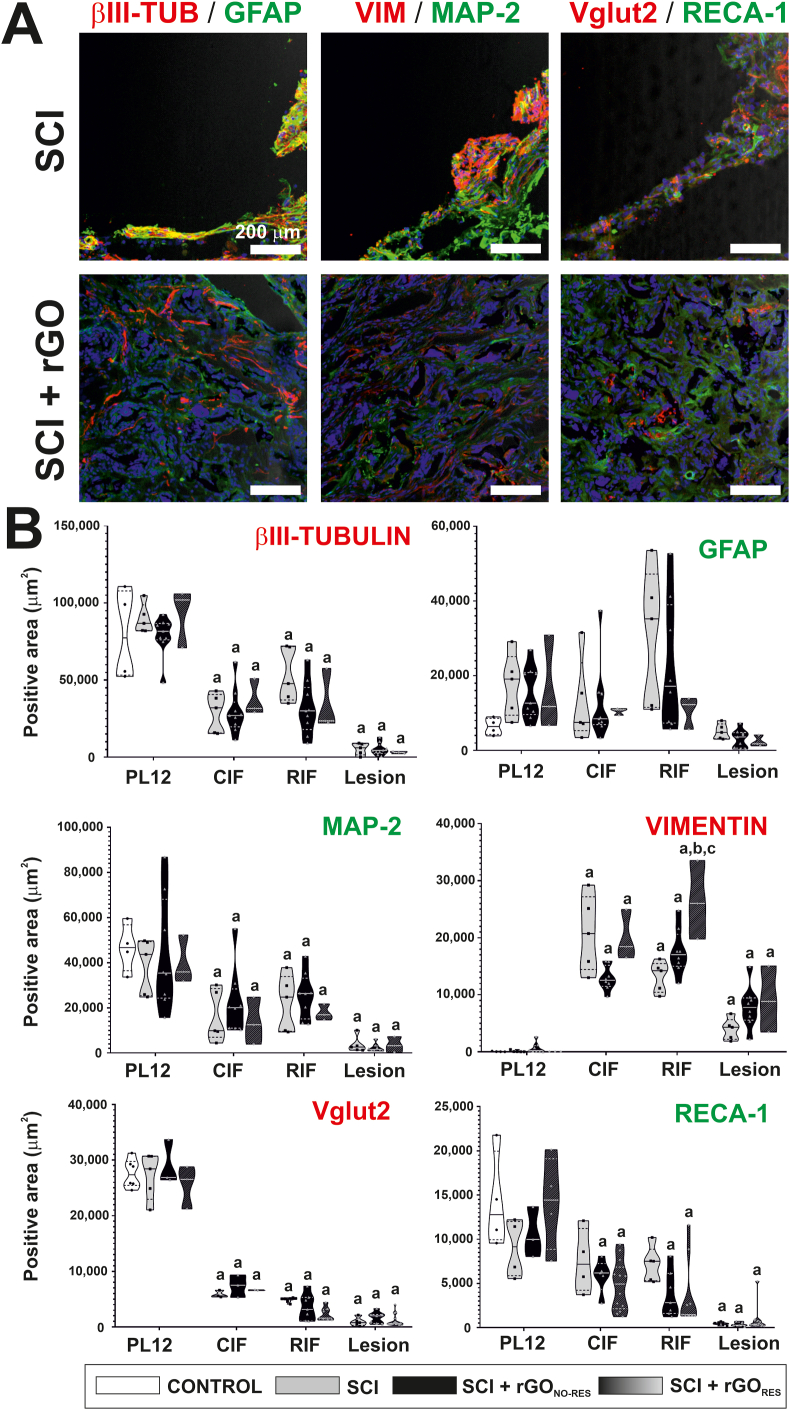
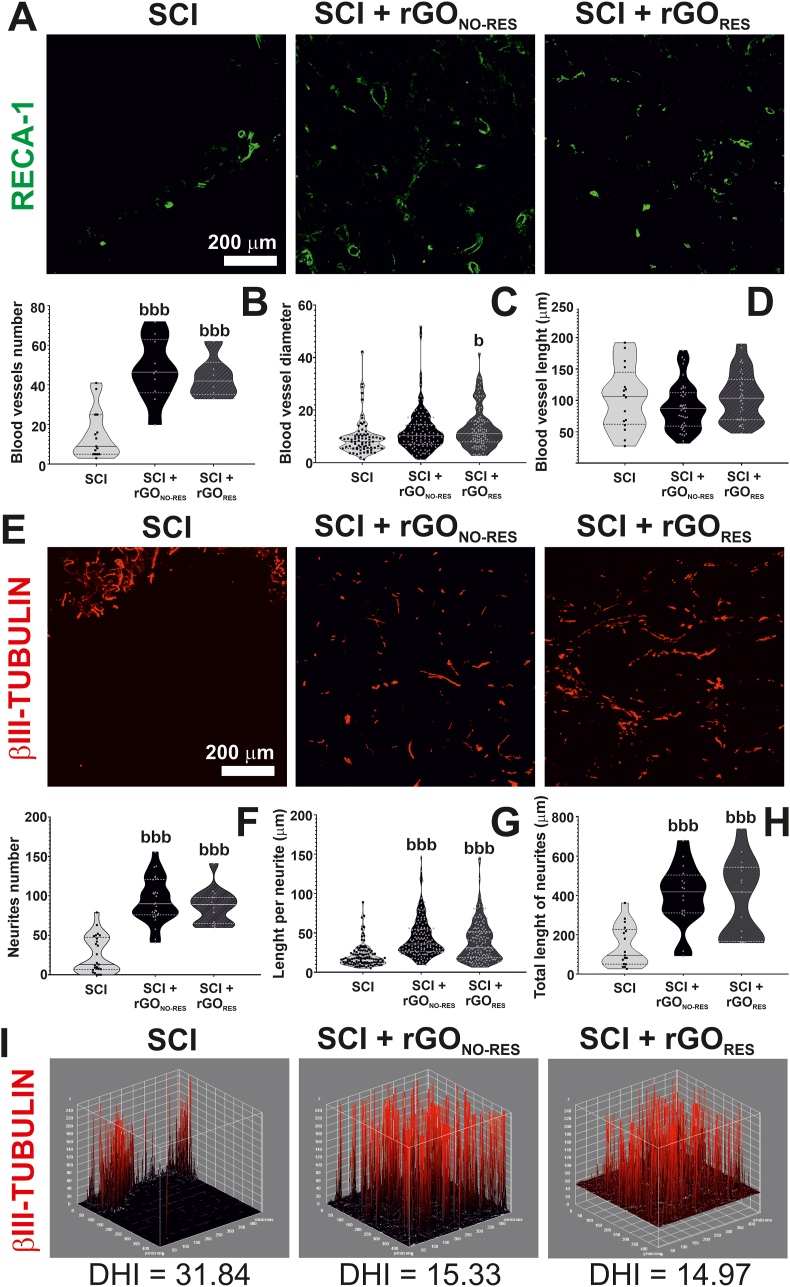
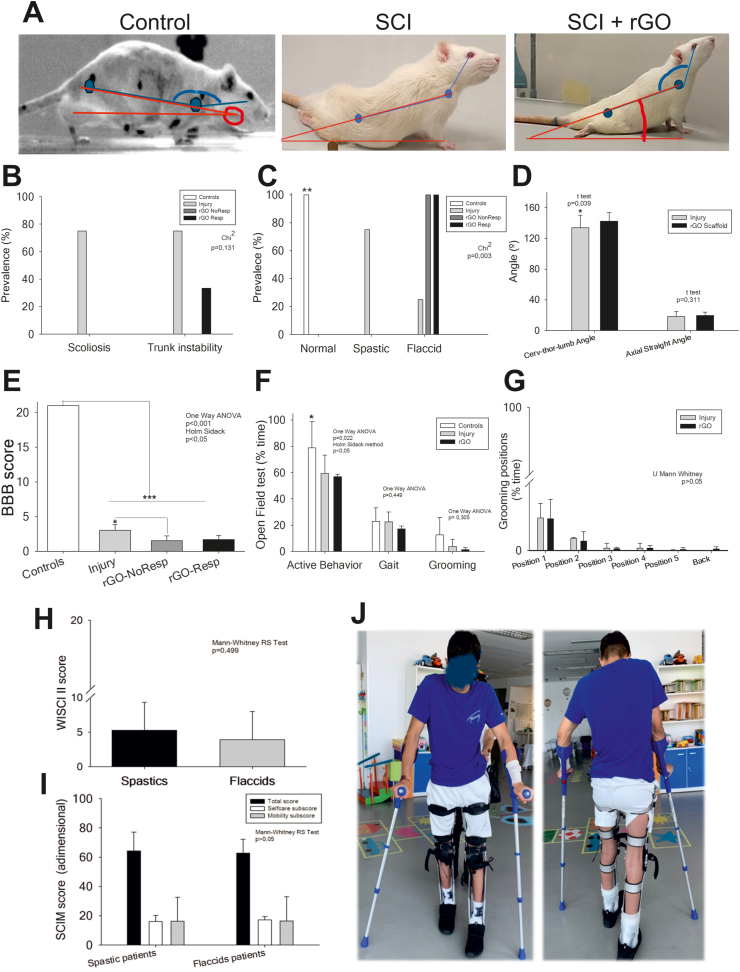
Millions of patients and their caretakers live and deal with the devastating consequences of spinal cord injury (SCI) worldwide. Despite outstanding advances in the field to both understand and tackle these pathologies, a cure for SCI patients, with their peculiar characteristics, is still a mirage. One of the most promising therapeutic strategies to date for these patients involves the use of epidural electrical stimulation. In this context, electrically active materials such as graphene and its derivates become particularly interesting. Indeed, solid evidence of their capacity to closely interact with neural cells and networks is growing. Encouraged by previous findings in our laboratory on the exploration of 3D porous reduced graphene oxide (rGO) scaffolds in chronic cervical hemisected rats (C6), herein we report their neuro-reparative properties when chronically implanted in complete transected rats (T9-T10), in which no preserved contralateral neural networks can assist in any observed recovery. Electrophysiological recordings from brainstem regions show antidromic activation of a small population of neurons in response to electrical stimulation caudal to the injury. These neurons are located in the Gigantocellular nucleus of reticular formation and vestibular nuclei, both regions directly related to motor functions. Together with histological features at the lesion site, such as more abundant and larger blood vessels and more abundant, longer and more homogeneously distributed axons, our results corroborate that rGO scaffolds create a permissive environment that allows the invasion of functional axonic processes from neurons located in brainstem nuclei with motor function in a rat model of complete thoracic transection. Additionally, behavioral tests evidence that these scaffolds play an important role in whole-body mechanical stabilization (postural control) proved by the absence of scoliosis, a higher trunk stability and a larger cervico-thoraco-lumbar movement range in rGO-implanted rats.

Keywords: Complete thoracic transection; Electrophysiological recording; Graphene oxide; Neural tissue engineering; Scaffold.


Conflict of interest statement

The authors declare the following financial interests/personal relationships which may be considered as potential competing interests: Maria Concepcion Serrano reports financial support was provided by 10.13039/100018693Horizon Europe (PathFinder, 101098597, Piezo4Spine). Maria Concepcion Serrano reports financial support was provided by Spain 10.13039/501100004837Ministry of Science and Innovation (PID2020-113480RB-I00). Eduardo R. Hernandez reports financial support was provided by Spain 10.13039/501100004837Ministry of Science and Innovation (PID2022-139776NB-C66). Maria Concepcion Serrano is an associate editor for Bioactive Materials and was not involved in the editorial review or the decision to publish this article. Other authors declare that they have no known competing financial interests or personal relationships that could have appeared to influence the work reported in this paper.

Figures

Image 1
Graphical abstract
Fig. 1
Fig. 1
Experimental approach and identification of spinal cord projecting neurons. (A) Experimental approach for electrophysiological recordings of spinal cord-projecting neurons and stimulation of their axons at spinal cord level in adult Wistar rats with a complete spinal cord injury at mid thoracic level (T9-T10). Animals were randomly assigned to two experimental groups the day of SCI surgery: only-injured (SCI) and implanted with a graphene scaffold in the site of injury (SCI + rGO). (B) Three different spatial schematic views of experimental approach (top, lateral and frontal) with the histological demonstration of an electrode insertion, performed by a Nissl staining of a 50 μm coronal slice at a spatial coordinate of AP -3 with lambda as a reference [27]. (CE) Antidromic characterization of spinal-cord projecting neurons (see Methods): constant latency and amplitude (C), follows high frequency stimulation (>100 Hz, D) and finally, neuron passes the collision test (E), which means that if a spontaneous orthodromic action potential occurs, it blocks the generation of antidromic spike. (F) Left, top view of scheme in B showing rostral stimulation. Middle and right: distribution plot of the 65 antidromic neurons (green) that were found in 60 electrode insertions made in 16 animals (square: SCI + rGO group, triangle: SCI group). These neurons are plotted as a function of AP and ML spatial coordinates. (G) Physiological properties of antidromic neurons identified by rostral stimulation in the brainstem: latency (ms) and conduction velocity (m/s). (H) Heat maps showing velocity of antidromic neurons as function of three spatial coordinates (AP-ML, AP-DV and ML-DV from left to right). Note that DV axis differentiates two nuclei with high conduction velocity in the spatial coordinates of vestibular and Gigantocellular nuclei, both in medulla. A: anterior; AP: anteroposterior; D: dorsal; DV: dorsoventral; L: left; ML: mediolateral; P: posterior; R: right; V: ventral.
Fig. 2
Fig. 2
Caudal activation of projecting neurons axons invading scaffold. (A) Scheme showing experimental approach for recording and stimulation for caudal activation of projecting neurons. Stim.: stimulation, rec.: recording, A: anterior, P: posterior, L: left, R: right, T7-T12: thoracic vertebrae. (B) Three single trials of caudal stimuli (Stim) at low frequency (1–2 Hz) for an animal of SCI group (top) and one of SCI + rGO group (bottom). Traces show examples of filtered signals (band-pass 0.5–5 kHz). Red arrows indicate antidromic caudal activation of a neuron invading scaffold from the SCI + rGO group (neuron #2). (C) Distribution plot of AP-ML coordinates for electrode insertion (n = 60) where no projecting neuron was found (grey, n = 33) and those where projecting neurons were recorded (green, n = 27), with locations for projecting neurons that invaded scaffold highlighted in orange (n = 4). Numbered neurons invading scaffold are named as Neuron #1 to #4. (D, E, F, G) Characterization of Neuron #1 (D), #2 (E), #3 (F) and #4 (G). Spatial coordinates of Neurons #1-#4: AP -3, −2.7, −3 and −3 mm; ML 0.7, 0.3, 1 and 1 mm; DV 9.5, 10.6, 8.2 and 8 mm, respectively (see panel C). Dotted vertical line indicates stimulus timestamp and shaded black squares highlight antidromic neurons response while shaded orange squares indicate synaptic response in Neuron #3 (F) and #4 (G). Top: Response average (±SEM, lighter color) of 15–37 stimuli during low frequency (0.5–5 Hz) stimulation of rostral (black, top) and caudal (green, bottom) segments of spinal cord. Middle: Three single trials of filtered signal with neuron response for rostral (black) and caudal (green) stimulation. Bottom: Peristimulus histogram (PSTH) with 1 ms bin showing neuron efficiency (%), calculated as count of spikes/number of stimuli. PSTH was built using 30–50 stimuli and values for each bin were normalized to the total number of stimuli (%) in order to compare between neurons.
Fig. 3
Fig. 3
Histological examination of spinal cord tissue from transected rats receiving rGO scaffolds. (A) Representative Masson trichrome staining images of spinal cords after 4 months of implantation for the different experimental groups. Each image represents the spinal cord of a different rat within each experimental group. Scale bars: 2 mm. (B) Details of the lesion site for both INJURY and rGO groups. Scale bars: 50 μm. (C) Quantitative data of cavities present at the lesion site. Arrows set indicating the orientation of the tissue sections.
Fig. 4
Fig. 4
Examination of collagen abundance and relative compactness in spinal cord tissue from transected rats receiving rGO scaffolds. (A) Color transformation of Masson trichrome images (256 colours) into 16 colours-based ones. Scale bars: 2 mm. (B) Representative diagrams containing the different blue and purple tones identified in each group. (C) Quantitative data for the blue and purple areas and blue-to-purple ratios. (D) Representative transformed images illustrating the degree of collagen compactness in a thermal scale. (E) Quantitative data of collagen compactness. Statistics: one-way ANOVA followed by either Scheffé. Significance: p < 0.05 with respect to control (a).
Fig. 5
Fig. 5
Immunofluorescence characterization of the lesion site in paralyzed rats receiving rGO scaffolds. (A) Representative confocal microscopy images at the lesion site for different markers under study as indicated. In all images, cell nuclei appeared in blue (Hoechst staining). Scale bar: 200 μm. (B) Respective quantitative data expressed as the positive stained area (%) from immunofluorescence images. Violin graphs were used in the representation of the data. Representative images for the remaining areas under investigation can be found in Figure S4, S5 and S6 βIII-TUB: βIII-tubulin; CIF: caudal interface; GFAP: glial fibrillary acidic protein; MAP-2: microtubule-associated protein 2; PL12: perilesional areas at 1–2 mm from the lesion border; RIF: rostral interface; VIM: vimentin. Statistics: one-way ANOVA followed by either Scheffé or Games-Howell post hoc tests (as dictated by Levene's test). Significance: p < 0.05 with respect to control (a), SCI (b) and SCI + rGONO-RES (c) groups.
Fig. 6
Fig. 6
Immunofluorescence characterization of the lesion site in paralyzed rats receiving rGO scaffolds. (A) Representative confocal microscopy images at the lesion site for different markers under study as indicated. In all images, cell nuclei appeared in blue (Hoechst staining). Scale bar: 200 μm. (B) Respective quantitative data expressed as the positive stained area (%) from immunofluorescence images. Violin graphs were used in the representation of the data. Representative images for the remaining areas under investigation can be foundin Figure S4, S5 and S6. CIF: caudal interface; GAP-43: growth-associated protein 43; MAG: myelin-associated glycoprotein; MBP: myelin basic protein; PL12: perilesional areas at 1–2 mm from the lesion border; Synap: Synaptophysin; RIF: rostral interface; VIM: vimentin. Statistics: one-way ANOVA followed by either Scheffé or Games-Howell post hoc tests (as dictated by Levene's test). Significance: p < 0.05 with respect to control (a), SCI (b) and SCI + rGONO-RES (c) groups.
Fig. 7
Fig. 7
Examination of blood vessels and neurites populating the lesion site in paralyzed rats receiving rGO scaffolds. (A) Representative confocal microscopy images of blood vessels (RECA-1+). Scale bar: 200 μm. (BD) Respective quantitative data expressed as the average of blood vessels number, diameter and length, respectively. (E) Representative confocal microscopy images of neurites (βIII-tubulin+). Scale bar: 200 μm. (FH) Respective quantitative data expressed as the average of neurites number per image, length per neurite and total length per image, respectively. Violin graphs were used in the representation of the data. (I) Representative 3D reconstruction plots for images shown in (E). Based on electrophysiological results, the analysis of both blood vessels and neurites colonizing the rGO scaffold was disaggregated into respondent (SCI + rGORES; X6, X21 and X23) and non-respondent (SCI + rGONO-RES; all the rest) rats. Statistics: one-way ANOVA followed by either Scheffé or Games-Howell post hoc tests (as dictated by Levene's test). Significance: b < 0.05 and bbb <0.005 with respect to SCI.
Fig. 8
Fig. 8
Behavioral examination in transected rats after 4 months of rGO implantation and patients' series. (A) Representative photographs of a control rat and transected rats with and without rGO scaffold implant. The body alignment variables defined have been represented on each of the three images: the angle of trunk alignment in red and the cervico-thoraco-lumbar angle in blue. (B) Prevalence of scoliosis and trunk instability in transected rats. Statistics: χ2, p = 0.131. (C) Prevalence of spastic and flaccid muscle tone in transected rats. Statistics: χ2, p = 0.03. (D) Quantitative analysis of the angular alignment measures in transected rats. All rGO-implanted rats were grouped together due to similar results. Statistics: cervico-thoraco-lumbar angle: T test, p = 0.039; angle of trunk alignment, T test, p = 0.311. (E) Quantitative analysis of locomotion behavior through BBB score in transected rats. Statistics: one-way ANOVA, p = 0.001; Holm-Sidak method, p < 0.05. (F) Quantitative analysis of Open Field Test in transected rats. Statistics: Active behavior: one-way ANOVA, p = 0.022; gait: one-way ANOVA, p = 0.449; grooming: one-way ANOVA, p = 0.305. (G) Quantitative analysis of the Grooming Test in transected rats. Statistics: Mann Whitney RS test, p > 0.05. (H) Quantitative analysis of the locomotion behavior of the patient's series through the WISCI II scale. Statistics: U Mann Whitney RS test, p = 0.499. (I) Quantitative analysis of the degree of functional independence in daily activities measured in the patients' cohort by using the SCIM III scale. Statistics: U Mann Whitney RS test, p > 0.05. (J) Representative photographs of a patient with complete thoracic paraplegia using orthoses and crutches.

References

    1. Novoselov K.S., Geim A.K., Morozov S.V., Jiang D., Zhang Y., Dubonos S.V., Grigorieva I.V., Firsov A.A. Electric field effect in atomically thin carbon films. Science. 2004;306:666–669. - PubMed
    1. Yang Y., Asiri A.M., Tang Z., Du D., Lin Y. Graphene based materials for biomedical applications. Mater. Today. 2013;16:365–373.
    1. Girao A., Serrano M.C., Completo A., Marques P.A.A.P. Is graphene shortening the path toward spinal cord regeneration? ACS Nano. 2022;16:13430–13467. - PMC - PubMed
    1. Viana D., Walston S.T., Masvidal-Codina E., Illa X., Rodríguez-Meana B., del Valle J., Hayward A., Dodd A., Loret T., Prats-Alfonso E., de la Oliva N., Palma M., del Corro E., Bernicola M.O., Rodríguez-Lucas E., Gener T., de la Cruz J.M., Torres-Miranda M., Duvan F.T., Ria N., Sperling J., Martí-Sánchez S., Spadaro M.C., Hébert C., Savage S., Arbiol J., Guimerà-Brunet A., Puig M.V., Yvert B., Navarro X., Kostarelos K., Garrido J.A. Nat. Nanotechnol. 2024;19:514–523. - PMC - PubMed
    1. Wang Y., Lee W.C., Manga K.K., Ang P.K., Lu J., Liu Y.P., Lim C.T., Loh K.P. Fluorinated graphene for promoting neuro-induction of stem cells. Advanced Materirals. 2012;24:4285–4290. - PubMed

LinkOut - more resources