. 2025 Jan 14:12:1500786.
doi: 10.3389/fbioe.2024.1500786. eCollection 2024.

Position-based assessment of head impact frequency, severity, type, and location in high school American football

Affiliations

Position-based assessment of head impact frequency, severity, type, and location in high school American football

Amirhossein Bagherian et al. Front Bioeng Biotechnol. .

Abstract

Introduction: Research on head impact characteristics, especially position-specific investigations in football, has predominantly focused on collegiate and professional levels, leaving a gap in understanding the risks faced by high school players. Therefore, this study aimed to investigate the effect of three factors-player position, impact location, and impact type-on the frequency, severity, and characteristics of impacts in high school American football. Additionally, we examined whether and how player position influences the distribution of impact locations and types.

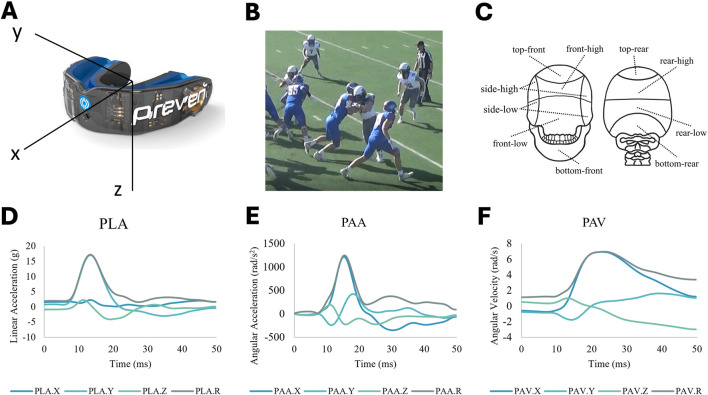
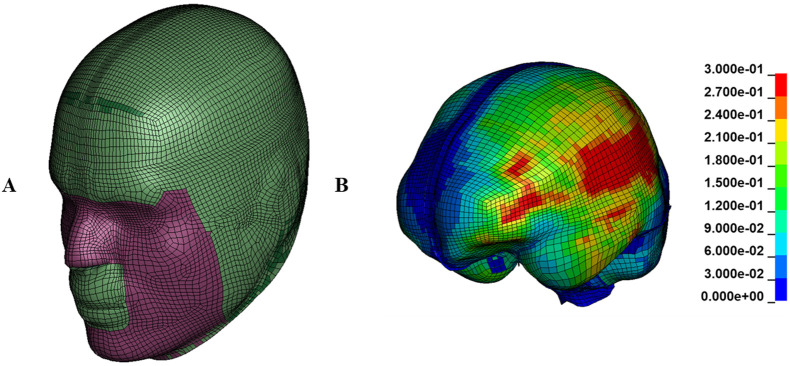
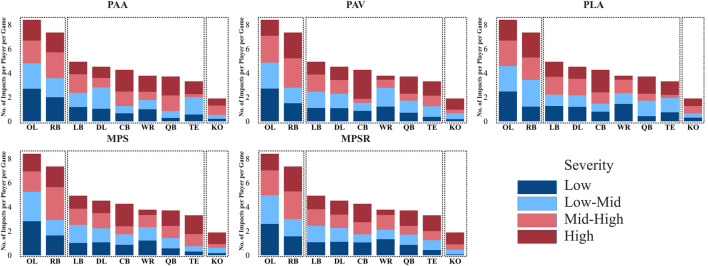
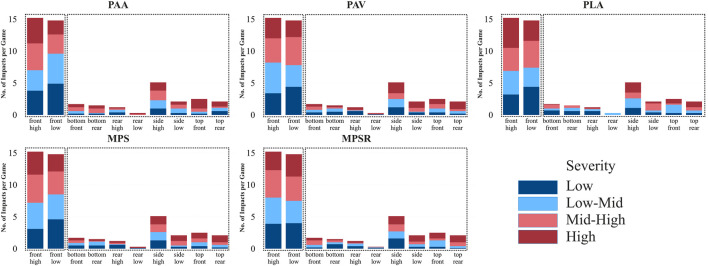
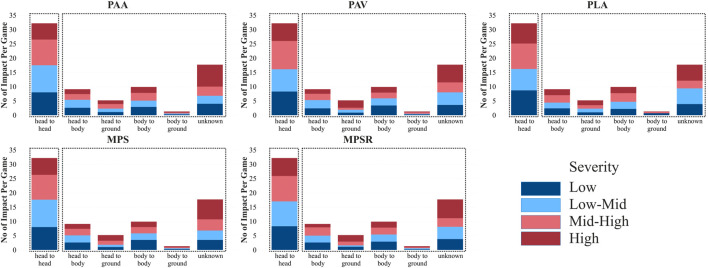
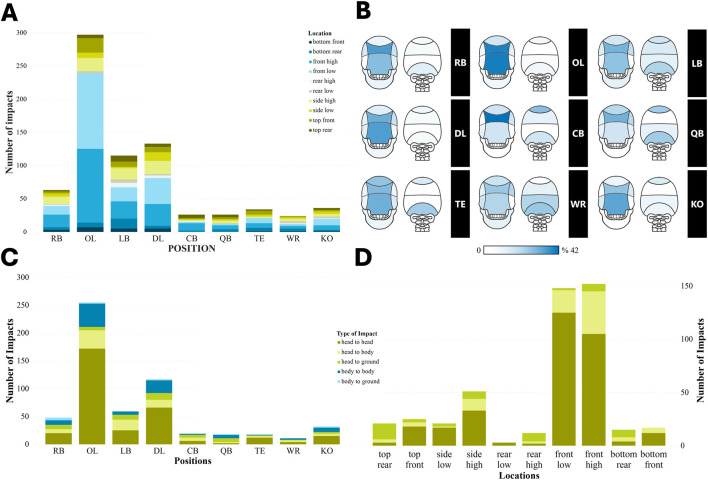
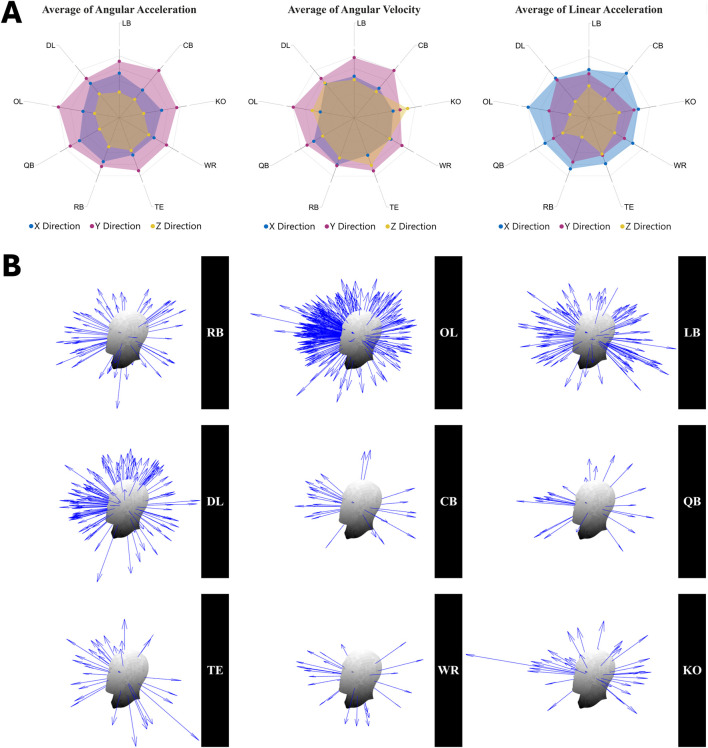
Methods: Sixteen high school football players aged 14 to 17 participated in this study. Validated mouthguard sensors measured head impact kinematics, including linear acceleration, angular acceleration, and angular velocity across ten games, and were used to identify impact locations on the head. Video recordings verified true impacts, player position, and impact type at the moment of each recorded impact. Head impact kinematics were input into a head finite element model to determine the 95th percentile of the maximum principal strain and strain rate. Several novel and systematic approaches, such as normalization, binning, and clustering, were introduced and utilized to investigate the frequency and severity of head impacts across the three aforementioned factors while addressing some of the limitations of previous methodologies in the field. To that end, the number of recorded impacts for each player position during each game was divided by the number of players in that position, and then averaged across ten games. Instead of averaging, impacts were categorized into four severity bins: low, mid-low, mid-high and high. Clusters for the three factors were also identified according to the characteristics of impacts.

Results and discussion: Results revealed that offensive linemen and running backs experienced a higher normalized frequency and more severe impacts across all head kinematics and brain tissue deformation parameters. Frontal impacts, resulting from "head-to-head" impacts, were the most frequent and severe impact locations. The distributions of impact location and type for each specific position were distinct. Offensive linemen had the highest proportion of frontal impacts, while quarterbacks and centerbacks had more impacts at the rear location. These findings can inform interventions in game regulations, training practices, and helmet design to mitigate injury risks in high school football.

Keywords: brain tissue deformation; head impact frequency; head impact severity; head kinematics; high school football; mouthguards; sport-related concussion; traumatic brain injury.


Conflict of interest statement

The authors declare that the research was conducted in the absence of any commercial or financial relationships that could be construed as a potential conflict of interest.

Figures

FIGURE 1
FIGURE 1
(A) Prevent Biometric Mouthguard sensor used for measuring head impact kinematics. (B) a snapshot from video recordings of head impact. (C) Ten impact locations of impact on the head detected by the sensor algorithm. (D) x-y-z and resultant traces of peak linear acceleration (PLA) of a head impact. (E) x-y-z and resultant traces of peak angular acceleration (PAA) of a head impact. (F) x-y-z and resultant traces of peak angular velocity (PAV) of a head impact.
FIGURE 2
FIGURE 2
(A) The global human body models consortium (GHBMC) human head finite element model used to simulate the impacts. (B) an example of distribution of maximum principal strain in brain tissue in high severity bin.
FIGURE 3
FIGURE 3
Normalized frequency (number of impacts per player per game) and distribution of impacts across four severity bins for each specific position for all five studied outputs: peak angular acceleration (PAA), peak angular velocity (PAV), peak linear acceleration (PLA), 95th percentile of the maximum principal strain (MPS) and 95th percentile of the maximum strain rate (MPSR). Two clusters are shown by dotted boxes.
FIGURE 4
FIGURE 4
Frequency of impact (per game) and distribution of impacts across four severity bins for each specific head impact location for all five studied outputs: peak angular acceleration (PAA), peak angular velocity (PAV), peak linear acceleration (PLA), 95th percentile of the maximum principal strain (MPS) and 95th percentile of the maximum strain rate (MPSR). Two clusters are shown by dotted boxes.
FIGURE 5
FIGURE 5
Frequency of impact (per game) and distribution of impacts across four severity bins for each specific impact type for all five studied outputs: peak angular acceleration (PAA), peak angular velocity (PAV), peak linear acceleration (PLA), 95th percentile of the maximum principal strain (MPS) and 95th percentile of the maximum strain rate (MPSR). Two clusters are shown by dotted boxes.
FIGURE 6
FIGURE 6
Associations of player positions, impact locations, and impact types on head impact frequency. (A) the number of each head impact location experienced by each player position. (B) Visual percentage representation of each head impact location experienced by each player position (C) the number of each impact type experienced by each player position. (D) the number of impact types that involved head impacts (head-to-head, head-to-body, and head-to-ground) across different categories of head impact location.
FIGURE 7
FIGURE 7
(A) x, y, and z components of angular acceleration, angular velocity, and linear acceleration at peak resultant moments, normalized by peak magnitudes, for each player position, illustrating the dominant direction of impact moment, angular motion, and force. (B) a graphical representation of the distribution of peak angular acceleration vectors across different player positions for all impacts.

Similar articles

Cited by

References

    1. Alois J., Bellamkonda S., Campolettano E. T., Gellner R. A., Genemaras A., Beckwith J. G., et al. (2019). Do American youth football players intentionally use their heads for high-magnitude impacts? Am. J. Sports Med. 47 (14), 3498–3504. 10.1177/0363546519882034 - DOI - PMC - PubMed
    1. Bahrami N., Sharma D., Rosenthal S., Davenport E. M., Urban J. E., Wagner B., et al. (2016). Subconcussive head impact exposure and white matter tract changes over a single season of youth football. Radiology 281 (3), 919–926. 10.1148/radiol.2016160564 - DOI - PMC - PubMed
    1. Bartsch A., Samorezov S., Benzel E., Miele V., Brett D. (2014). Validation of an “intelligent mouthguard” single event head impact dosimeter. Stapp Car Crash J. 58, 1–27. 10.4271/2014-22-0001 - DOI - PubMed
    1. Baugh C. M., Kiernan P. T., Kroshus E., Daneshvar D. H., Montenigro P. H., McKee A. C., et al. (2015). Frequency of head-impact–related outcomes by position in NCAA division I collegiate football players. J. Neurotrauma 32 (5), 314–326. 10.1089/neu.2014.3582 - DOI - PMC - PubMed
    1. Baugh C. M., Stamm J. M., Riley D. O., Gavett B. E., Shenton M. E., Lin A., et al. (2012). Chronic traumatic encephalopathy: neurodegeneration following repetitive concussive and subconcussive brain trauma. Brain imaging Behav. 6, 244–254. 10.1007/s11682-012-9164-5 - DOI - PubMed

LinkOut - more resources