. 2025 Jan 24:20:1021-1046.
doi: 10.2147/IJN.S502076. eCollection 2025.

Enhanced Antitumor Efficacy and Reduced Toxicity in Colorectal Cancer Using a Novel Multifunctional Rg3- Targeting Nanosystem Encapsulated with Oxaliplatin and Calcium Peroxide

Affiliations

Enhanced Antitumor Efficacy and Reduced Toxicity in Colorectal Cancer Using a Novel Multifunctional Rg3- Targeting Nanosystem Encapsulated with Oxaliplatin and Calcium Peroxide

Yizhuo Xie et al. Int J Nanomedicine. .

Abstract

Purpose: Colorectal cancer (CRC) is the second leading cause of cancer-related deaths worldwide. Oxaliplatin (OXA) is currently the primary chemotherapeutic agent for CRC, but its efficacy is limited by the tumor microenvironment (TME). Here, we present a combined approach of chemotherapy and TME modulation for CRC treatment. A multifunctional nanosystem (Rg3-Lip-OXA/CaO2) was established using Ginsenoside Rg3 liposomes targeting glucose transporter 1 overexpressed on the surface of CRC cells to co-deliver OXA and calcium peroxide (CaO2).

Methods: The CaO2 nanoparticles were synthesized via the CaCl2-H2O2 reaction under alkaline conditions and characterized using X-ray diffraction (XRD) and X-ray photoelectron spectroscopy (XPS). Rg3-Lip-OXA/CaO2 was prepared through a thin-film hydration approach and characterized; additionally, its stability and release behavior were studied. The O2, H2O2, and Ca2+ generation ability of Rg3-Lip-OXA/CaO2 in solution and HCT116 cells were measured. The in vitro cellular uptake was observed via fluorescence microscope and flow cytometry. In vitro cytotoxicity was evaluated using the CCK-8 assay, flow cytometry, and live/dead cell staining. The in vivo targeting effect as well as antitumor efficacy were determined in HCT116 tumor-bearing mice. Finally, the acute toxicity of Rg3-Lip-OXA/CaO2 was investigated in ICR mice to explore its safety.

Results: The XRD and XPS analyses confirmed the successful synthesis of CaO2 nanoparticles. The Rg3-Lip-OXA/CaO2 exhibited an average particle size of approximately 92.98 nm with good stability and sustained release behavior. In vitro and in vivo studies confirmed optimal targeting by Rg3-Lip and demonstrated that the nanosystem effectively produced O2, H2O2 and Ca2+, resulting in significant cytotoxicity. Additionally, in vivo studies revealed substantial tumor growth suppression and reduced tumor-associated fibroblasts (TAFs) and collagen. Acute toxicity studies indicated that Rg3-Lip-OXA/CaO2 markedly reduced the toxicity of chemotherapeutic drugs.

Conclusion: This multifunctional nanosystem enhances chemotherapy efficacy and reduces toxicity, offering a promising approach for optimizing CRC treatment and potential clinical application.

Keywords: anticancer therapy; calcium peroxide; multifunctional nanosystem; oxaliplatin; targeted drug delivery; tumor microenvironment.


Conflict of interest statement

The authors report no conflicts of interest in this work.

Figures

None
Graphical abstract
Figure 1
Figure 1
Characterization of CaO2 and Rg3-Lip-OXA/CaO2. (A) XRD spectra and (B) XPS spectrum of CaO2. (C) Particle sizes and (D) TEM images of CaO2 and Rg3-Lip-OXA/CaO2. (E) EDS elemental mapping of Rg3-Lip-OXA/CaO2. (F) O2 release profiles of Lip-OXA, Lip-OXA/CaO2, and Rg3-Lip-OXA/CaO2 in PBS at pH 7.4. (G) Photographs and (H) UV–vis absorption spectra of KMnO4 treated with Lip-OXA, Lip-OXA/CaO2, or Rg3-Lip-OXA/CaO2. (I) Cumulative Ca2+ release profiles of Lip-OXA, Lip-OXA/CaO2, and Rg3-Lip-OXA/CaO2 in PBS at pH 7.4. (J) Changes in EE of OXA in Lip-OXA/CaO2 and Rg3-Lip-OXA/CaO2 and (K) Rg3 in Rg3-Lip-OXA/CaO2 within 48 h at different temperatures. (L) Particle sizes, PDI, and (M) zeta potential changes of Rg3-Lip-OXA/CaO2 stored at 4°C for 14 days. (N) Particle sizes and (O) PDI of Rg3-Lip-OXA/CaO2 mixed with different dispersion medium for 48 h. Drug release behavior of (P) OXA and (Q) Rg3 in diverse formulations. Data are presented as mean ± SD (n = 3).
Figure 2
Figure 2
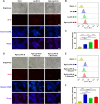
Intracellular uptake and mechanism of Rg3-Lip-Rh B in HCT116 cells. (A) Fluorescence images of HCT116 cells incubated with different Rh B formulations for 6 h. (B) Flow cytometry analysis and (C) quantification of the cellular uptake of different Rh B formulations. (D) Examination of Rg3-Lip-Rh B cellular uptake in the presence of various Glut inhibitors, including glucose and quercetin. (E) Flow cytometry analysis and (F) quantification of the cellular uptake of Rg3-Lip-Rh B in the presence of different Glut inhibitors. Data are expressed as mean ± SD (n = 3). **p < 0.01, ***p < 0.001, ****p < 0.0001.
Figure 3
Figure 3
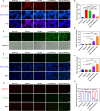
Detection of intracellular O2, ROS, Ca2+ levels, and mitochondrial membrane potential (MMP) in HCT116 cells treated with a CaO2-loaded nanosystem. Fluorescence images of cellular (A) O2, (C) ROS, and (E) Ca2+ levels in HCT116 cells treated with Lip-OXA, Lip-OXA/CaO2, or Rg3-Lip-OXA/CaO2 for 12 h. Scale bar = 50 μm. The fluorescence quantitative analysis of cellular (B) O2, (D) ROS, and (F) Ca2+ levels. (G) MMP in HCT116 cells treated with Lip-OXA, Lip-OXA/CaO2, and Rg3-Lip-OXA/CaO2 for 12 h. (H) The fluorescence quantitative analysis of (G). Data are presented as mean ± SD (n = 3). *p < 0.05, **p < 0.01, ***p < 0.001, ****p < 0.0001.
Figure 4
Figure 4
In vitro cytotoxicity and apoptosis of different formulations in HCT116 cells. (A) Cell viability of HCT116 cells treated with different formulations for 48 h. (B) IC50 of various formulations. (C) The apoptosis quantitative analysis and (D) apoptosis assay results of HCT116 cells treated with different formulations for 48 h by flow cytometry. (E) Live/dead cell staining images of HCT116 cells treated with different formulations for 48 h. Data are presented as mean ± SD (n = 3). *p < 0.05, **p < 0.01, ***p < 0.001, ****p < 0.0001.
Figure 5
Figure 5
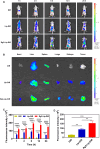
In vivo fluorescence imaging of Rg3-Lip-DiR. (A) In vivo fluorescence imaging of different DiR formulations in HCT116 tumor-bearing athymic mice at predetermined time points. (B) Ex vivo fluorescence images of the main organs and tumors at 6 h. (C) Quantification of fluorescence intensity at tumor sites of (A). (D) Quantification of fluorescence intensity at tumor sites of (B). Data are presented as mean ± SD (n = 3). **p < 0.01, ***p < 0.001, ****p < 0.0001.
Figure 6
Figure 6
In vivo antitumor evaluation on the HCT116 tumor-bearing athymic mice. (A) Tumor inoculation and therapeutic schedule over 24 days. (B) The tumor growth curves, (C) tumor photographs, (D) tumor weight, and (E) tumor inhibition rate of tumor-bearing mice following the treatments. (F) The H&E staining and TUNEL assay of tumor tissues. (G) Masson’s trichrome assay and α-SMA immunohistochemistry staining of tumor tissues. Data are expressed as mean ± SD (n = 5). *p < 0.05, **p < 0.01, ***p < 0.001, ****p < 0.0001.
Figure 7
Figure 7
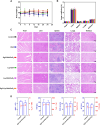
The safety evaluation of different formulations on the HCT116 tumor-bearing athymic mice. (A) Body weight change of mice throughout the 24-day experiment. (B) The organ coefficients and (C) H&E staining of major organs. (D) Blood routine analysis and biochemical analysis results of WBC, RBC, HGB, PLT, BUN, Cre, ALT, and AST. Data are presented as mean ± SD (n = 5).
Figure 8
Figure 8
Acute toxicity assessment. Survival curves and body weight changes after intravenous administration with (A and D) OXA, (B and E) Rg3-OXA/CaO2, and (C and F) Rg3-Lip-OXA/CaO2 at various doses. Data are presented as mean ± SD (n = 10).
Figure 9
Figure 9
Acute toxicity assessment. (A) The blood routine analysis and (B) biochemical analysis results of low dose groups. (C) H&E staining of main organs of low dose groups. Data are expressed as mean ± SD (n = 10). *p < 0.05, **p < 0.01, ***p < 0.001.

Similar articles

References

    1. Malki A, Abu ElRuz R, Gupta I, Allouch A, Vranic S, Al Moustafa AE. Molecular mechanisms of colon cancer progression and metastasis: recent insights and advancements. Int J Mol Sci. 2021;22(1):130. doi:10.3390/ijms22010130 - DOI - PMC - PubMed
    1. Keum N, Giovannucci E. Global burden of colorectal cancer: emerging trends, risk factors and prevention strategies. Review. Nat Rev Gastroenterol Hepatol. 2019;16(12):713–732. doi:10.1038/s41575-019-0189-8 - DOI - PubMed
    1. Liu Y, Zheng Z. Understanding the global cancer statistics 2022: growing cancer burden. Article; Early Access. Sci Chin Life Sci. 2024. doi:10.1007/s11427-024-2657-y - DOI - PubMed
    1. Bray F, Laversanne M, Sung H, et al. Global cancer statistics 2022: GLOBOCAN estimates of incidence and mortality worldwide for 36 cancers in 185 countries. Article. CA-Cancer J Clin. 2024;74(3):229–263. doi:10.3322/caac.21834 - DOI - PubMed
    1. Nierengarten MB. Global cancer statistics 2022. News Item. Cancer. 2024;130(15). doi:10.1002/cncr.35444 - DOI - PubMed

MeSH terms

LinkOut - more resources