. 2024 Dec 17;33(1):101400.
doi: 10.1016/j.omtm.2024.101400. eCollection 2025 Mar 13.

Characterization and effective expansion of CD4-CD8- TCRαβ+ T cells from individuals living with type 1 diabetes

Affiliations

Characterization and effective expansion of CD4-CD8- TCRαβ+ T cells from individuals living with type 1 diabetes

J Ernesto Fajardo-Despaigne et al. Mol Ther Methods Clin Dev. .

Abstract

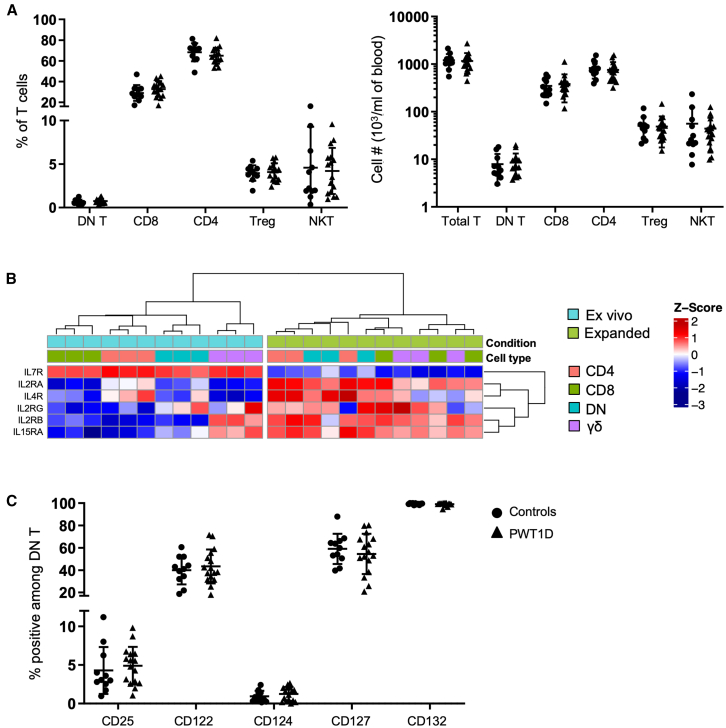
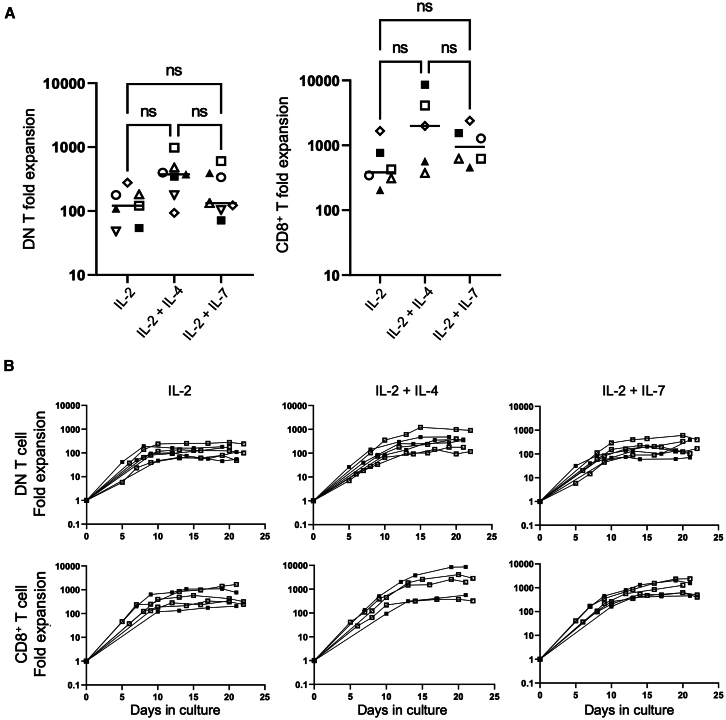
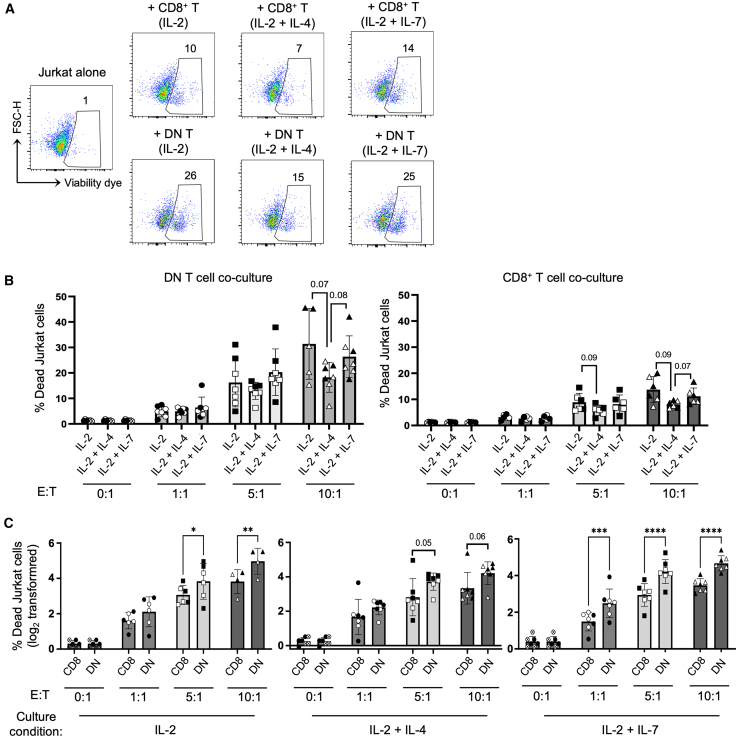
CD4-CD8- TCRαβ+ (double-negative [DN]) T cells represent a rare T cell population that promotes immunological tolerance through various cytotoxic mechanisms. In mice, autologous transfer of DN T cells has shown protective effects against autoimmune diabetes and graft-versus-host disease. Here, we characterized human DN T cells from people living with type 1 diabetes (PWT1D) and healthy controls. We found that while DN T cells and CD8+ T cells share many similarities, DN T cells are a unique T cell population, both at the transcriptomic and protein levels. We also show that by using various cytokine combinations, human DN T cells can be expanded in vitro up to 1,000-fold (mean >250-fold) and remain functional post-expansion. In addition, we report that DN T cells from PWT1D display a phenotype comparable to that of healthy controls, efficiently expand, and are highly functional. As DN T cells are immunoregulatory and can prevent T1D in various mouse models, these observations suggest that autologous DN T cells may be amenable to therapy for the prevention or treatment of T1D.

Keywords: DN T cells; cell therapy; cellular expansion; tolerance; type 1 diabetes; unconventional T cell.


Conflict of interest statement

The authors declare no competing interests.

Figures

None
Graphical abstract
Figure 1
Figure 1
Human DN T cells represent a unique T cell population with an innate T cell signature (A) PCA plot of CD4+ (CD56TCRαβ+TCRγδCD4+CD8α), CD8+ (CD56TCRαβ+TCRγδCD4CD8α+), DN (CD56TCRαβ+TCRγδCD4CD8α), and TCRγδ+ (CD56TCRαβTCRγδ+) T cells, ex vivo (left) and after in vitro expansion (right), for the 1,000 top DEGs. (B) Venn diagram of DEGs (p < 0.05) from ex vivo (left) and expanded (right) DN T cells and other T cell populations. (C) Summary of DEG number, relative to DN T cells. (D) Heatmap presenting DEGs between ex vivo (left) and expanded (right) DN T cells and other T cell populations. Columns represent individual samples, whereas rows represent normalized gene expression, from blue to red representing low to high expression, respectively. (E) Heatmap representing pathway EnrichmentMap analysis for immune transcriptomic genes sets for ex vivo samples, where each column represents individual samples, whereas rows represent normalized pathway module scores, with a gradient from purple to orange denoting low to high expression.
Figure 2
Figure 2
DN T cells from PWT1D and controls do not differ in proportion, number, and expression of cytokine receptor chains (A) Proportion (left) and absolute number (right) of T cell populations in the blood of control donors (circle, N = 11) and PWT1D (triangle, N = 16). Mean and SD are shown. DN T cells were gated as MR1-tetTCRαβ+CD8αCD8βCD4CD56 (see Figure S3). Statistical significance was tested using Mann-Whitney tests. (B) Gene expression heatmap showing expression of various cytokine receptors from ex vivo and expanded T cell populations. Columns represent individual samples, whereas rows represent normalized gene expression, from blue to red representing low to high expression, respectively. (C) Protein expression of selected cytokine receptor chains by DN T cells ex vivo, measured by flow cytometry. N = 11 (controls) and 16 (PWT1D). Mean and SD are shown.
Figure 3
Figure 3
DN T cells display an activated phenotype (A) Gene expression heatmap representing the expression of activation and exhaustion markers on ex vivo T cell populations. Columns represent individual samples, whereas rows represent normalized gene expression, from blue to red representing low to high expression, respectively. (B) Protein expression heatmap representing the surface protein expression of selected activation and exhaustion markers, measured by flow cytometry. Each box shows the mean frequency of positive cells for a specific marker in controls (N = 11) and PWT1D (N = 16). Blue and red represent low and high expression, respectively. Only significant differences between DN T cells and other populations are indicated, in the last columns. No significant difference was observed for samples from controls and PWT1D for any marker. Naive cells are gated as CCR7+CD45RA+, CM, central memory (CCR7+CD45RA), EM, effector memory (CCR7CD45RA), and EMRA, effector memory CD45RA+ (CCR7CD45RA+). Statistical significance was tested using a one-way ANOVA (Friedman test) followed by Dunn’s multiple comparisons test; ∗p < 0.05; ∗∗p < 0.01; ∗∗∗p < 0.001.
Figure 4
Figure 4
Cytokine combinations alter DN T cell phenotype during in vitro expansion PBMCs were stimulated with anti-CD3 and anti-CD28 antibodies and IL-2, IL-2 and IL-4, or IL-2 and IL-7 for 6 days. (A) The frequency of DN T cells from healthy donors (circle, N = 11) and PWT1D (triangle, N = 16) among total T cells is plotted. Mean and SD are shown. (B) Expression of selected markers were analyzed by flow cytometry on activated DN T cells from healthy donors and PWT1D from A. Protein expression heatmaps for selected activation and exhaustion markers. Each box shows the mean frequency of positive cells (top heatmap) or the mean fluorescence intensity (MFI; bottom heatmap) for a specific marker. Markers with bimodal expression are shown in frequency of positive cells and others are shown with MFI. Blue and red represent low and high expression, respectively. Only significant differences between cells expanded with IL-2 alone and cells expanded with IL-2 + IL-4 or IL-2 + IL-7 are indicated. No significant difference was observed for samples from controls and PWT1D for any marker. Statistical significance was tested using a one-way ANOVA (Friedman test) followed by Dunn’s multiple comparisons test (paired); ∗p < 0.05; ∗∗p < 0.01; ∗∗∗p < 0.001.
Figure 5
Figure 5
Sorted DN T cells can be expanded in the presence of IL-2, IL-4, and IL-7 DN and CD8+ T cells were sorted from PBMCs, stimulated with anti-CD3 and anti-CD28 antibodies, and cultured with IL-2, IL-2, and IL-4 or IL-2 and IL-7. (A) Graphs show the fold expansion after 21 days in culture for DN (left) and CD8+ T cells (right). Filled symbols are from controls and open symbols are from PWT1D. Mean is shown. Statistical significance was tested using a one-way ANOVA (Friedman test) followed by Dunn’s multiple comparisons test. (B) Individual expansion curves of sorted DN and CD8+ T cells. Cell counting and media changes were performed at each point. Each line represents a donor (controls: filled symbols; PWT1D: open symbols).
Figure 6
Figure 6
Expanded DN T cells remain functional and display higher cytotoxicity than donor-matched CD8+ T cells DN and CD8+ T cells were expanded for 21 days in the presence of IL-2, IL-2, and IL-4 or IL-2 and IL-7 prior to co-culture with Jurkat cells for 4 h. (A) Representative flow profiles showing the frequency of dead Jurkat cells (viability dye+), alone (left) or co-cultured with CD8+ (top) or DN (bottom) T cells (E:T ratio of 5:1). (B) Compilation of the frequency of dead Jurkat cells after co-culture with DN or CD8+ T cells, separated by cytokine combination and E:T ratio. Controls are shown with black symbols and PWT1D with white symbols. Mean and SD are shown. (C) Comparison of cytotoxic potential between DN and CD8+ T cells for all culture conditions. Controls are shown with black symbols and PWT1D with white symbols. Data were log2 transformed. Mean and SD are shown. Statistical significance was tested using a two-way ANOVA, followed by Sidak’s multiple comparisons test (paired); ∗p < 0.05; ∗∗p < 0.01; ∗∗∗p < 0.001; ∗∗∗∗p < 0.0001.

Similar articles

References

    1. Godfrey D.I., Uldrich A.P., McCluskey J., Rossjohn J., Moody D.B. The burgeoning family of unconventional T cells. Nat. Immunol. 2015;16:1114–1123. doi: 10.1038/ni.3298. - DOI - PubMed
    1. Mayassi T., Barreiro L.B., Rossjohn J., Jabri B. A multilayered immune system through the lens of unconventional T cells. Nature. 2021;595:501–510. doi: 10.1038/s41586-021-03578-0. - DOI - PMC - PubMed
    1. Martina M.N., Noel S., Saxena A., Rabb H., Hamad A.R.A. Double negative (DN) alphabeta T cells: misperception and overdue recognition. Immunol. Cell Biol. 2015;93:305–310. doi: 10.1038/icb.2014.99. - DOI - PMC - PubMed
    1. Cheroutre H., Lambolez F., Mucida D. The light and dark sides of intestinal intraepithelial lymphocytes. Nat. Rev. Immunol. 2011;11:445–456. doi: 10.1038/nri3007. - DOI - PMC - PubMed
    1. Ribot J.C., Lopes N., Silva-Santos B. gammadelta T cells in tissue physiology and surveillance. Nat. Rev. Immunol. 2021;21:221–232. doi: 10.1038/s41577-020-00452-4. - DOI - PubMed

LinkOut - more resources