

Instance maps as an organising concept for complex experimental workflows as demonstrated for (nano)material safety research
- PMID: 39877837
- PMCID: PMC11773194
- DOI: 10.3762/bjnano.16.7
Instance maps as an organising concept for complex experimental workflows as demonstrated for (nano)material safety research
Abstract
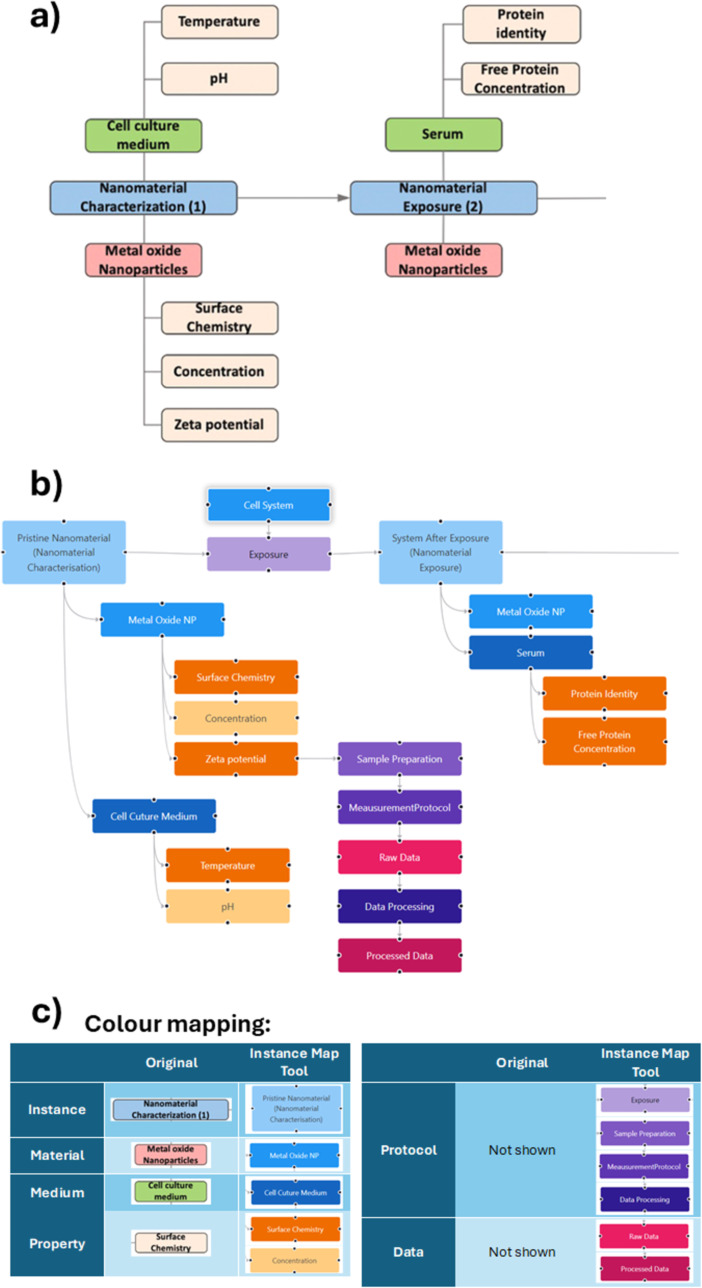
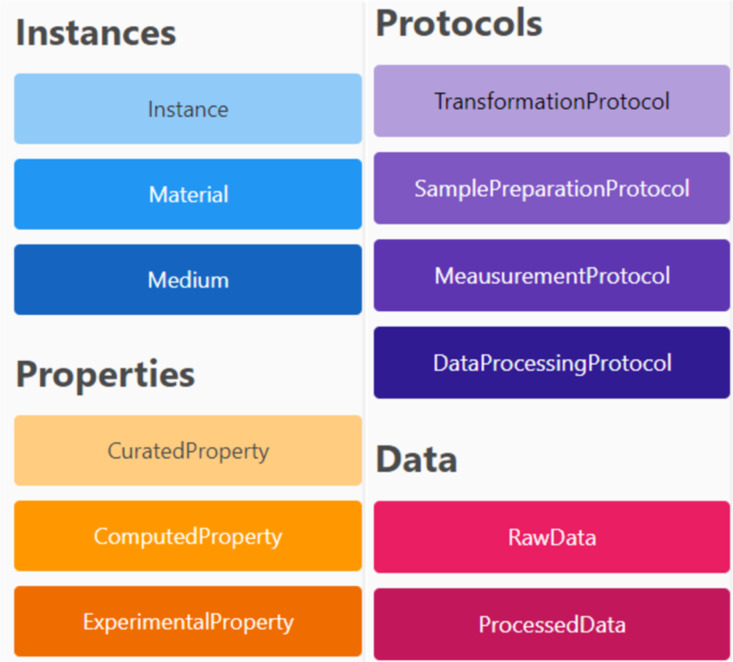
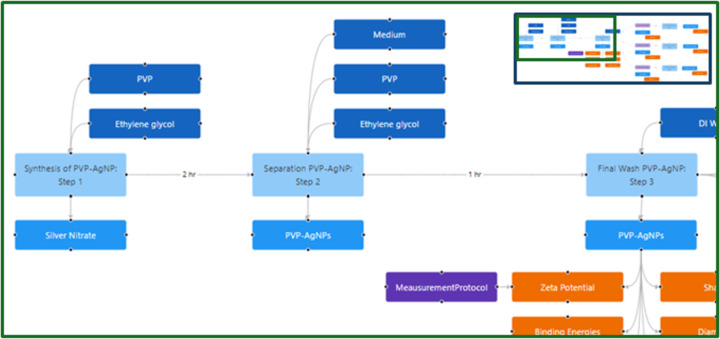
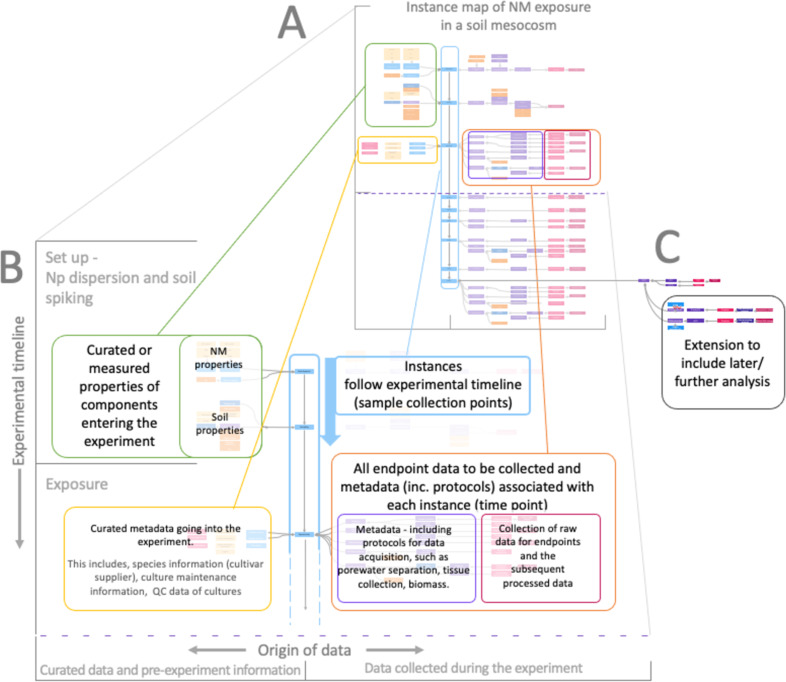
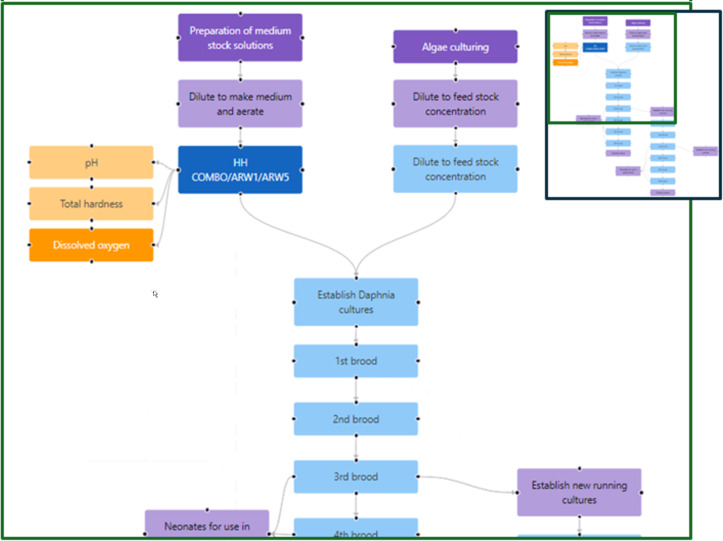
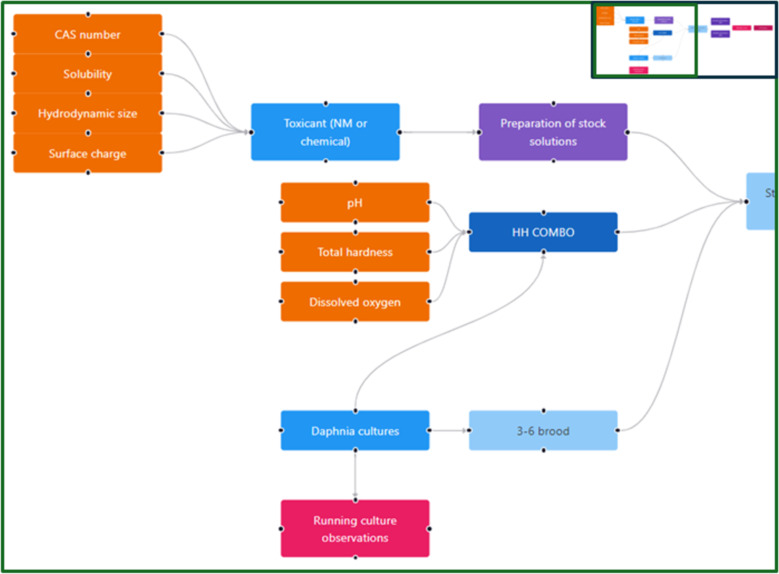
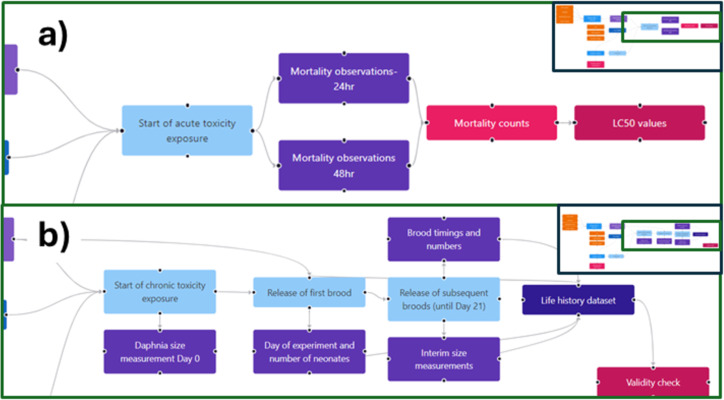
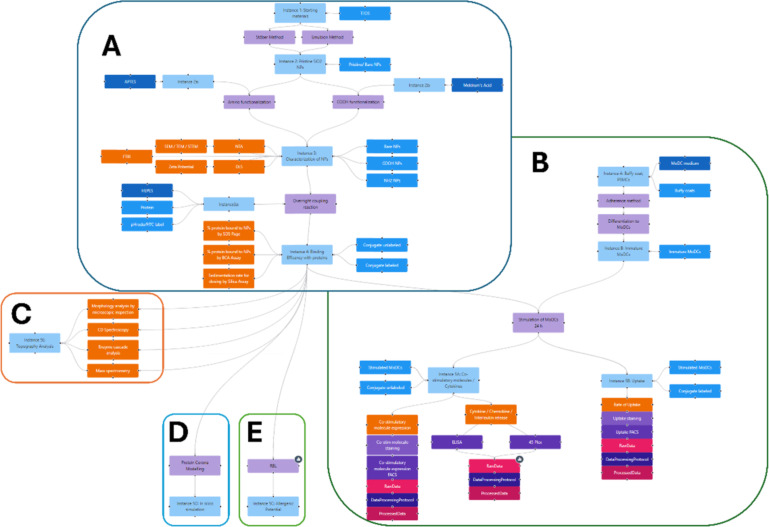
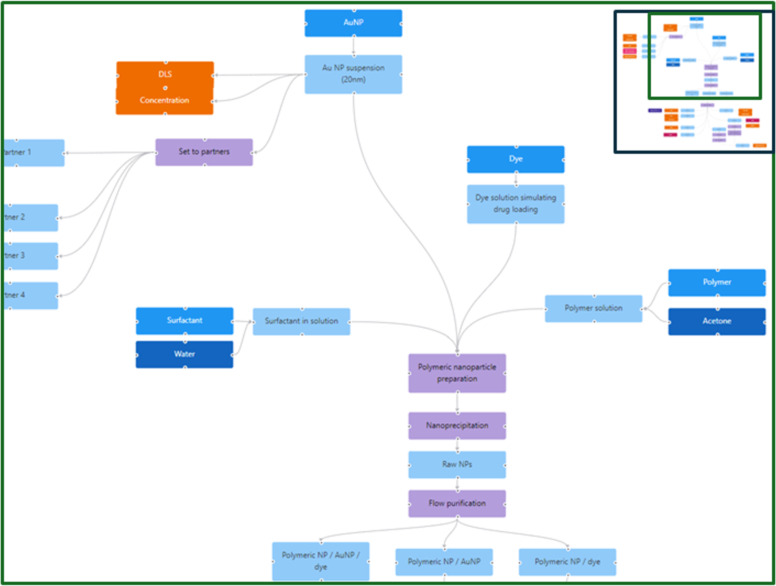
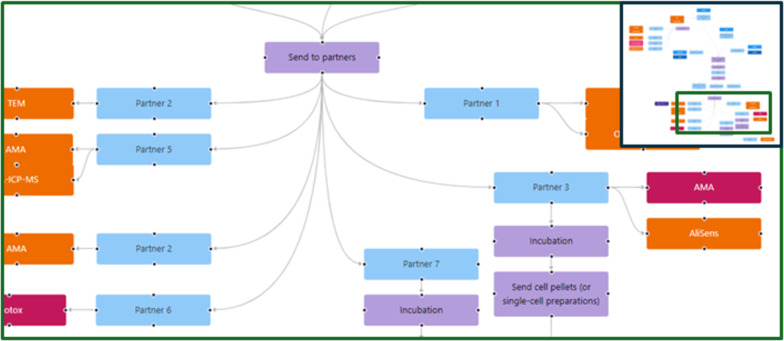
Nanosafety assessment, which seeks to evaluate the risks from exposure to nanoscale materials, spans materials synthesis and characterisation, exposure science, toxicology, and computational approaches, resulting in complex experimental workflows and diverse data types. Managing the data flows, with a focus on provenance (who generated the data and for what purpose) and quality (how was the data generated, using which protocol with which controls), as part of good research output management, is necessary to maximise the reuse potential and value of the data. Instance maps have been developed and evolved to visualise experimental nanosafety workflows and to bridge the gap between the theoretical principles of FAIR (Findable, Accessible, Interoperable and Re-usable) data and the everyday practice of experimental researchers. Instance maps are most effective when applied at the study design stage to associate the workflow with the nanomaterials, environmental conditions, method descriptions, protocols, biological and computational models to be used, and the data flows arising from study execution. Application of the InstanceMaps tool (described herein) to research workflows of increasing complexity is presented to demonstrate its utility, starting from (i) documentation of a nanomaterial's synthesis, functionalisation, and characterisation, over (ii) assessment of a nanomaterial's transformations in complex media, (iii) description of the culturing of ecotoxicity model organisms Daphnia magna and their use in standardised tests for nanomaterials ecotoxicity assessment, and (iv) visualisation of complex workflows in human immunotoxicity assessment using cell lines and primary cellular models, to (v) the use of the instance map approach for the coordination of materials and data flows in complex multipartner collaborative projects and for the demonstration of case studies. Finally, areas for future development of the instance map approach and the tool are highlighted.
Keywords: FAIR; data collection and quality control; data provenance; experimental workflow visualisation; nanomaterial life cycle stages; study design.
Copyright © 2025, Punz et al.
Figures
Similar articles
-
FAIRification of nanosafety data to improve applicability of (Q)SAR approaches: A case study on in vitro Comet assay genotoxicity data.Comput Toxicol. 2021 Nov;20:100190. doi: 10.1016/j.comtox.2021.100190. Comput Toxicol. 2021. PMID: 34820591 Free PMC article.
-
Sharing interoperable workflow provenance: A review of best practices and their practical application in CWLProv.Gigascience. 2019 Nov 1;8(11):giz095. doi: 10.1093/gigascience/giz095. Gigascience. 2019. PMID: 31675414 Free PMC article.
-
Metadata Stewardship in Nanosafety Research: Community-Driven Organisation of Metadata Schemas to Support FAIR Nanoscience Data.Nanomaterials (Basel). 2020 Oct 15;10(10):2033. doi: 10.3390/nano10102033. Nanomaterials (Basel). 2020. PMID: 33076428 Free PMC article.
-
Initiatives, Concepts, and Implementation Practices of the Findable, Accessible, Interoperable, and Reusable Data Principles in Health Data Stewardship: Scoping Review.J Med Internet Res. 2023 Aug 28;25:e45013. doi: 10.2196/45013. J Med Internet Res. 2023. PMID: 37639292 Free PMC article.
-
NanoSolveIT Project: Driving nanoinformatics research to develop innovative and integrated tools for in silico nanosafety assessment.Comput Struct Biotechnol J. 2020 Mar 7;18:583-602. doi: 10.1016/j.csbj.2020.02.023. eCollection 2020. Comput Struct Biotechnol J. 2020. PMID: 32226594 Free PMC article. Review.
Cited by
-
MACRAMÉ - Advanced characterisation methodologies to assess and predict the health and environmental risks of advanced materials.Comput Struct Biotechnol J. 2025 Mar 24;29:95-109. doi: 10.1016/j.csbj.2025.03.032. eCollection 2025. Comput Struct Biotechnol J. 2025. PMID: 40236833 Free PMC article.
-
Going digital to boost safe and sustainable materials innovation markets. The digital safe-and-sustainability-by-design innovation approach of the PINK project.Comput Struct Biotechnol J. 2025 Mar 15;29:110-124. doi: 10.1016/j.csbj.2025.03.019. eCollection 2025. Comput Struct Biotechnol J. 2025. PMID: 40241813 Free PMC article.
References
-
- Sudha P N, Sangeetha K, Vijayalakshmi K, Barhoum A. Chapter 12 - Nanomaterials History, Classification, Unique Properties, Production and Market. In: Barhoum A, Makhlouf A S H, editors. Emerging Applications of Nanoparticles and Architecture Nanostructures. Elsevier; 2018. pp. 341–384. ((Micro and Nano Technologies)). - DOI
-
- Furxhi I, Costa A, Vázquez-Campos S, Fito-López C, Hristozov D, Tamayo Ramos J A, Resch S, Cioffi M, Friedrichs S, Rocca C, et al. RSC Sustainability. 2023;1(2):234–250. doi: 10.1039/d2su00101b. - DOI
-
- Ashik U P M, Viswan A, Kudo S, Hayashi J. Chapter 3 - Nanomaterials as Catalysts. In: Mohan Bhagyaraj S, Oluwafemi O S, Kalarikkal N, et al., editors. Applications of Nanomaterials. Woodhead Publishing; 2018. pp. 45–82. ((Micro and Nano Technologies)). - DOI
-
- Saeed A, Munir S, Gull N, Khan S M. 15 - Nanomaterials for Carbon Capture and Their Conversion to Useful Products for Sustainable Energy Production. In: Rizwan K, Bilal M, editors. Nanomaterials in Biomass Conversion. Woodhead Publishing; 2024. pp. 369–395. ((Woodhead Series in Bioenergy)). - DOI
-
- Shellaiah M, Sun K W. Chemosensors. 2020;8:55. doi: 10.3390/chemosensors8030055. - DOI
LinkOut - more resources
Full Text Sources
Miscellaneous