. 2024 Dec 26;28(2):111695.
doi: 10.1016/j.isci.2024.111695. eCollection 2025 Feb 21.

Resonant song recognition and the evolution of acoustic communication in crickets

Affiliations

Resonant song recognition and the evolution of acoustic communication in crickets

Winston Mann et al. iScience. .

Abstract

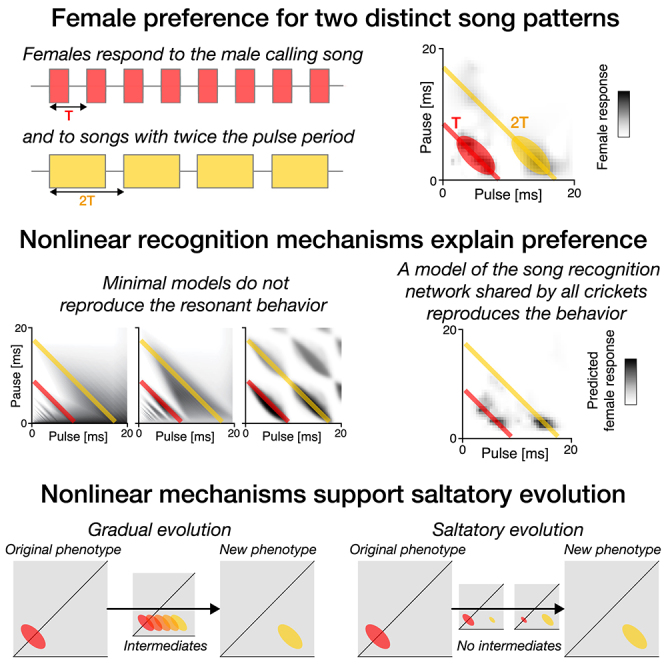
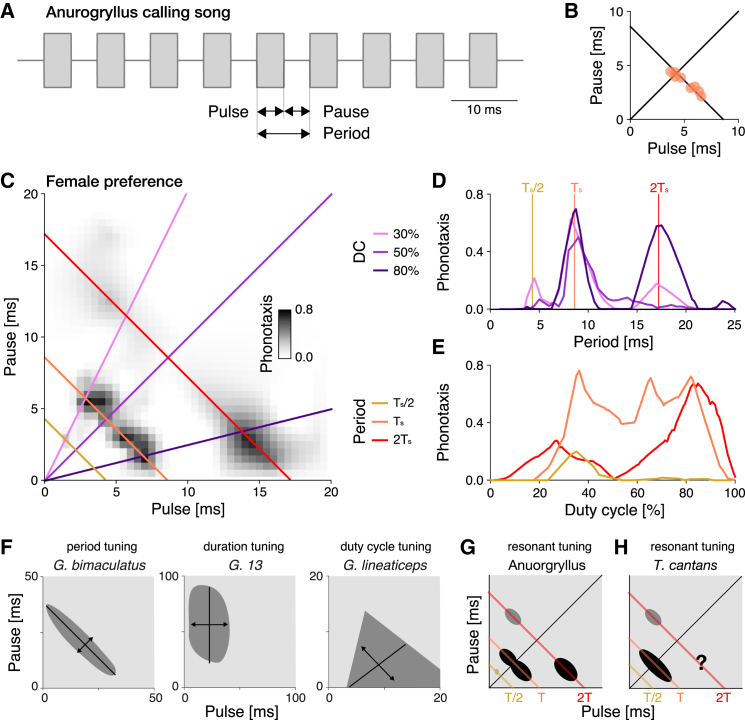
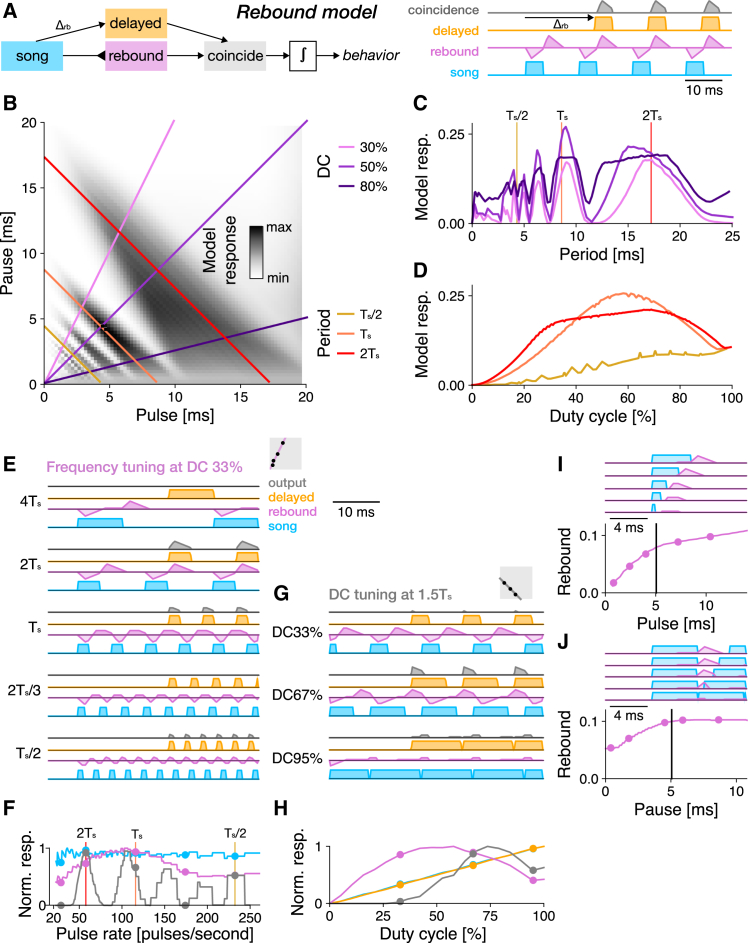
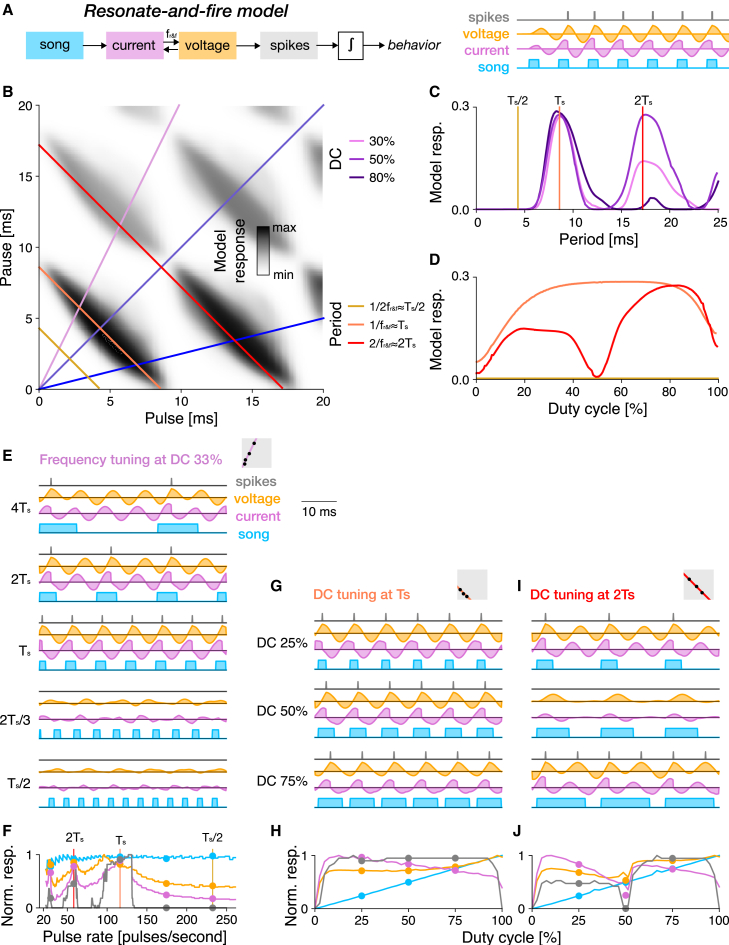
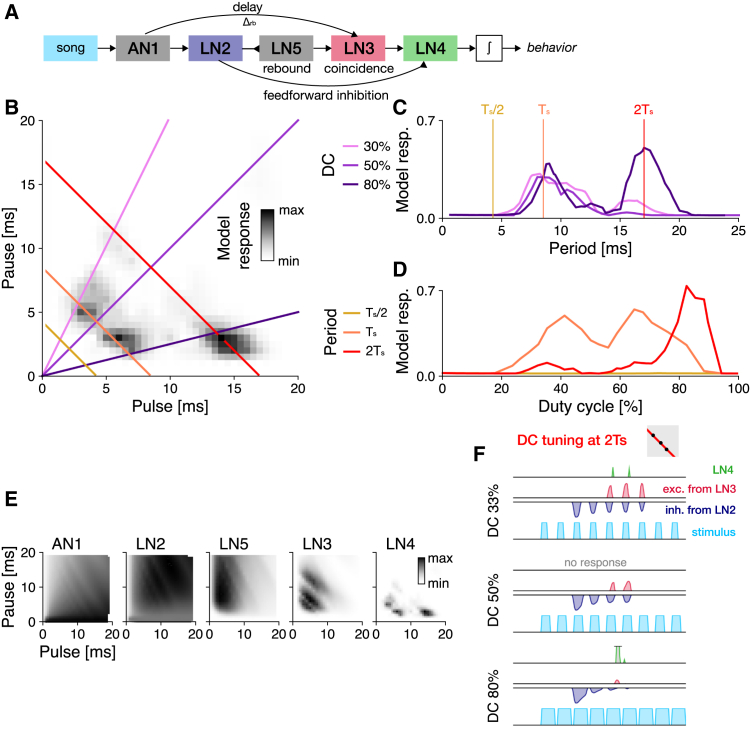
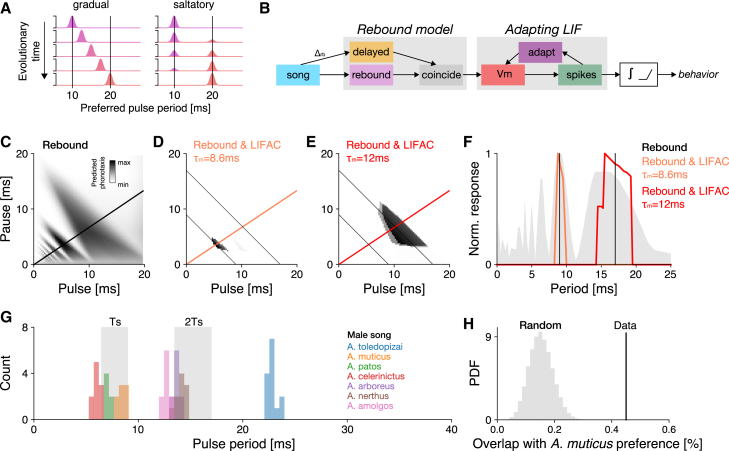
Cricket song recognition is thought to evolve through modifications of a shared neural network. However, the species Anurogryllus muticus has an unusual recognition pattern that challenges this view: females respond to both normal male song pulse periods and periods twice as long. Of the three minimal models tested, only a single-neuron model with an oscillating membrane could explain this unusual behavior. A minimal model of the cricket's song network reproduced the behavior after adding a mechanism that, while present in the full network, is not crucial for song recognition in other species. This shows how a shared neural network can produce diverse behaviors and highlights how different computations contribute to evolution. Our results also demonstrate how nonlinear computations can lead to rapid behavioral changes during evolution because small changes in network parameters can lead to large changes in behavior.

Keywords: Bioacoustics; Entomology; Neuroscience.


Conflict of interest statement

The authors declare no competing interests.

Figures

None
Graphical abstract
Figure 1
Figure 1
Anurogryllus is a cricket species with resonant song recognition (A) Schematic of the calling song of males from the cricket species Anurogryllus muticus (from now referred to as Anurogryllus). The song consists of a train of pulses with a specific pulse duration and pause. The period is the sum of pulse and pause and corresponds to the song’s rhythm. The duty cycle (DC) is the percentage of the period occupied by the pulse and corresponds to the song’s energy. (B) Pulse and pause parameters from eight Anurogryllus males. The diagonal line corresponds to a DC of 50%, the anti-diagonal to the average pulse period Ts=8.6 ms. See Table 1 for all song parameters. (C) Female phonotaxis for pulse trains with different duration and pause parameters visualized as a pulse-pause field (PPF). Phonotaxis is color coded with darker greys representing stronger phonotactic responses (see color bar). Diagonal lines indicate stimuli with DCs of 30, 50, and 80%, shown in D as the phonotaxis along these diagonals. The anti-diagonal lines show transects with constant period stimuli shown in E at the average pulse period of the male song Ts (orange), at half (Ts/2, yellow), and twice (2Ts, red) the song period. Females respond strongly to pulse patterns with the period of the males’ song, but also at twice that period, indicating resonant song recognition. See Table S1 for the statistical significance of the individual peaks. The PPF was obtained by the interpolation of the average phonotaxis values measured for 75 artificial stimuli in 3–8 females (Fig. S1). (D) Period tuning as a function of DC given by three transects through the PPF in C (see legend in C). Vertical lines indicate Ts/2 (yellow), Ts (orange), and 2Ts (red). (E) DC tuning as a function of song period, derived from transects through the PPF in C (see legend in C). (F) The three previously known female preference types for the pulse pattern of the male calling song in different cricket species: period (left), duration (middle), and DC (right). The solid black lines indicate the major or most tolerant axis that defines the tuning type, and the double sided arrows perpendicular to the major axis show the most sensitive feature axis. (G) Schematic of resonant recognition from Anurogryllus, simplified from C. (H) Resonant recognition from the katydid Tettigonia cantans. The question mark indicates the range of stimulus parameters not tested in the original study. Anti-diagonal lines in G and H indicate stimuli with Ts/2 (yellow), Ts (orange), and 2Ts (red). See also Fig. S1 and Table S1.
Figure 2
Figure 2
An autocorrelation model produces resonant tuning (A) In the autocorrelation model, a non-delayed (blue) and delayed (orange) copy of the stimulus are multiplied in a coincidence detector (gray). The output of the coincidence detector is integrated over the stimulus to predict the model response. The example traces show coincidence for a song with a pulse period that equals the delay Δac. (B) PPF for the autocorrelation model fitted to the preference data in 1C. Predicted response values are coded in greyscale (see color bar). Colored lines correspond to the DC and period transects shown in C and D (see legend). (C) Period tuning of the autocorrelation model for different DCs (see legend in B). Resonant peaks arise at even and odd fractions of the delay parameter Δac2Ts. Vertical lines indicate the pulse period transects shown in B. (D) DC tuning for three different pulse periods (see legend in B), corresponding to Ts/2, TS, and 2T. DC tuning is high-pass for all periods. (E) Response traces from the autocorrelation model for songs with different periods (fractions and multiples of Ts) and a DC of 33%. Resonant peaks arise from coincidence at integer fractions (e.g., 1Δac/2=2Ts/3) but not at multiples (2Δac=4Ts) of the delay parameter (stimulus–blue, delayed stimulus–orange, response–grey, see legend to the right). (F) Pulse rate tuning given by the integral of the stimulus (blue), the delayed stimulus (orange), and the response (gray) at 33% DC. Response peaks arise at integer multiples and fractions of Δac. Dots indicate pulse patterns shown in E. Vertical lines indicate the song periods shown in D. (G and H) Response traces for different DCs (25, 50, 75%) (G) and DC tuning (H) at a non-resonant pulse rate (1.5Ts=12.9 ms). Increasing the DC leads to coincidence even at this non-resonant pulse rate. Same color code as in E, F. Gray boxes in E and G illustrate the stimulus parameters for which traces are shown in the context of the PPF (compare B).
Figure 3
Figure 3
Tuning for pulse rate and duty cycle in the rebound model fitted to Anurorgryllus behavior (A) The rebound model is an extension of the autocorrelation model. The non-delayed branch (purple) is sign-inverted (blunt ended arrow indicates inhibition) and filtered by a bi-phasic filter to produce transient responses at pulse offsets that mimic a post-inhibitory rebound. The positive part of the rebound and the delayed stimulus are then combined through coincidence detection. (B) PPF for the rebound model fitted to the preference data in Figure 1C. Predicted response values are color coded (see color bar). Colored lines correspond to the DC and period transects shown in C and D (see legend). (C) Period tuning of the rebound model for different DCs (see legend in C). Vertical lines correspond to the pulse period transects shown in B. (D) DC tuning for three different pulse periods (see legend in C). DC tuning is high-pass for short periods (Ts/2, yellow) and band-pass for intermediate and long periods (Ts (orange), 2Ts (red)). (E) Response traces of the rebound model for songs with different periods (fractions and multiples of Ts) and a DC of 33% (stimulus–blue, rebound response–pink, delayed stimulus–orange, response–grey, see legend to the right). (F) Pulse rate tuning given by the integral of the stimulus. Dots indicate periods shown in E. (G and H) Response traces for a DC sweep (33, 67, 95%) (G) and DC tuning (H) at a non-resonant period of 1.5Ts=12.9 ms. Even at this non-resonant period, responses increase with DC, consistent with the broadening of the response peaks with DC in B and C. Responses decrease at very high DCs (short pauses), because the rebound is truncated by the next pulse (see J). Same color scheme as in E, F. (I and J) Integral of the rebound as a function of pulse duration (I) and pause (J). Dots in the curves (bottom) indicate example traces shown on top of each curve. A minimum pulse duration and pause duration (black lines) are required for the rebound to fully develop. At short pauses the rebound is interrupted by the following pulse (J). Gray boxes in E and G illustrate the stimulus parameters for which traces are shown in the context of the PPF (compare B).
Figure 4
Figure 4
Tuning for pulse rate and duty cycle in the resonate and fire model fitted to Anurogryllus behavior (A) The resonate-and-fire (R&F) model is a spiking neuron model with bidirectionally coupled current (purple) and voltage-like (orange) variables. Inputs currents trigger oscillations with a frequency ω. Inputs are excitatory during positive phases and inhibitory during negative phases of the oscillations. If the voltage exceeds a threshold, a spike (gray) is elicited and the current and voltage are reset. (B) Pulse-pause field (PPF) for the R&F model fitted to Anurogryllus data. Colored lines correspond to the DC and period transects shown in C and D (see legend). (C) Period tuning of the R&F model for different DCs. Resonant peaks arise at integer multiples of Ts. The response at 2Ts is attenuated for lower DCs, as in the behavior. Vertical lines correspond to the periods shown in D. (D) DC tuning for three different pulse periods. There is no peak for Ts/2. At Ts, the DC tuning is band-pass. At 2Ts, the DC tuning is bimodal, as in the data. (E) Response traces for the R&F model for songs with different periods (fractions and multiples of Ts) and a DC of 33% (stimulus–blue, current–pink, voltage–orange, spikes–grey, see legend). Membrane oscillations and responses are weak at fractions at Ts. Responses are strong at integer multiples of Ts. (F) Pulse rate tuning at DC 33%. Shown are the integrals of the stimulus (blue) and spiking response (gray). The current-like (pink) and voltage-like (orange) variables were rectified before integration. (G and I) Response traces for different DCs at Ts (G) and 2Ts (I). (H and J) DC tuning at Ts (H) and 2Ts (J). Dots mark the stimuli shown in G and I. DC tuning is unimodal at Ts and bimodal at 2Ts. Gray boxes in E, G, and I illustrate the stimulus parameters for which traces are shown in the context of the PPF (compare B).
Figure 5
Figure 5
A model of the full song recognition network in crickets reproduces the resonant tuning of Anurogryllus (A) Schematic of the full 5-neuron network and internal connections. Pointy and blunt ended arrows indicate excitation and inhibition, respectively. Delay (AN1-LN3), rebound (LN5), and coincidence (LN3) are computations of the core rebound mechanism (Figure 3). Feedforward inhibition from LN2 to LN4 is crucial for reproducing DC tuning. (B) The resonant phenotype of Anurogryllus recovered with the five neuron model. Colored lines correspond to the period and DC transects in D and E. (C) Period tuning at 33%, 50%, and 80% DC, which each reveal the relative strength of the peaks at Ts/2, Ts, and 2Ts. There is no response at the shortest period (Ts/2—yellow). At the period of male song (Ts—orange), DC tuning is band-pass. At the 17 ms period (2Ts—red), DC tuning is biphasic, as observed in the behavioral data. Vertical lines correspond to the DCs shown in C. (D) DC tuning for the different periods labeled in B, which shows that each peak has unique DC preferences. Compared with the behavioral data in Figure 1 which shows that Anurogryllus similarly demonstrates a bandpass preference around the male calling song Ts, and a preference for high DCs for the 2Ts peak. (E) Response profiles of the five neurons in the network. (F) Response traces for three songs (blue) along the 2Ts period transect at different DCs, showing the interaction of the excitatory coincidence detection output from LN3 (red) and the inhibition from LN2 (blue) to produce the output response in LN4 (green). The gray box in F illustrates the stimulus parameters for which traces are shown in the context of the PPF (compare B). See also Fig. S2.
Figure 6
Figure 6
Resonances enable the saltatory evolution of song preferences (A) Evolution of the period preference (top to bottom) in a population under a gradual (left) and saltatory (right) mode. Under a gradual mode, small changes in the preference lead to a shift of the preference over time. Under a saltatory mode, the preference function of individuals jumps to a new peak and that new peak gets fixated without intermediates. (B) Structure of the rebound model with adaptation. The non-integrated output of the rebound model from Figure 3 was used to drive a leaky integrate and fire neuron with an adaptation current (LIFAC). The spike output of the LIFAC is then integrated to yield a value proportional to the phonotaxis. A rectifying nonlinearity (relu) is then used to further sharpen the tuning for the song. (C) PPF of the rebound model with resonant peaks used as the input to the LIFAC (same as Figure 3C). The two resonant peaks at 9 ms and 17 ms are shown as thin black anti-diagonal lines. The thicker black diagonal line shows the transect at a DC of 66% shown in F. (D and E) PPFs of the rebound-and-LIFAC model. The resonant peaks at 9 ms and 17 ms (thin black lines) were isolated by setting membrane time constants τm to 8.6 (D) and 12.2 m (E), respectively. The orange and red diagonal lines correspond to the transects at a DC of 66% shown in F. (F) Period tuning of the models in B–D for a transect through the PPF at a DC of 66%. (G) Distribution of song periods for seven Anurogryllus species. The gray shaded regions depict the responses of A. muticus females to the period of the male song (Ts) and to twice that period (2Ts) (cf. Figures 1C and 1D). (H) Overlap between songs from the 7 species and the resonant bands in the preference function of A. muticus females (gray bands in G) in the data (overlap 45%, black line) and under a random uniform model (gray histogram, 100,000 random samples, average overlap 15%). The observed overlap is unlikely to have arisen from that model (p<1012).

Similar articles

References

    1. Zhu J., Boivin J.-C., Pang S., Xu C.S., Lu Z., Saalfeld S., Hess H.F., Ohyama T. Comparative connectomics and escape behavior in larvae of closely related Drosophila species. Curr. Biol. 2023;33:2491–2503.e4. doi: 10.1016/j.cub.2023.05.043. - DOI - PubMed
    1. Bumbarger D.J., Riebesell M., Rödelsperger C., Sommer R.J. System-wide Rewiring Underlies Behavioral Differences in Predatory and Bacterial-Feeding Nematodes. Cell. 2013;152:109–119. doi: 10.1016/j.cell.2012.12.013. - DOI - PubMed
    1. Coleman R.T., Morantte I., Koreman G.T., Cheng M.L., Ding Y., Ruta V. A modular circuit architecture coordinates the diversification of courtship strategies in Drosophila. bioRxiv. 2023 doi: 10.1101/2023.09.16.558080. Preprint at: - DOI - PMC - PubMed
    1. Ye D., Walsh J.T., Junker I.P., Ding Y. Changes in the cellular makeup of motor patterning circuits drive courtship song evolution in Drosophila. Curr. Biol. 2024;34:2319–2329.e6. doi: 10.1016/j.cub.2024.04.020. - DOI - PMC - PubMed
    1. Seeholzer L.F., Seppo M., Stern D.L., Ruta V. Evolution of a central neural circuit underlies Drosophila mate preferences. Nature. 2018;559:564–569. doi: 10.1038/s41586-018-0322-9. - DOI - PMC - PubMed

LinkOut - more resources