. 2025 Jan 24;53(3):gkaf031.
doi: 10.1093/nar/gkaf031.

Telomemore enables single-cell analysis of cell cycle and chromatin condensation

Affiliations

Telomemore enables single-cell analysis of cell cycle and chromatin condensation

Iryna Yakovenko et al. Nucleic Acids Res. .

Abstract

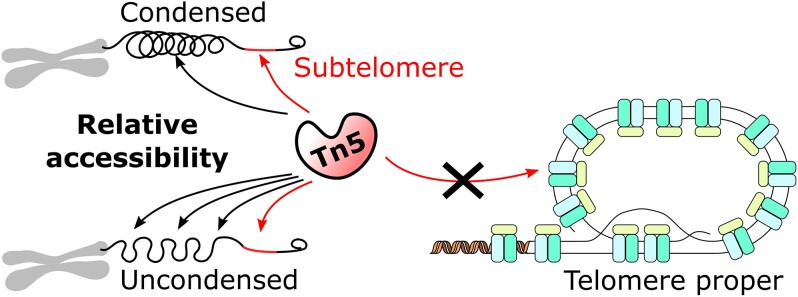
Single-cell RNA-seq methods can be used to delineate cell types and states at unprecedented resolution but do little to explain why certain genes are expressed. Single-cell ATAC-seq and multiome (ATAC + RNA) have emerged to give a complementary view of the cell state. It is however unclear what additional information can be extracted from ATAC-seq data besides transcription factor binding sites. Here, we show that ATAC-seq telomere-like reads counter-inituively cannot be used to infer telomere length, as they mostly originate from the subtelomere, but can be used as a biomarker for chromatin condensation. Using long-read sequencing, we further show that modern hyperactive Tn5 does not duplicate 9 bp of its target sequence, contrary to common belief. We provide a new tool, Telomemore, which can quantify nonaligning subtelomeric reads. By analyzing several public datasets and generating new multiome fibroblast and B-cell atlases, we show how this new readout can aid single-cell data interpretation. We show how drivers of condensation processes can be inferred, and how it complements common RNA-seq-based cell cycle inference, which fails for monocytes. Telomemore-based analysis of the condensation state is thus a valuable complement to the single-cell analysis toolbox.


Conflict of interest statement

J.T. is employed at the Sartorius. I.S.M. is employed at Umeå University but partially funded by the Sartorius. Other authors declare no conflict of interest.

Figures

Graphical Abstract
Graphical Abstract
Figure 1.
Figure 1.
Telomere repeat k-mer-based counting of ATAC-seq libraries does not correlate with telomere length measurement. (A) ATAC-seq is a modern method in which accessible chromatin is “tagmented,” i.e. fragmented by the enzyme Tn5, which also adds adapters for sequencing. These fragments are normally used to analyze enhancers. (B) Components of the genome, as discussed in the paper. Tandem repeats of TTAGGG are also present in the subtelomere, which does not have a clear end. We refer to the outermost tandem repeat as the “telomere proper,” and what is neither telomere, subtelomere, nor centromere, as “chromatin proper.” (C) Normalized abundance of TTAGGG (nTA) across PBMC ATAC-seq datasets does not correlate with age. The common method to infer telomere length from WGS data does thus not seem to work for ATAC-seq. The batches A–D are described in methods. (D) There is a large variation in nTA across different datasets and ATAC-seq methodologies. The B cell and fibroblast multiome datasets are included in this study; the T-cell dataset is in a separate publication [101]; RPM, repeats per million. (E) Comparison of nTA in PBMCs across multiple technologies [102]. (F) The ATAC-seq nTA does not show correlation to telomere length in TCGA cancer samples. The cancer type does not appear to influence the correlation (three outliers cropped; legend in Supplementary Fig. S2B). (G) Average motif of telomere-like reads, after alignment by GC content. (H) Deduplication shows that motif-containing reads have large sequence diversity.
Figure 2.
Figure 2.
The telomere proper appears to be protected from transposition. (A) Experimental setup to find the precise insertion sites of Tn5 during ATAC-seq; Tn5 with nonfragmenting inserts target the genomic DNA, which is then mechanically sheared, and sequenced using PacBio. (B) Example coverage of the T2T genome (chromosome 1) and detected Tn5 inserts beneath. (C) Telomere k-mer-based content can estimate relative telomere lengths for cell lines of known length (i.e. the frequency is much lower in Jurkat than CCRF), (D) but not when Tn5-insert-containing reads alone are counted (the frequencies are similar). (E) The ratio of nTAs between cell lines (which should be ∼0.25) is more correct when searching for shorter telomere repeats, possibly because higher match stringency leads to loss of valid reads. (F) Fraction of Tn5 insertions in all fragments versus those in the telomere, indicating poor coverage transposition of the telomere proper. (G) Per-base motif analysis around transpositions; possible relative placements of the full TTAGGG telomeric motif, as suggested by the per-base motif, shown below. (H) Abundance of telomere motif near transposase inserts, showing a strong location preference that might be further reinforced by chromatin structure. (I) No duplication of genomic target sequence is seen, contrary to previous reports [68].
Figure 3.
Figure 3.
Differential accessibility of telomere-like repeat regions pinpoint broad chromatin condensation events. (A) Bulk ATAC-seq nTA from GM12878 cells FACS-sorted by cell cycle stage [69]. The nTA of S-phase is less than that of non-S-phase (P= .005). (B) Pileup of telomere-like reads along T2T chromosome 1, suggesting primarily a subtelomeric origin. (C) nTA broken down by chromosome, showing that they all co-vary similarly with cell cycle. (D) Similarity of bulk ATAC-seq dataset as indicated by Mash and k-mer similarity. (E) Cell cycle has little effect on the distribution of telomere motif length. (F) A convolutional neural network model to predict the origin of reads; MSE, mean squared error (G). Abundance of telomere-like reads in the different genomic regions versus cell cycle, according to the neural network model. For telomere + subtelomere, the nTA of S-phase is less than that of non-S-phase (P= .014). (H) Bulk ATAC-seq nTA in human and mouse CD4 T helper type 2 cells during the first 72 h of activation, which is a synchronized entry to S-phase. The nTA drops as expected (arrow drawn manually, conceptual only). TEM images showing the rapid chromatin decondensation have been generated previously [71]; CPM, counts per million. A linear model indicates that nTA decreases over time, for both the human (P= 5.1 × 10–7) and mouse (P= 1.0 × 10–12) time course. (I) The proposed model of why nTA correlates with chromatin condensation.
Figure 4.
Figure 4.
Telomere-like read abundance is sufficient for single-cell interpretation. (A) UMAP of a new atlas of primary colonic human fibroblasts cells (one single reaction); nTA is the lowest in S-phase, consistent with bulk measurements (Fig. 3). Quality control panels indicicate number of ATAC and RNAseq fragments. (B) UMAP of 3T3 cells, previously measured by scGET-seq [73]; this method measures both open and closed chromatin for direct computation of relative openness, which is negatively correlated with nTA. The panels indicate rank nTA, the openness defined as the ratio of Tn5 to tnH fragments, number of Tn5 and TnH fragments.
Figure 5.
Figure 5.
Comparison of monocyte telomere accessibility versus cell cycle. (A) UMAP of monocyte cells in the 10X Genomics PBMC multiome dataset, showing the nTA, markers for subsets, and RNA-based prediction of cell cycle phase. Based on the possible elevation of nTA in the nonclassical subset, we performed further analysis of condensation. CDKN1C is one of the most correlating genes with nTA that is likely to explain condensation in terms of cell cycle. (B) FACS gating for the sorting of different monocyte populations. (C) DAPI staining of monocyte populations to determine cell cycle phase distribution. (D) Images of monocyte populations, where classical monocytes appear bigger and more grainy than the nonclassical subset.
Figure 6.
Figure 6.
ATAC-seq across tissues and cell types pinpoints TFs linked to chromatin condensation. (A) Mean and variance of correlations of motifs versus nTA, across cells from a previous whole-body atlas [21]. (B) Normalized mean correlation removes GC effect on variance. (C) nTA across epithelial cells treated with TGFb fits the microscopy-validated chromatin opening [84]. (D) Analysis of SMAD motif activities during treatment. (E) Expression of corresponding genes Smad1-9 from RNA-seq. Smad9 is on average < 1 TPM (transcripts per million), all other at least 50 TPM.
Figure 7.
Figure 7.
A multiome atlas of tonsillar human B cells. (A) UMAP of all B cells. (B) Expression levels of representative marker genes for all B cells. (C) UMAP of germinal center B cells only. (D) Expression level of representative marker genes for the germinal center B cells. (E) Expression of AICDA and some of the genes most correlating with nTA.

Similar articles

References

    1. Allsopp RC, Vaziri H, Patterson C et al. . Telomere length predicts replicative capacity of human fibroblasts. Proc Natl Acad Sci USA. 1992; 89:10114–8.10.1073/pnas.89.21.10114. - DOI - PMC - PubMed
    1. Lim CJ, Cech TR. Shaping human telomeres: from shelterin and CST complexes to telomeric chromatin organization. Nat Rev Mol Cell Biol. 2021; 22:283–98.10.1038/s41580-021-00328-y. - DOI - PMC - PubMed
    1. Savage SA. Beginning at the ends: telomeres and human disease. F1000Res. 2018; 7:524.10.12688/f1000research.14068.1. - DOI - PMC - PubMed
    1. Heaphy CM, Meeker AK. The potential utility of telomere-related markers for cancer diagnosis. J Cell Mol Med. 2011; 15:1227–38.10.1111/j.1582-4934.2011.01284.x. - DOI - PMC - PubMed
    1. Tham C-Y, Poon L, Yan T et al. . High-throughput telomere length measurement at nucleotide resolution using the PacBio high fidelity sequencing platform. Nat Commun. 2023; 14:281.10.1038/s41467-023-35823-7. - DOI - PMC - PubMed

LinkOut - more resources