

Pattern Separation and Pattern Completion Within the Hippocampal Circuit During Naturalistic Stimuli
- PMID: 39878229
- PMCID: PMC11775762
- DOI: 10.1002/hbm.70150
Pattern Separation and Pattern Completion Within the Hippocampal Circuit During Naturalistic Stimuli
Abstract
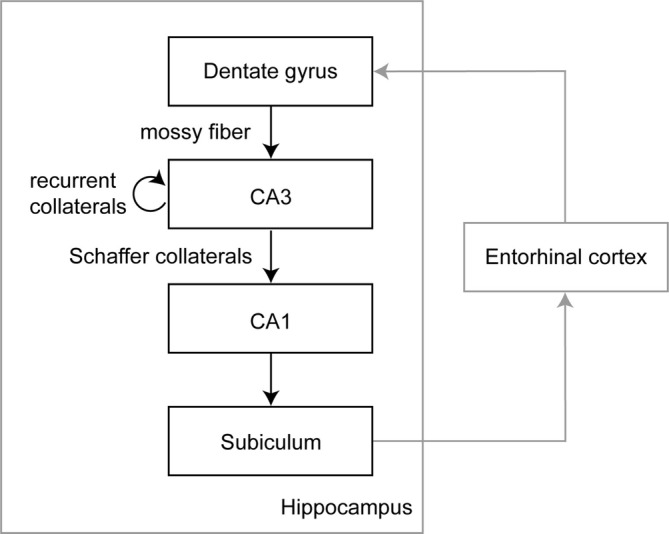
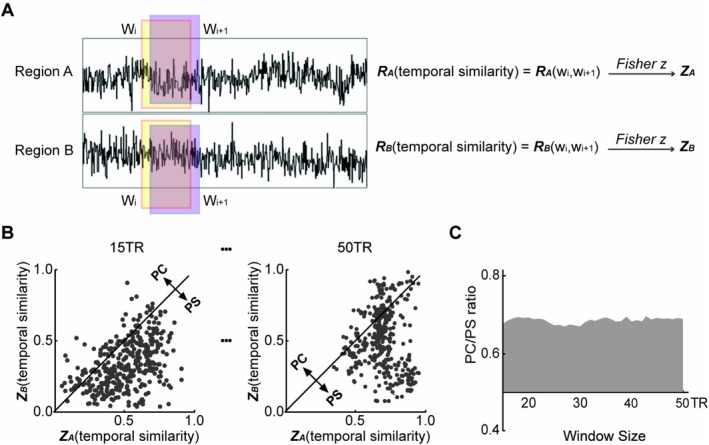
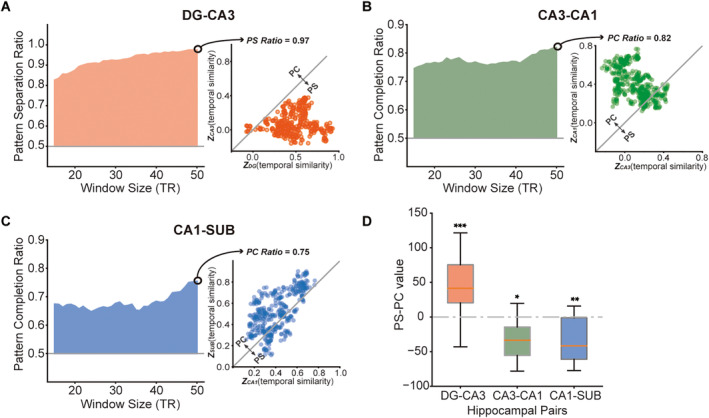
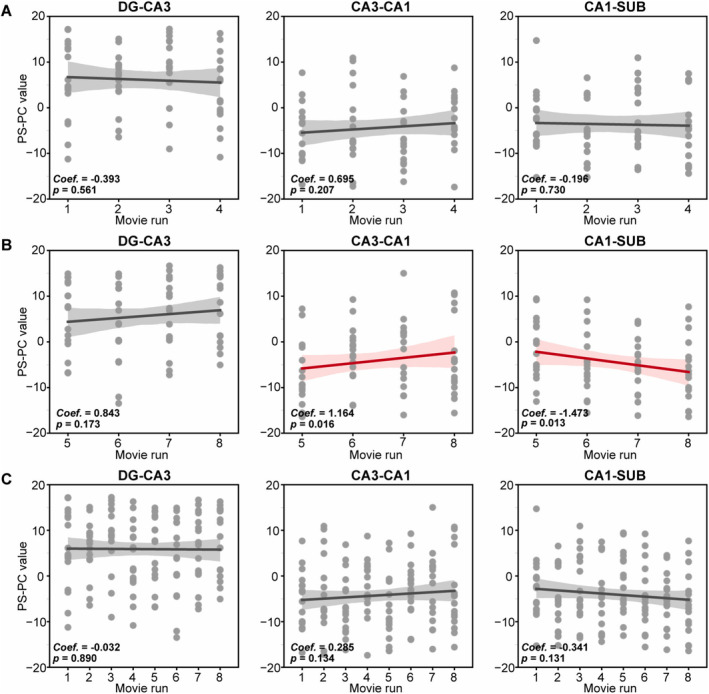
Pattern separation and pattern completion in the hippocampus play a critical role in episodic learning and memory. However, there is limited empirical evidence supporting the role of the hippocampal circuit in these processes during complex continuous experiences. In this study, we analyzed high-resolution fMRI data from the "Forrest Gump" open-access dataset (16 participants) using a sliding-window temporal autocorrelation approach to investigate whether the canonical hippocampal circuit (DG-CA3-CA1-SUB) shows evidence consistent with the occurrence of pattern separation or pattern completion during a naturalistic audio movie task. Our results revealed that when processing continuous naturalistic stimuli, the DG-CA3 pair exhibited evidence consistent with the occurrence of the pattern separation process, whereas both the CA3-CA1 and CA1-SUB pairs showed evidence consistent with pattern completion. Moreover, during the latter half of the audio movie, we observed evidence consistent with a reduction in pattern completion in the CA3-CA1 pair and an increase in pattern completion in the CA1-SUB pair. Overall, these findings improve our understanding of the evidence related to the occurrence of pattern separation and pattern completion processes during natural experiences.
Keywords: fMRI; hippocampal subfields; naturalistic stimuli; pattern completion; pattern separation.
© 2025 The Author(s). Human Brain Mapping published by Wiley Periodicals LLC.
Conflict of interest statement
The authors declare no conflicts of interest.
Figures
Similar articles
-
Memory Reactivation during Learning Simultaneously Promotes Dentate Gyrus/CA2,3 Pattern Differentiation and CA1 Memory Integration.J Neurosci. 2021 Jan 27;41(4):726-738. doi: 10.1523/JNEUROSCI.0394-20.2020. Epub 2020 Nov 25. J Neurosci. 2021. PMID: 33239402 Free PMC article.
-
Pattern separation and completion of distinct axonal inputs transmitted via micro-tunnels between co-cultured hippocampal dentate, CA3, CA1 and entorhinal cortex networks.J Neural Eng. 2018 Aug;15(4):046009. doi: 10.1088/1741-2552/aabc20. Epub 2018 Apr 6. J Neural Eng. 2018. PMID: 29623900 Free PMC article.
-
Complementary roles of human hippocampal subfields in differentiation and integration of spatial context.J Cogn Neurosci. 2015 Mar;27(3):546-59. doi: 10.1162/jocn_a_00736. Epub 2014 Sep 30. J Cogn Neurosci. 2015. PMID: 25269116 Free PMC article.
-
Tracking the flow of hippocampal computation: Pattern separation, pattern completion, and attractor dynamics.Neurobiol Learn Mem. 2016 Mar;129:38-49. doi: 10.1016/j.nlm.2015.10.008. Epub 2015 Oct 26. Neurobiol Learn Mem. 2016. PMID: 26514299 Free PMC article. Review.
-
Functional differentiation in the transverse plane of the hippocampus: An update on activity segregation within the DG and CA3 subfields.Brain Res Bull. 2021 Jun;171:35-43. doi: 10.1016/j.brainresbull.2021.03.003. Epub 2021 Mar 13. Brain Res Bull. 2021. PMID: 33727088 Free PMC article. Review.
References
-
- Axmacher, N. , Mormann F., Fernández G., Elger C. E., and Fell J.. 2006. “Memory Formation by Neuronal Synchronization.” Brain Research Reviews 52, no. 1: 170–182. - PubMed
-
- Baker, S. , Vieweg P., Gao F., et al. 2016. “The Human Dentate Gyrus Plays a Necessary Role in Discriminating New Memories.” Current Biology 26, no. 19: 2629–2634. - PubMed
MeSH terms
Grants and funding
LinkOut - more resources
Full Text Sources
Miscellaneous
