. 2025 Jan 1;18(1):dmm050883.
doi: 10.1242/dmm.050883. Epub 2025 Jan 29.

Multi-omics analysis reveals distinct gene regulatory mechanisms between primary and organoid-derived human hepatocytes

Affiliations

Multi-omics analysis reveals distinct gene regulatory mechanisms between primary and organoid-derived human hepatocytes

Haoyu Wu et al. Dis Model Mech. .

Abstract

Hepatic organoid cultures are a powerful model to study liver development and diseases in vitro. However, hepatocyte-like cells differentiated from these organoids remain immature compared to primary human hepatocytes (PHHs), which are the benchmark in the field. Here, we applied integrative single-cell transcriptome and chromatin accessibility analysis to reveal gene regulatory mechanisms underlying these differences. We found that, in mature human hepatocytes, activator protein 1 (AP-1) factors co-occupy regulatory regions with hepatocyte-specific transcription factors, including HNF4A, suggesting their potential cooperation in governing hepatic gene expression. Comparative analysis identified distinct transcription factor sets that are specifically active in either PHHs or intrahepatic cholangiocyte organoid (ICO)-derived human hepatocytes. ELF3 was one of the factors uniquely expressed in ICO-derived hepatocytes, and its expression negatively correlated with hepatic marker gene expression. Functional analysis further revealed that ELF3 depletion increased the expression of key hepatic markers in ICO-derived hepatocytes. Our integrative analysis provides insights into the transcriptional regulatory networks of PHHs and hepatic organoids, thereby informing future strategies for developing improved hepatic models.

Keywords: ELF3; Gene regulatory network; Intrahepatic cholangiocyte organoids; Primary human hepatocytes; scRNA-seq.


Conflict of interest statement

Competing interests The authors declare no competing or financial interests.

Figures

Fig. 1.
Fig. 1.
Single-cell RNA-sequencing (scRNA-seq) analysis shows that liver zonation is the main driver of heterogeneity observed in primary human hepatocytes (PHHs). (A) Overview of single-cell isolation from liver segments following a modified two-step perfusion protocol and fluorescence-activated cell sorting workflow. (B,C) Uniform manifold approximation and projection (UMAP) plots of scRNA-seq data colored by donors (left) and cluster number (right). (D) Heatmap showing the correlation of selected zonal genes between hepatocyte clusters identified in this study and the nine layers of mouse liver lobule (L1, central; L9 periportal). Generated using data from Halpern et al. (2017). (E) Violin plots showing expression of representative zonal markers (periportal: ALB, ALDOB and SDS; pericentral: CYP3A4, CYP1A2 and GLUL) across hepatocyte clusters.
Fig. 2.
Fig. 2.
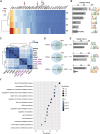
Gene regulatory network analysis identifies co-occupancy of AP-1 and liver-specific transcription factors in PHHs. (A) Heatmap of enrichment of regulons [shown as average area under the recovery curve (AUC) score] identified in the four hepatocyte clusters. Regulons in gray font represent regulons in which non-direct motifs were used for prediction of potential targets of the transcription factors (TFs) and co-regulators; regulons in black font represent regulons in which direct motifs were used for prediction of potential targets of the TFs and co-regulators (see Materials and Methods). Red arrows point at the well-known hepatic TFs. (B) List of the top 6 motifs enriched in assay for transposase-accessible chromatin using sequencing (ATAC-seq) peaks in PHHs. Motifs are ranked by −log10(P-value). (C) Heatmap of Spearman correlation matrix of normalized TF binding intensities in open chromatin regions in PHHs as identified by ATAC-seq. TFs in black font are from liver; TFs in purple font are from K562 lymphoblast cell line (as control). (D) Venn diagram showing the intersection between binding sites of HNF4A and those of JUND, ATF3 and EGR1, respectively. (E) Motifs enriched in overlapping chromatin immunoprecipitation sequencing (ChIP-seq) peak regions of HNF4A and those of JUND, ATF3 and EGR1 (as in D), respectively. Motifs were ranked based on −log10(P-value). (F) Dot plot of Gene Ontology (GO) analysis (biological process), showing the selected significant [adjusted P (adj-P)<0.05] pathways enriched for the HNF4A and JUND co-bound genes. Circle color indicates the significance of the enrichment, while the size represents the gene ratio.
Fig. 3.
Fig. 3.
Integrative analysis of scRNA-seq and ATAC-seq identifies distinct TFs required in PHHs and intrahepatic cholangiocyte organoids (ICOs). (A) UMAP of scRNA-seq data from PHHs, ICOs maintained in expansion medium (EM-ICOs) and ICOs maintained in differentiation medium (DM-ICOs) (top), and heatmap showing the expression of the top 3 marker genes in z-score format for each cell type (bottom). Cells are colored based on the cell type. (B) Heatmap of the AUC score of selected regulons in each single cell from PHHs and ICOs as analyzed by single-cell regulatory network inference and clustering (SCENIC). Colors of each cell type match those of A. (C) Expression UMAPs of JUND, FOS, XBP1, YY1, MLXIPL, PPARGC1A, EHF and ELF3. Data were normalized to sequencing depth and are shown in log2 format. (D) Principal component (PC) analysis plot showing the similarities of the genome-wide chromatin state between PHHs, EM-ICOs and DM-ICOs. Biological replicates are shown in different shapes, and cell types are shown in different colors as in A. (E) Venn diagram showing the intersection between ATAC peaks of PHHs, EM-ICOs and DM-ICOs. (F) Heatmap showing motif enrichment analysis between PHHs, EM-ICOs and DM-ICOs in z-score format using Gimme Motif maelstrom. Motifs of interest are shown on the right.
Fig. 4.
Fig. 4.
ELF3 depletion promotes hepatic differentiation in ICOs in vitro. (A) Experimental setup of siRNA transfection during hepatic differentiation of ICOs. ICOs were maintained in EM. EM-ICOs were first cultured in EM plus BMP7 for 5 days. On Day 5 during the differentiation, ICOs were transfected with siRNA [siCon (control siRNAs) and siELF3] and switched to DM until Day 8 (Day 3 post-transfection). Cells were harvested for RNA isolation for quantitative PCR. (B) Reverse transcription quantitative PCR (RT-qPCR) results comparing the expression of ELF3 with the expression of hepatocyte markers ALB, CYP3A4 and GLUL in three different ICO clones after differentiation. Correlation (r) and P-value were calculated using Pearson correlation analysis. (C) RT-qPCR results showing the expression levels of ELF3 as well as those of hepatocyte markers ALB, CYP3A4, TTR, GC and GLUL in ELF3-targeting or non-targeting control siRNA-transfected DM-ICOs. Paired two-tailed Student’s t-test P-values are indicated above the graphs. GAPDH was used for normalization.

References

    1. Aibar, S., Jang, S.-I., Chung, E., Coticchia, C. M., Steinert, P. M. and Markova, N. G. (2018). SCENIC: single-cell regulatory network inference and clustering. Nat. Methods 14, 1083-1086. 10.1038/nmeth.4463.SCENIC - DOI - PMC - PubMed
    1. Aizarani, N., Saviano, A., Sagar, Mailly, L., Durand, S., Herman, J. S., Pessaux, P., Baumert, T. F. and Grün, D. (2019). A human liver cell atlas reveals heterogeneity and epithelial progenitors. Nature 572, 199-204. 10.1038/s41586-019-1373-2 - DOI - PMC - PubMed
    1. Andreoli, J. M., Jang, S.-I., Chung, E., Coticchia, C. M., Steinert, P. M. and Markova, N. G. (1997). The expression of a novel, epithelium-specific ets transcription factor is restricted to the most differentiated layers in the epidermis. Nucleic Acids Res. 25, 4287-4295. 10.1093/nar/25.21.4287 - DOI - PMC - PubMed
    1. Andrews, T. S., Atif, J., Liu, J. C., Perciani, C. T., Ma, X.-Z., Thoeni, C., Slyper, M., Eraslan, G., Segerstolpe, A., Manuel, J.et al. (2022). Single-cell, single-nucleus, and spatial RNA sequencing of the human liver identifies cholangiocyte and mesenchymal heterogeneity. Hepatol. Commun. 6, 821-840. 10.1002/hep4.1854 - DOI - PMC - PubMed
    1. Besse-Patin, A., Jeromson, S., Levesque-Damphousse, P., Secco, B., Laplante, M. and Estall, J. L. (2019). PGC1A regulates the IRS1:IRS2 ratio during fasting to influence hepatic metabolism downstream of insulin. Proc. Natl. Acad. Sci. USA 116, 4285-4290. 10.1073/pnas.1815150116 - DOI - PMC - PubMed