

Human-derived microRNA 21 regulates indole and L-tryptophan biosynthesis transcripts in the gut commensal Bacteroides thetaiotaomicron
- PMID: 39878512
- PMCID: PMC11898669
- DOI: 10.1128/mbio.03928-24
Human-derived microRNA 21 regulates indole and L-tryptophan biosynthesis transcripts in the gut commensal Bacteroides thetaiotaomicron
Abstract
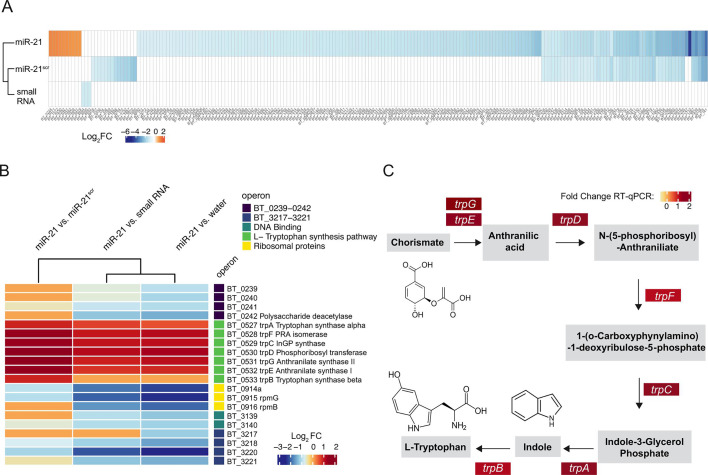
In the gut, microRNAs (miRNAs) produced by intestinal epithelial cells are secreted into the lumen and can shape the composition and function of the gut microbiome. Crosstalk between gut microbes and the host plays a key role in irritable bowel syndrome (IBS) and inflammatory bowel diseases, yet little is known about how the miRNA-gut microbiome axis contributes to the pathogenesis of these conditions. Here, we investigate the ability of miR-21, a miRNA that we found decreased in fecal samples from IBS patients, to associate with and regulate gut microbiome function. When incubated with the human fecal microbiota, miR-21 revealed a rapid internalization or binding to microbial cells, which varied in extent across different donor samples. Fluorescence-activated cell sorting and sequencing of microbial cells incubated with fluorescently labeled miR-21 identified organisms belonging to the genera Bacteroides, Limosilactobacillus, Ruminococcus, or Coprococcus, which predominantly interacted with miR-21. Surprisingly, these and other genera also interacted with a miRNA scramble control, suggesting that physical interaction and/or uptake of these miRNAs by gut microbiota is not sequence-dependent. Nevertheless, transcriptomic analysis of the gut commensal Bacteroides thetaiotaomicron revealed a miRNA sequence-specific effect on bacterial transcript levels. Supplementation of miR-21, but not of small RNA controls, resulted in significantly altered levels of many cellular transcripts and increased transcription of a biosynthetic operon for indole and L-tryptophan, metabolites known to regulate host inflammation and colonic motility. Our study identifies a novel putative miR-21-dependent pathway of regulation of intestinal function through the gut microbiome with implications for gastrointestinal conditions.
Importance: The mammalian gut represents one of the largest and most dynamic host-microbe interfaces. Host-derived microRNAs (miRNAs), released from the gut epithelium into the lumen, have emerged as important contributors to host-microbe crosstalk. Levels of several miRNAs are altered in the stool of patients with irritable bowel syndrome or inflammatory bowel disease. Understanding how miRNAs interact with and shape gut microbiota function is crucial as it may enable the development of new targeted treatments for intestinal diseases. This study provides evidence that the miRNA miR-21 can rapidly associate with diverse microbial cells form the gut and increase levels of transcripts involved in tryptophan synthesis in a ubiquitous gut microbe. Tryptophan catabolites regulate key functions, such as gut immune response or permeability. Therefore, this mechanism represents an unexpected host-microbe interaction and suggests that host-derived miR-21 may help regulate gut function via the gut microbiota.
Keywords: gut microbiota; host-microbe interactions; irritable bowel syndrome; microRNAs; transcriptomics.
Conflict of interest statement
The authors declare no conflict of interest.
Figures


Similar articles
-
Profiles and interactions of gut microbiome and intestinal microRNAs in pediatric Crohn's disease.mSystems. 2024 Sep 17;9(9):e0078324. doi: 10.1128/msystems.00783-24. Epub 2024 Aug 16. mSystems. 2024. PMID: 39150251 Free PMC article.
-
The function of the gut microbiota-bile acid-TGR5 axis in diarrhea-predominant irritable bowel syndrome.mSystems. 2024 Mar 19;9(3):e0129923. doi: 10.1128/msystems.01299-23. Epub 2024 Feb 8. mSystems. 2024. PMID: 38329942 Free PMC article.
-
Intestinal IgA Regulates Expression of a Fructan Polysaccharide Utilization Locus in Colonizing Gut Commensal Bacteroides thetaiotaomicron.mBio. 2019 Nov 5;10(6):e02324-19. doi: 10.1128/mBio.02324-19. mBio. 2019. PMID: 31690674 Free PMC article.
-
Impact of Bacterial Metabolites on Gut Barrier Function and Host Immunity: A Focus on Bacterial Metabolism and Its Relevance for Intestinal Inflammation.Front Immunol. 2021 May 26;12:658354. doi: 10.3389/fimmu.2021.658354. eCollection 2021. Front Immunol. 2021. PMID: 34122415 Free PMC article. Review.
-
Impact of the Gut Microbiota on Intestinal Immunity Mediated by Tryptophan Metabolism.Front Cell Infect Microbiol. 2018 Feb 6;8:13. doi: 10.3389/fcimb.2018.00013. eCollection 2018. Front Cell Infect Microbiol. 2018. PMID: 29468141 Free PMC article. Review.
Cited by
-
Exploring the Gut Microbiota-Retina Axis: Implications for Health and Disease.Microorganisms. 2025 May 10;13(5):1101. doi: 10.3390/microorganisms13051101. Microorganisms. 2025. PMID: 40431274 Free PMC article. Review.
References
-
- Tap J, Derrien M, Törnblom H, Brazeilles R, Cools-Portier S, Doré J, Störsrud S, Le Nevé B, Öhman L, Simrén M. 2017. Identification of an intestinal microbiota signature associated with severity of irritable bowel syndrome. Gastroenterology 152:111–123. doi:10.1053/j.gastro.2016.09.049 - DOI - PubMed
-
- Vervier K, Moss S, Kumar N, Adoum A, Barne M, Browne H, Kaser A, Kiely CJ, Neville BA, Powell N, Raine T, Stares MD, Zhu A, De La Revilla Negro J, Lawley TD, Parkes M. 2022. Two microbiota subtypes identified in irritable bowel syndrome with distinct responses to the low FODMAP diet. Gut 71:1821–1830. doi:10.1136/gutjnl-2021-325177 - DOI - PMC - PubMed
-
- Johnsen PH, Hilpüsch F, Cavanagh JP, Leikanger IS, Kolstad C, Valle PC, Goll R. 2018. Faecal microbiota transplantation versus placebo for moderate-to-severe irritable bowel syndrome: a double-blind, randomised, placebo-controlled, parallel-group, single-centre trial. Lancet Gastroenterol Hepatol 3:17–24. doi:10.1016/S2468-1253(17)30338-2 - DOI - PubMed
MeSH terms
Substances
Grants and funding
LinkOut - more resources
Full Text Sources
Molecular Biology Databases
