. 2025 Jan 31;11(5):eadq4545.
doi: 10.1126/sciadv.adq4545. Epub 2025 Jan 29.

Replication-incompetent VSV-based vaccine elicits protective responses against SARS-CoV-2 and influenza virus

Affiliations

Replication-incompetent VSV-based vaccine elicits protective responses against SARS-CoV-2 and influenza virus

Richard A Adeleke et al. Sci Adv. .

Abstract

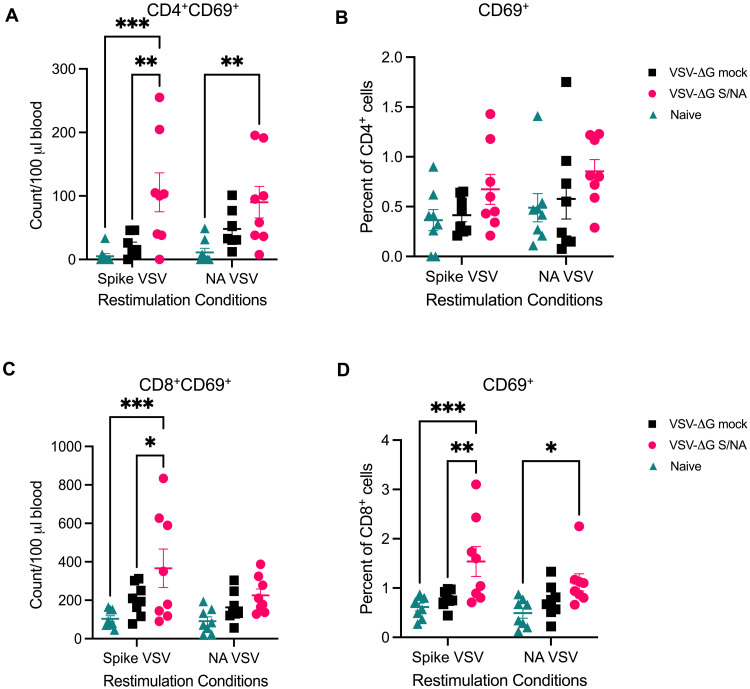
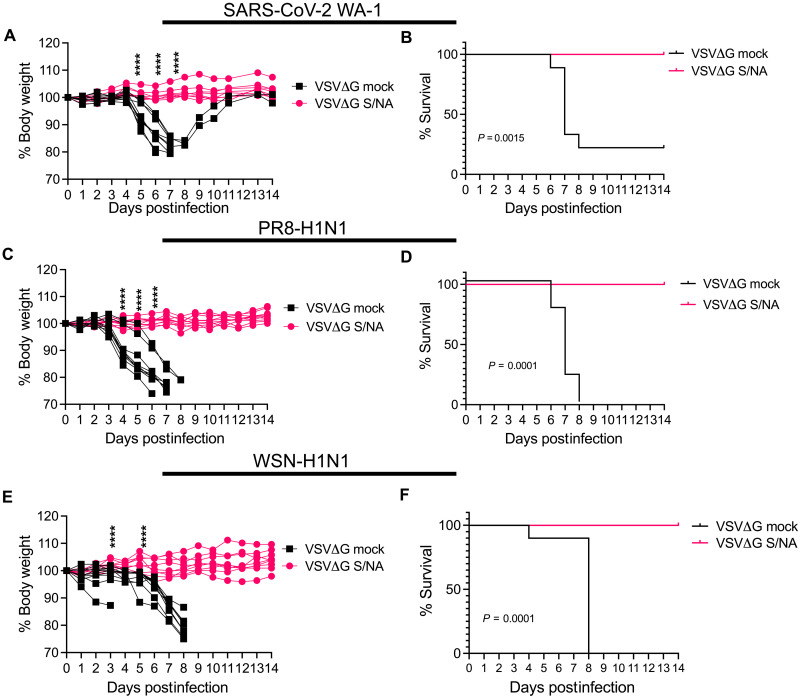
Severe acute respiratory syndrome coronavirus 2 (SARS-CoV-2) and influenza viruses lead to severe respiratory illnesses and death in humans, exacerbated in individuals with underlying health conditions, remaining substantial global public health concerns. Here, we developed a bivalent replication-incompetent single-cycle pseudotyped vesicular stomatitis virus vaccine that incorporates both a prefusion-stabilized SARS-CoV-2 spike protein lacking a furin cleavage site and a full-length influenza A virus neuraminidase protein. Vaccination of K18-hACE2 or C57BL/6J mouse models generated durable levels of neutralizing antibodies, T cell responses, and protection from morbidity and mortality upon challenge with either virus. Furthermore, the vaccine provided heterologous protection upon challenge with a different influenza virus strain, supporting the advantage of using NA to increase the breadth of vaccine protection. Now, no bivalent vaccine is approved for use against both SARS-CoV-2 and influenza virus. Our study supports using this platform to develop safe and efficient vaccines against multiple viruses.


Figures

Fig. 1.
Fig. 1.. Optimized production of pseudotyped monovalent or bivalent VSV particles.
(A) Schematic of the SARS-CoV-2 S construct used for vaccine design with a C-terminal FLAG tag. The S1 subunit contains the N-terminal domain (N), signal peptide (SP), RBD, and the S2 subunit contains the fusion peptide (FP), heptad repeats 1 and 2 (HR1 and HR2), transmembrane domain (TMD), and cytoplasmic tail (CT). (B) Schematic of PR8-H1N1 NA used for vaccine design showing a C-terminal FLAG tag. (C) Cotransfection of HEK293T cells with plasmids encoding SARS-CoV-2 WA-1 S and PR8-H1N1 NA glycoproteins, followed by VSV-∆G infection (green virion), to generate bivalent VSV particles. The released pseudotyped VSV virions coincorporate the two glycoproteins. Monovalent VSV particles (S∆CS-2P or NA) were generated by separate transfections of SARS-CoV-2 S or PR8-H1N1 NA, followed by VSV-∆G infection. h, hours. (D) Western blot analysis on VSV virions obtained from cotransfection of varying ratios of plasmid DNA encoding S and NA in HEK293T cells. (E) Comparison of proteolytic cleavage of wild-type S (SWT), showing an S2 band, with mutant S containing the cleavage site (CS) deletion (S∆CS-2P), showing no S2 band, when cotransfected with NA (SWT/NA or S∆CS-2P /NA). (F to H) Representative cryo-EM micrograph from S only, NA only, and S and NA virions. Magnification, ×63,000; scale bars, 100 nm. Illustration created with BioRender (C).
Fig. 2.
Fig. 2.. Bivalent vaccine induces NAb responses.
(A) Vaccination protocol for K18-hACE2 and C57BL/6J mouse models. (B) Pseudotyped SARS-CoV-2 S neutralization in K18-hACE2 mice. NT50 values: VSV-∆G S/NA day 21 (10−3), day 28 (10−5), and day 35 (10−6). (C) NA enzymatic activity inhibition in C57BL/6J mice (day 7 after boost). NT50 values: VSV-∆G S/NA day 28 (10−4). (D) SARS-CoV-2 plaque inhibition by sera 5 days after boost. (E) SARS-CoV-2 plaque inhibition by pooled sera 8 months after boost. (F) NA enzymatic activity inhibition 8 months after boost in K18-hACE2 mice. NT50 values: VSV-∆G S/NA 8 months (10−2). Data were normalized to mock-vaccinated sera (B, C, and F). Sigmoidal curves and error bars were generated using GraphPad Prism (nonlinear regression) (B, C, and F), and statistical analysis was performed with two-way ANOVA and Tukey’s test (D and E). Error bars represent SD.
Fig. 3.
Fig. 3.. Vaccinated mice T cells respond to monovalent S/NA pseudotyped virions.
(A) Count and (B) percent of CD69 expression on CD4+ T cells following restimulation with VSV-∆G S or VSV-∆G NA particles. (C) Count and (D) percent of CD69 expression on CD8+ T cells following restimulation with VSV-∆G S or VSV-∆G NA particles. Data were analyzed by two-way ANOVA and Tukey’s post hoc test.
Fig. 4.
Fig. 4.. Bivalent vaccine protects mice against live virus challenge.
(A) Weight loss and (B) percent survival following SARS-CoV-2 infection in K-18 hACE2 mice [(vaccinated: four males and four females), (mock: five males and four females)]. (C) Weight loss and (D) percent survival following homologous challenge with PR8-H1N1 [A/Puerto Rico/8/1934 (H1N1)] in C57BL/6J mice [(vaccinated: five males and five females), (mock: five males and five females)]. (E) Weight loss and (F) percent survival following heterologous challenge with WSN-H1N1 [A/WSN/1933(H1N1)] infection in C57BL/6J mice [(vaccinated: five males and four females), (mock: five males and five females)]. Two-way ANOVA with Sidak’s multiple comparisons test (A, C, and E). Percent survival was analyzed using a log-rank (Mantel-Cox) test (B, D, and F).
Fig. 5.
Fig. 5.. Vaccination reduces viral load and pathology upon SARS-CoV-2 WA-1 infection.
(A) Vaccination protocol and SARS-CoV-2 challenge in K18-hACE2 mice. (B) Weight loss trends at 6 dpi in vaccinated and control mice. (C and D) Viral RNA levels in lungs (C) and brains (D) measured by qRT-PCR. (E and F) Live virus titers in lung (E) and brain (F) tissues by plaque assays. (G and H) H&E staining of lung (G) and brain (H) tissues showing reduced perivascular (arrowhead) and interstitial infiltrates (arrow) in vaccinated mice. Scale bars, 1 mm (top) and 100 μm (bottom). (I and J) IHC of SARS-CoV-2 nucleoprotein (arrowhead) in lungs (I) and brains (J) showing reduced staining in vaccinated mice. Scale bars, 1 mm (top) and 100 μm (bottom). (K and L) Quantification of lung (K) and brain (L) pathological changes. n.s., not significant. (M and N) Quantification of SARS-CoV-2 N staining in lungs (M) and brains (N). Data were analyzed using two-way ANOVA with Sidak’s test (B) and two-tailed Mann-Whitney tests (C to F and K to N). Means ± SEM are shown. All data are from 6 dpi.
Fig. 6.
Fig. 6.. Vaccination reduces virus titers and pathology upon PR8-H1N1 infection.
(A) Vaccination protocol and PR8-H1N1 challenge in C57BL/6J mice. (B) Weight loss trends at 5 dpi in vaccinated and control mice. (C) Lung viral RNA levels at 5 dpi, measured by qRT-PCR. Data analyzed by two-tailed Mann-Whitney test (means ± SEM). (D) H&E staining of lung tissues showing reduced perivascular infiltrates (arrowheads), bronchiolar inflammation, and debris (*) in vaccinated mice. Arrows indicate alveolar cells. Scale bars, 1 mm (low magnification) and 50 μm (high magnification). (E) Quantification of lung histopathology following PR8-H1N1 infection. (F) Live virus titers in lung tissues at 5 dpi using foci reduction assay. Data analyzed by unpaired t test (means ± SEM). FFU, focus-forming units. (G) IHC of influenza A nucleoprotein in lung tissues, showing reduced bronchiolar (arrowheads) and alveolar (arrows) immunolabeling in vaccinated mice. Scale bars, 1 mm (top) and 100 μm (bottom). Statistical tests: two-way ANOVA with Sidak’s test (B), Mann-Whitney test (C and E), and unpaired t test (F). Data shown as means ± SEM.
Fig. 7.
Fig. 7.. Pooled monovalent vaccine protects comparably to bivalent vaccine against influenza.
(A) Outline of vaccination protocol for K18-hACE2 mouse model (pooled monovalent: four males and three females; bivalent vaccine: four males and four females; mock: four males and four females). (B) Western blot analysis of pooled monovalent and bivalent VSV particles. (C) Weight loss and (D) percent survival following infection with PR8-H1N1 [A/Puerto Rico/8/1934 (H1N1)]. Data analyzed by two-way ANOVA with mixed-effect models with the Geisser-Greenhouse correction (C). Percent survival was analyzed using a log-rank (Mantel-Cox) test (D).

Similar articles

References

    1. Lamers M. M., Haagmans B. L., SARS-CoV-2 pathogenesis. Nat. Rev. Microbiol. 20, 270–284 (2022). - PubMed
    1. Fukuyama S., Kawaoka Y., The pathogenesis of influenza virus infections: The contributions of virus and host factors. Curr. Opin. Immunol. 23, 481–486 (2011). - PMC - PubMed
    1. Regan J. J., Moulia D. L., Link-Gelles R., Godfrey M., Mak J., Najdowski M., Rosenblum H. G., Shah M. M., Twentyman E., Meyer S., Peacock G., Thornburg N., Havers F. P., Saydah S., Brooks O., Talbot H. K., Lee G. M., Bell B. P., Mahon B. E., Daley M. F., Fleming-Dutra K. E., Wallace M., Use of updated COVID-19 vaccines 2023–2024 formula for persons aged ≥6 months: Recommendations of the Advisory Committee on Immunization Practices—United States, September 2023. MMWR Morb. Mortal. Wkly Rep. 72, 1140–1146 (2023). - PMC - PubMed
    1. Yamayoshi S., Kawaoka Y., Current and future influenza vaccines. Nat. Med. 25, 212–220 (2019). - PubMed
    1. Wei C.-J., Crank M. C., Shiver J., Graham B. S., Mascola J. R., Nabel G. J., Next-generation influenza vaccines: Opportunities and challenges. Nat. Rev. Drug Discov. 19, 239–252 (2020). - PMC - PubMed

MeSH terms