. 2025 Jan 29;17(783):eadq1086.
doi: 10.1126/scitranslmed.adq1086. Epub 2025 Jan 29.

Prior vaccination prevents overactivation of innate immune responses during COVID-19 breakthrough infection

Collaborators, Affiliations

Prior vaccination prevents overactivation of innate immune responses during COVID-19 breakthrough infection

Leslie Chan et al. Sci Transl Med. .

Abstract

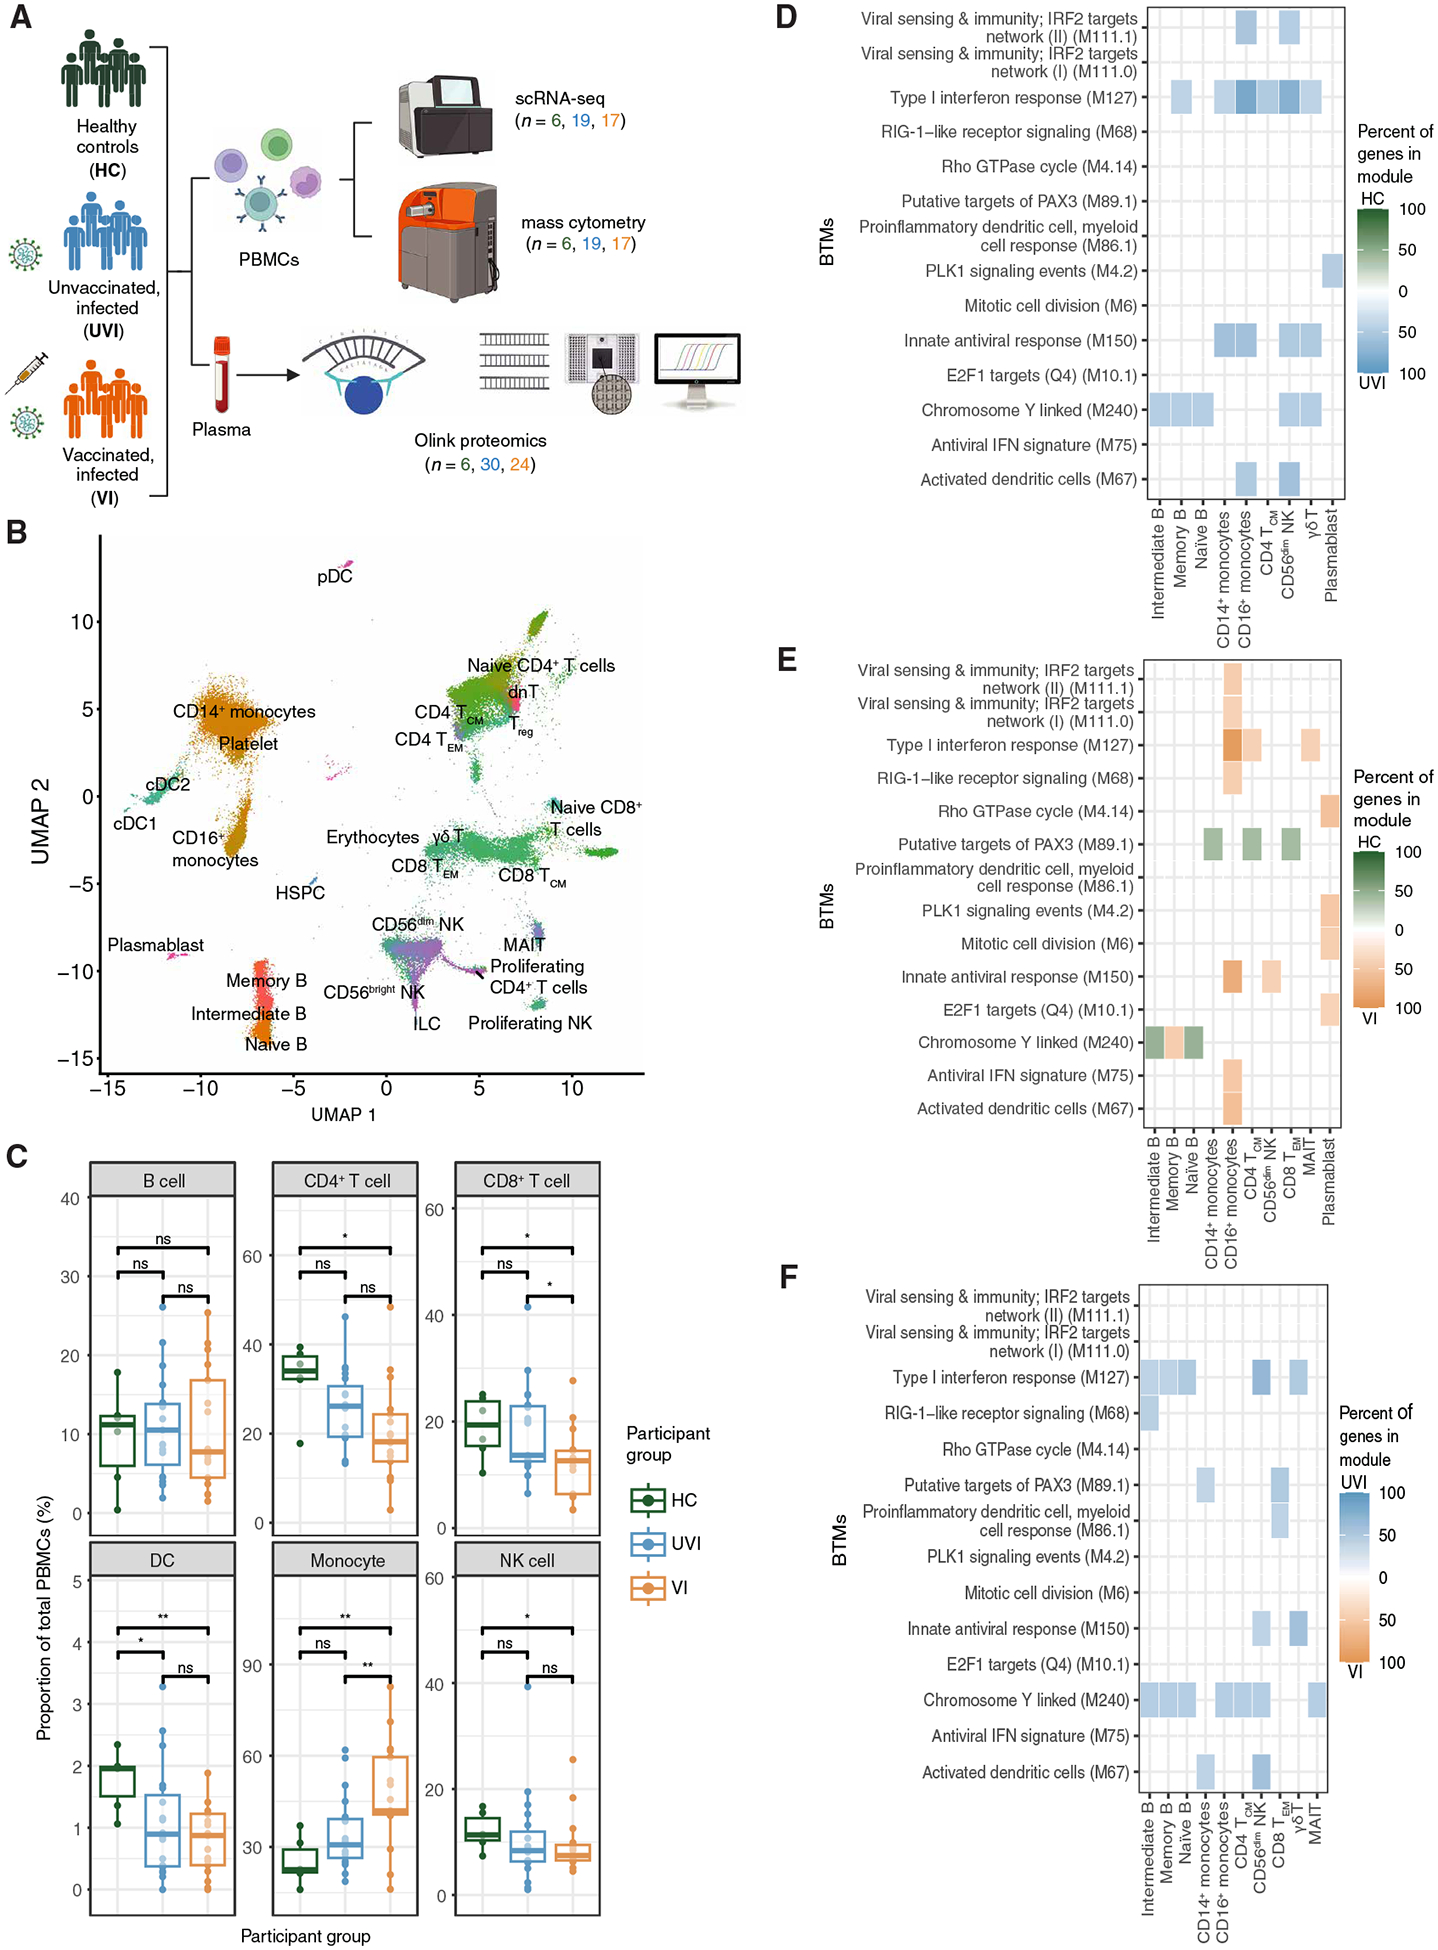
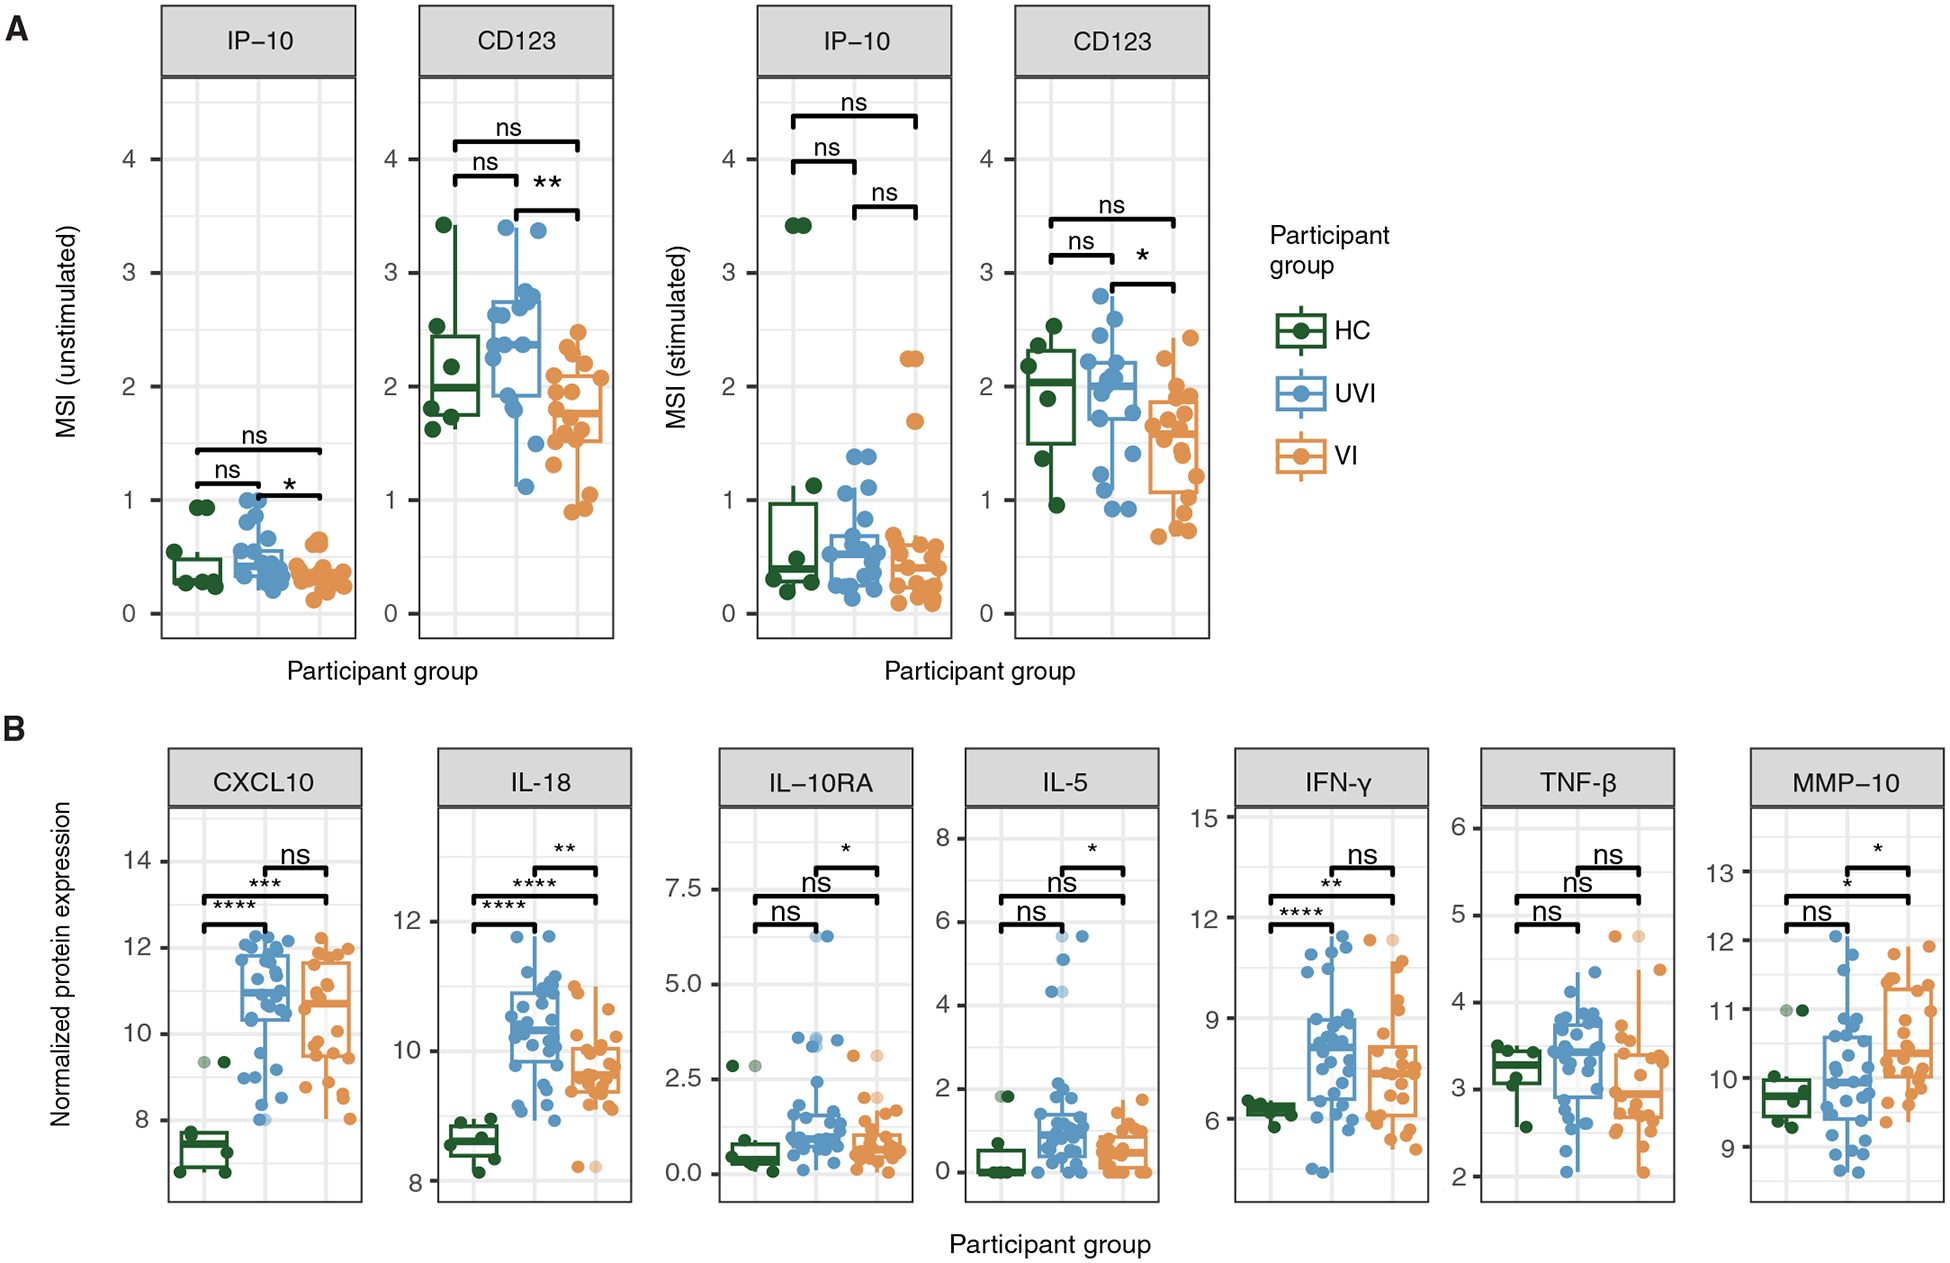
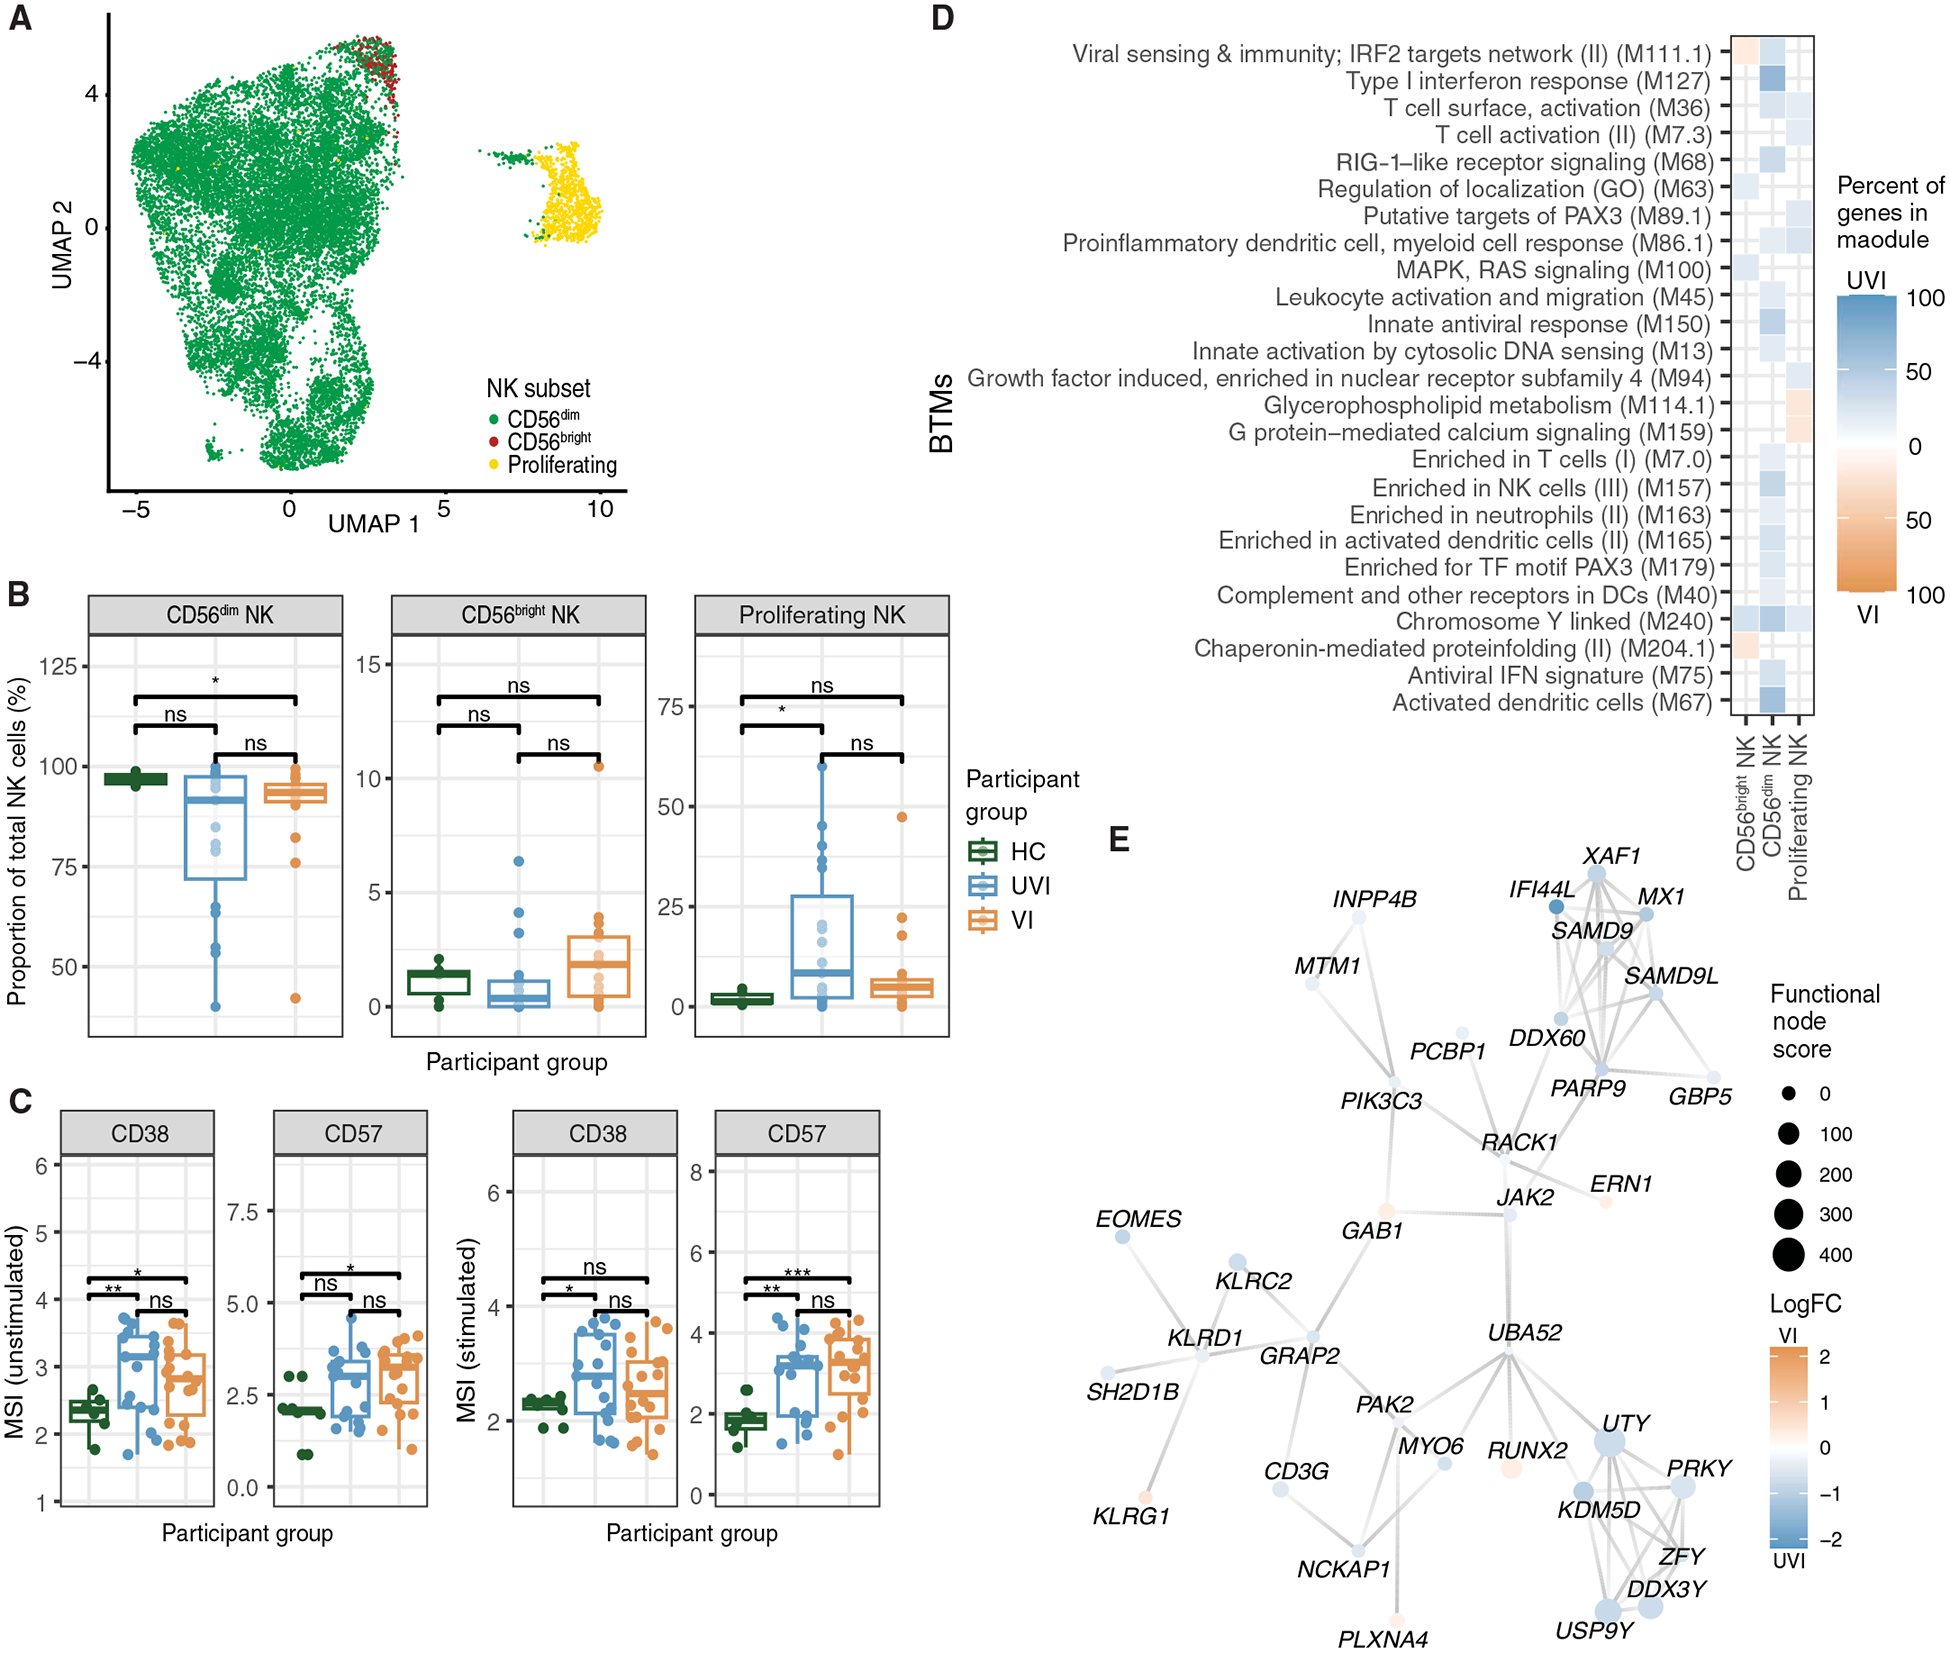
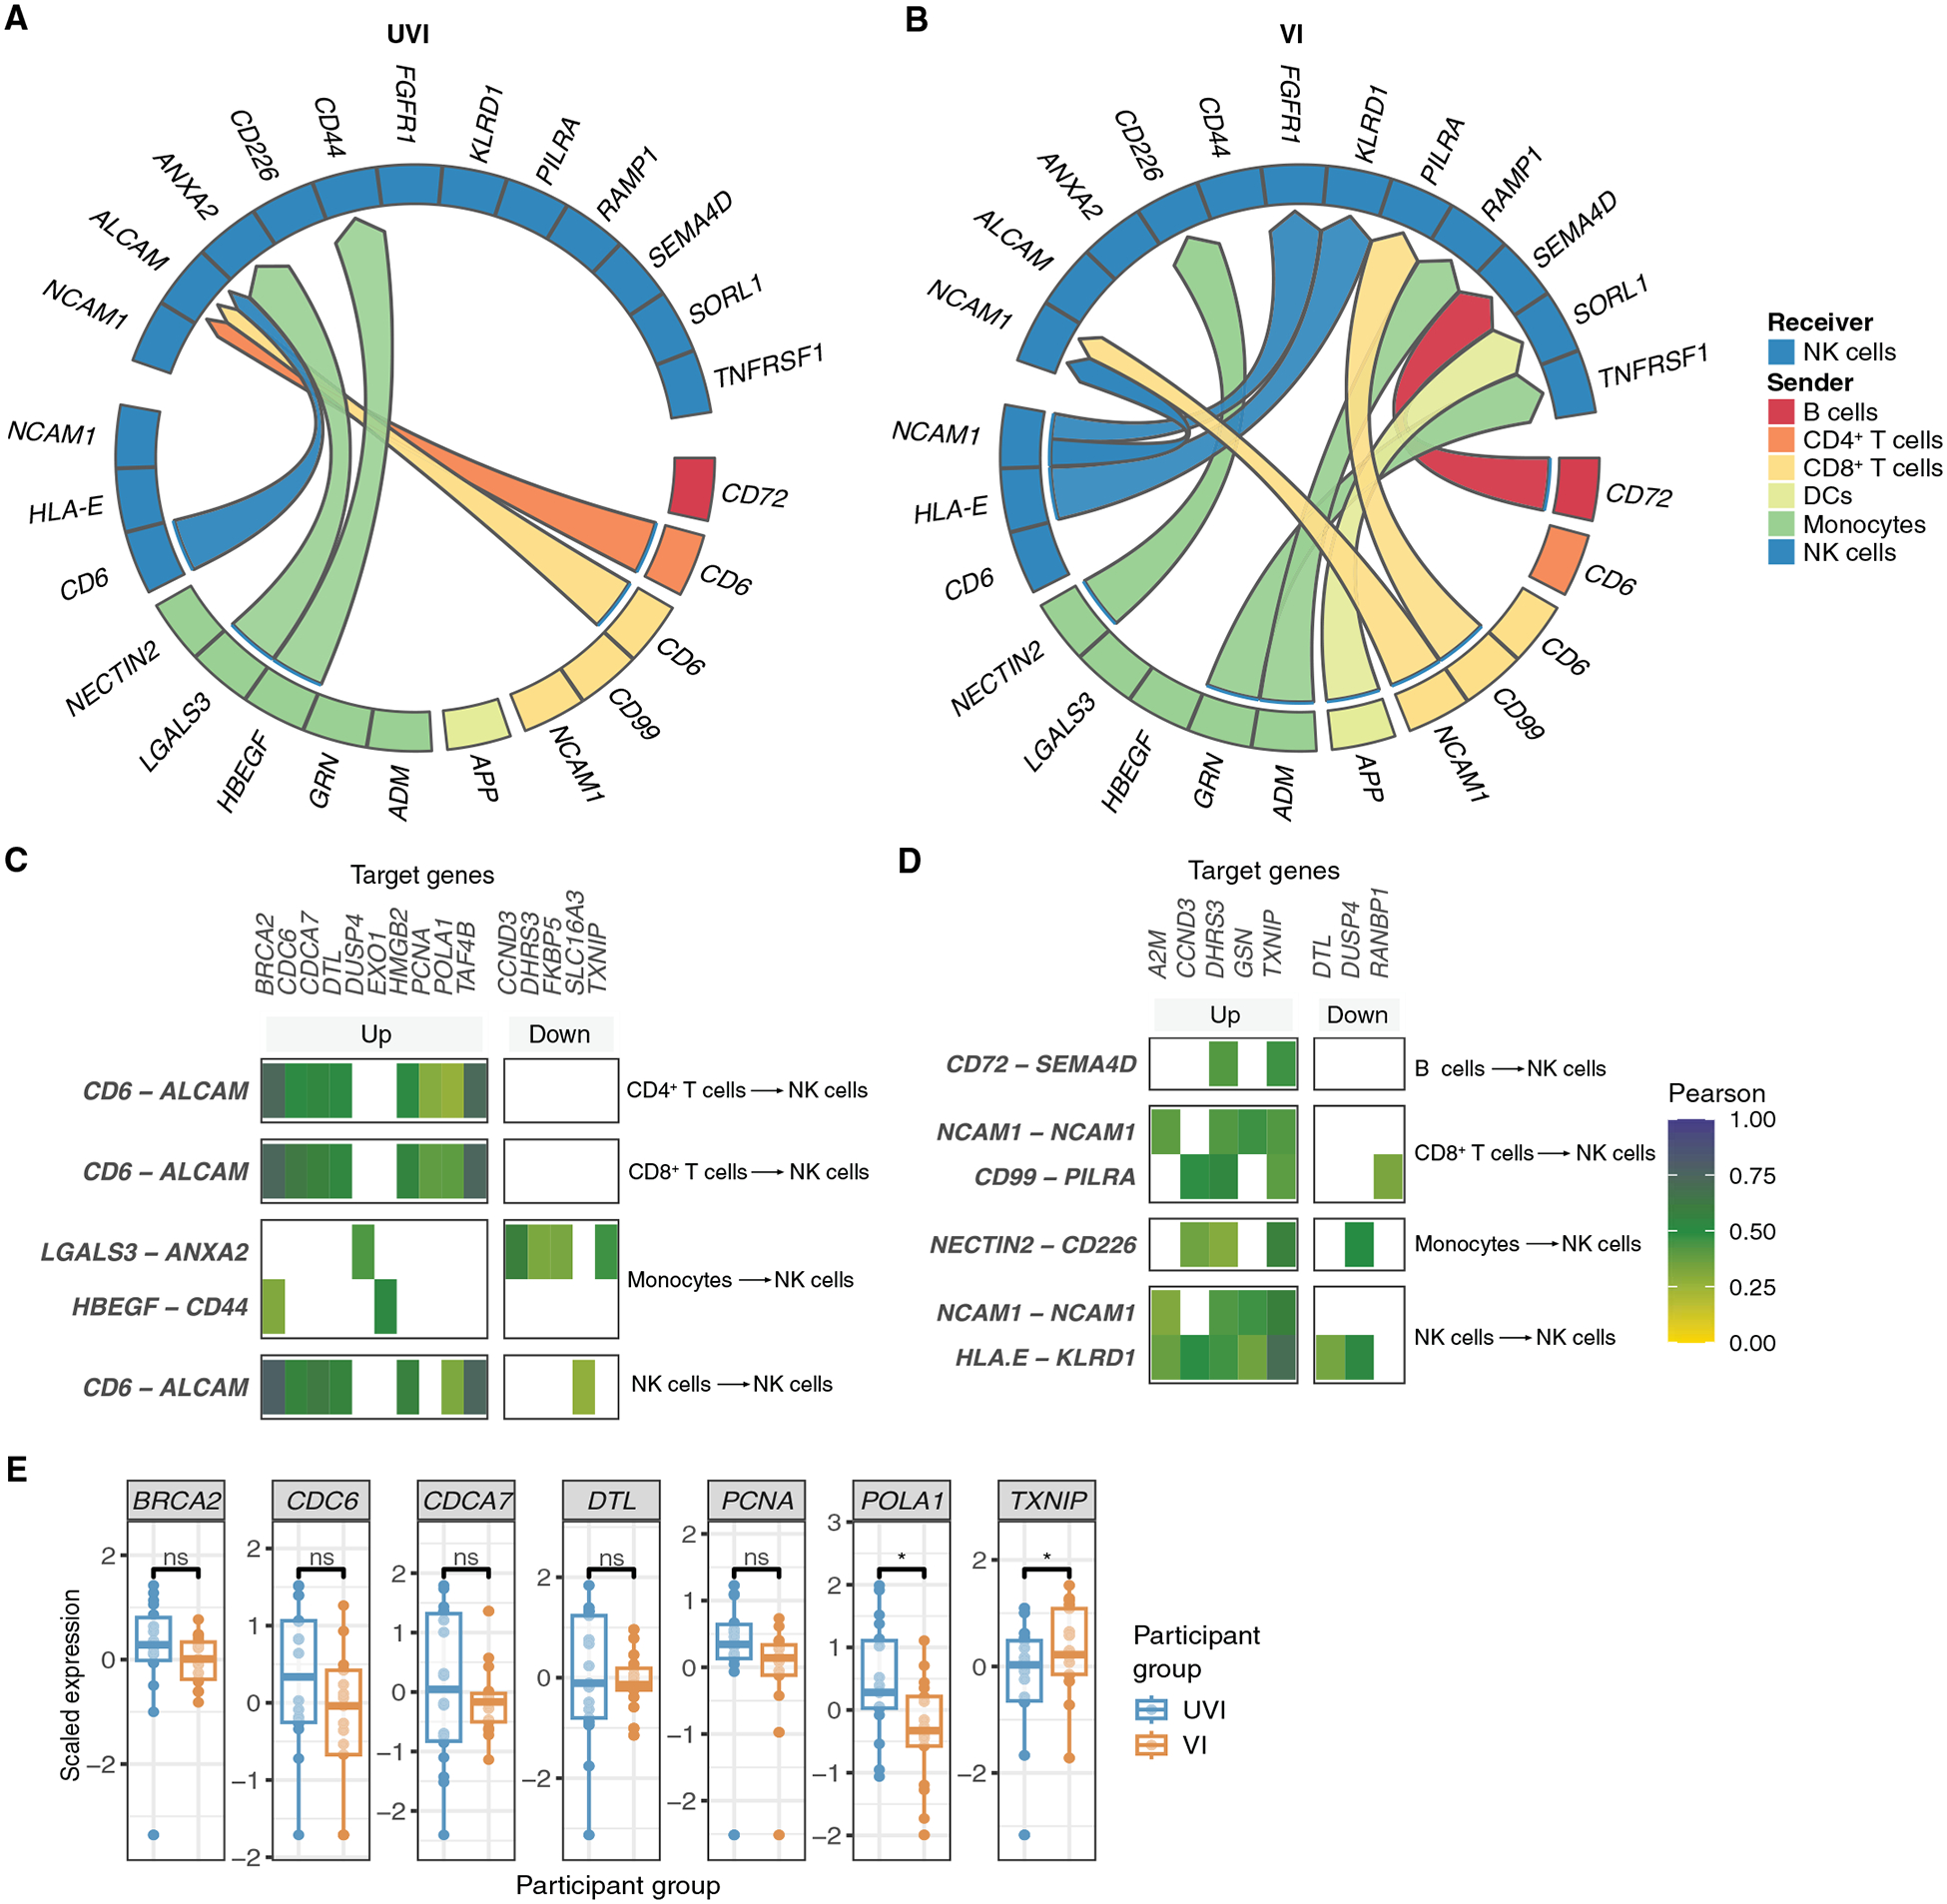
At this stage in the COVID-19 pandemic, most infections are "breakthrough" infections that occur in individuals with prior severe acute respiratory syndrome coronavirus 2 (SARS-CoV-2) exposure. To refine long-term vaccine strategies against emerging variants, we examined both innate and adaptive immunity in breakthrough infections. We performed single-cell transcriptomic, proteomic, and functional profiling of primary and breakthrough infections to compare immune responses from unvaccinated and vaccinated individuals during the SARS-CoV-2 Delta wave. Breakthrough infections were characterized by a less activated transcriptomic profile in monocytes and natural killer cells, with induction of pathways limiting monocyte migratory potential and natural killer cell proliferation. Furthermore, we observed a female-specific increase in transcriptomic and proteomic activation of multiple innate immune cell subsets during breakthrough infections. These insights suggest that prior SARS-CoV-2 vaccination prevents overactivation of innate immune responses during breakthrough infections with discernible sex-specific patterns and underscore the potential of harnessing vaccines in mitigating pathologic immune responses resulting from overactivation.


Conflict of interest statement

Competing interests: C.A.B. is a scientific advisory board member of ImmuneBridge, DeepCell Inc., and Qihan Bio on topics unrelated to this manuscript. B.P. served on the external immunology board of GSK and on the scientific advisory boards of Sanofi, Medicago, Boehringer Ingelheim, Pharmajet, Icosavax, and Ed-Jen. K.C.N. consults for Excellergy, Red Tree Ventures, Before Brands, Alladapt, Cour Pharma, Latitude, Regeneron, and IgGenix; is a cofounder of Before Brands, Alladpt, Latitude, and IgGenix; and is a national scientific committee member at Immune Tolerance Network (ITN) and NIH clinical research centers. All other authors declare that they have no competing interests.

Figures

Fig. 1.
Fig. 1.. Transcriptomic differences in innate and adaptive immunity are observed between primary and breakthrough infections.
(A) Pipeline of PBMC and plasma sample processing and number of participants analyzed per group. All subsequent figures use the same abbreviations and color scheme for participant groups. (B) Uniform manifold approximation and projection (UMAP) of scRNA-seq dataset annotated by mapping to PBMC populations in (35) and colored by cell type. (C) Proportion of cell types out of total PBMCs in each sample in scRNA-seq dataset (n = 6 HCs, n = 19 UVI participants, n = 17 VI participants). (D to F) Heatmap displaying the top 20 enriched BTMs in PBMC subsets identified by overrepresentation analysis. Percent of genes in module was calculated by determining the number of genes enriched in each participant group out of the total number of measured module genes for each pairwise comparison: HC versus UVI (D), HC versus VI (E), and UVI versus VI (F). BTMs with an adjusted P value < 0.05, with fewer than two genes, and that scored <10% for percent of genes in the module were removed from the plot. ns, not significant; *P ≤ 0.05 and **P ≤ 0.01 by t test with Benjamini-Hochberg’s correction for multiple hypothesis testing. pDC, plasmacytoid dendritic cell; dnT, double-negative T cell; ILC, innate lymphoid cell; MAIT, mucosal-associated invariant T cell; Treg, regulatory T cell; γδT, gamma delta T cell; IRF, interferon regulatory factor; RIG, retinoic acid–inducible gene; GTPase, guanosine triphosphatase; IFN, interferon; PLK1, Polo-like kinase 1.
Fig. 2.
Fig. 2.. Monocytes are transcriptionally more activated in breakthrough infections.
(A) UMAP projection of monocytes in the scRNA-seq dataset colored by monocyte subsets. (B) Heatmap of the top 40 enriched BTMs in monocyte subsets calculated as in Fig. 1F (n = 19 UVI participants and n = 17 VI participants). (C and D) Gene network display of differentially expressed genes in CD14+ monocytes (C) and CD16+ monocytes (D) was mapped to known protein-protein networks derived from the human STRING (Search Tool for the Retrieval of Interacting Genes/Proteins) database. Each gene is assigned a score derived from a β-uniform mixture model fitted to the P values generated from differential gene expression analysis. The highest scoring subgraph was generated with log fold change (logFC) relative to each participant group indicated by color scale (orange: up-regulated in samples from VI participants; blue: up-regulated in samples from UVI participants). MAPK, mitogen-activated protein kinase; MHC, major histocompatibility complex; TF, transcription factor; AP-1, activator protein 1.
Fig. 3.
Fig. 3.. Protein-level differences are observed in monocytes and plasma between primary and breakthrough infections.
(A) Box plots depicting the arcsinh-transformed mean signal intensity (MSI) of IP-10 and CD123 protein expression from the mass cytometry dataset (n = 6 HCs, n = 19 UVI participants, n = 17 VI participants). (B) Box plots depicting normalized expression of select plasma proteins from the Olink assay (n = 6 HCs, n = 30 UVI participants, n = 24 VI participants). *P ≤ 0.05, **P ≤ 0.01, ***P ≤ 0.001, and ****P ≤ 0.0001 by the Wilcoxon rank sum test with Benjamini-Hochberg’s correction for multiple hypothesis testing.
Fig. 4.
Fig. 4.. Differential cell-cell interactions suggest increased monocyte migration in primary infections and down-regulated migration in breakthrough infections.
(A and B) Circos plots of the top 15 predicted differential cell-cell communication received by monocytes from all annotated PBMC coarse cell types in UVI (n = 19) (A) and VI (n = 17) (B) participants. (C and D) Heatmaps depicting the top target genes correlated to the up-regulated cell-cell interactions received by monocytes in UVI (C) and VI (D) participants. Pearson correlation coefficients were calculated between the log-transformed normalized pseudobulk expression values of the genes encoding for each ligand-receptor pair of interest and the corresponding downstream target gene in the receiver cell type. (E) Box plots depicting scaled expression of cell-cell interactions’ target genes from scRNA-seq dataset. (F) Box plots depicting the arcsinh-transformed MSI of CCR4 protein expression in monocytes under both unstimulated and stimulated conditions from the mass cytometry dataset (n = 19 UVI participants and n = 17 VI participants). *P ≤ 0.05 and ****P ≤ 0.0001 by the Wilcoxon rank sum test with Benjamini-Hochberg’s correction for multiple hypothesis testing.
Fig. 5.
Fig. 5.. NK cells are transcriptionally more activated in breakthrough infections.
(A) UMAP projection of NK cells in the scRNA-seq dataset colored by NK cell subsets. (B) Proportion of NK cell subsets out of total NK cells in each sample in scRNA-seq dataset (n = 6 HCs, n = 19 UVI participants, n = 17 VI participants). (C) Box plots depicting the arcsinh-transformed MSI of protein expression in total NK cells (n = 6 HCs, n = 19 UVI participants, n = 17 VI participants). (D) Heatmap of the top 30 enriched BTMs in NK cell subsets identified as in Fig. 1F. (E) Network map of differentially expressed genes in CD56dim NK cells mapped to known protein-protein networks derived from the human STRING database as described in Fig. 2C (orange: up-regulated in samples from VI participants; blue: up-regulated in samples from UVI participants). *P ≤ 0.05, **P ≤ 0.01, and ***P ≤ 0.001 by the Wilcoxon rank sum test with Benjamini-Hochberg’s correction for multiple hypothesis testing. PAX3, paired box 3; RAS, rat sarcoma; GO, Gene Ontology.
Fig. 6.
Fig. 6.. Differential cell-cell interactions are predicted to enhance NK cell proliferation in primary infections and down-regulate proliferation in breakthrough infections.
(A and B) Circos plots of the top 15 predicted differential cell-cell communications received by NK cells from all annotated PBMC coarse cell types in UVI (n = 19) (A) and VI (n = 17) (B) participants. (C and D) Heatmap depicting the top target genes correlated to the up-regulated cell-cell interactions received by NK cells in UVI (C) and VI (D) participants. Pearson correlation coefficients were calculated between the log-transformed normalized pseudobulk expression values of the genes encoding for each ligand-receptor pair of interest and the corresponding downstream target gene in the receiver cell type. (E) Box plots depicting scaled expression of cell-cell interactions’ target genes. *P ≤ 0.05 by t test with Benjamini-Hochberg’s correction for multiple hypothesis testing.
Fig. 7.
Fig. 7.. Innate immune cells differentially regulate adaptive immune responses in breakthrough infections.
(A and B) Circos plot of the top 25 predicted differential cell-cell communications sent by DCs, monocytes, and NK cells to B cells, CD4+ T cells, and CD8+ T cells in UVI (n = 19) (A) and VI (n = 17) (B) participants. (C to H) Heatmaps depicting the top target genes correlated to the up-regulated cell-cell interactions received by B cells [(C) and (D)], CD4+ T cells [(E) and (F)], and CD8+ T cells [(G) and (H)] in UVI [(C), (E), and (G)] and VI [(D), (F), and (H)] participants. Pearson correlation coefficients were calculated between the log-transformed normalized pseudobulk expression values of the genes encoding for each ligand-receptor pair of interest and the corresponding downstream target gene in the receiver cell type.
Fig. 8.
Fig. 8.. Transcriptomic sex differences in innate immune cells are present between primary and breakthrough infections.
(A and B) Heatmaps of enriched BTMs in innate immune subsets as described in Fig. 1F in female (A) and male (B) infected UVI (n = 19) versus VI (n = 17) participants from the scRNA-seq dataset with the top 20 BTMs displayed. (C and D) Box plots depicting the arcsinh-transformed MSI of protein expression in NK cells from UVI (C) and VI (D) participants under unstimulated conditions from the mass cytometry dataset (n = 19 UVI participants and n = 17 VI participants). (E and F) Box plots depicting the normalized protein expression of plasma proteins in UVI (n = 30) (E) and VI (n = 24) (F) participants from the Olink dataset. *P ≤ 0.05 and **P ≤ 0.01 by t test with Benjamini-Hochberg’s correction for multiple hypothesis testing. ITK, IL2 inducible T cell kinase; RA, retinoic acid; PKC, protein kinase C; CSF, colony-stimulating factor.

References

    1. Al-Aly Z, Bowe B, Xie Y, Long COVID after breakthrough SARS-CoV-2 infection. Nat. Med 28, 1461–1467 (2022). - PMC - PubMed
    1. Fan Q, Shi J, Yang Y, Tang G, Jiang M, Li J, Tang J, Li L, Wen X, Zhang L, Deng X, Wang Y, Lan Y, Li L, Peng P, Tong Y, Lu H, Yan L, Liu Y, Cai S, Li Y, Mo X, Li M, Deng X, Hu Z, Yu H, Hu F, Liu J, Tang X, Li F, Clinical characteristics and immune profile alterations in vaccinated individuals with breakthrough Delta SARS-CoV-2 infections. Nat. Commun 13, 3979 (2022). - PMC - PubMed
    1. Collier A-RY, Brown CM, Mcmahan K, Yu J, Liu J, Jacob-Dolan C, Chandrashekar A, Tierney D, Ansel JL, Rowe M, Sellers D, Ahmad K, Aguayo R, Anioke T, Gardner S, Siamatu M, Bermudez Rivera L, Hacker MR, Madoff LC, Barouch DH, Immune responses in fully vaccinated individuals following breakthrough infection with the SARS-CoV-2 Delta variant in Provincetown, Massachusetts. medRxiv 21265113 [Preprint] (2021). 10.1101/2021.10.18.21265113. - DOI - PMC - PubMed
    1. Koutsakos M, Lee WS, Reynaldi A, Tan H-X, Gare G, Kinsella P, Liew KC, Taiaroa G, Williamson DA, Kent HE, Stadler E, Cromer D, Khoury DS, Wheatley AK, Juno JA, Davenport MP, Kent SJ, The magnitude and timing of recalled immunity after breakthrough infection is shaped by SARS-CoV-2 variants. Immunity 55, 1316–1326.e4 (2022). - PMC - PubMed
    1. Pušnik J, Monzon-Posadas WO, Zorn J, Peters K, Baum M, Proksch H, Schlüter CB, Alter G, Menting T, Streeck H, SARS-CoV-2 humoral and cellular immunity following different combinations of vaccination and breakthrough infection. Nat. Commun 14, 572 (2023). - PMC - PubMed

Substances

Supplementary concepts