Multicenter Study
. 2025 Mar;12(2):e200370.
doi: 10.1212/NXI.0000000000200370. Epub 2025 Jan 29.

Contribution of Blood Biomarkers to Multiple Sclerosis Diagnosis

Affiliations
Multicenter Study

Contribution of Blood Biomarkers to Multiple Sclerosis Diagnosis

Manuel Comabella et al. Neurol Neuroimmunol Neuroinflamm. 2025 Mar.

Abstract

Background and objectives: Invasive procedures may delay the diagnostic process in multiple sclerosis (MS). We investigated the added value of serum neurofilament light chain (sNfL), glial fibrillary acidic protein (sGFAP), chitinase-3-like 1 (sCHI3L1), and the immune responses to the Epstein-Barr virus-encoded nuclear antigen 1 to current MS diagnostic criteria.

Methods: In this multicentric study, we selected patients from 2 prospective cohorts presenting a clinically isolated syndrome (CIS). Patients were classified as (1) not presenting dissemination in space (DIS) nor dissemination in time (DIT) (noDIS and noDIT); (2) presenting DIS without DIT (DIS and noDIT); and (3) presenting both (DIS and DIT), which were used as a reference. sNfL, sGFAP, and sCHI3L1 levels were measured with single-molecule array immunoassays and EBNA1-specific IgG levels with ELISA. Biomarker levels were compared between groups using linear regression models. Receiver operating characteristic curve analyses and Youden Index were used to determine cutoff values associated with MS diagnosis during follow-up.

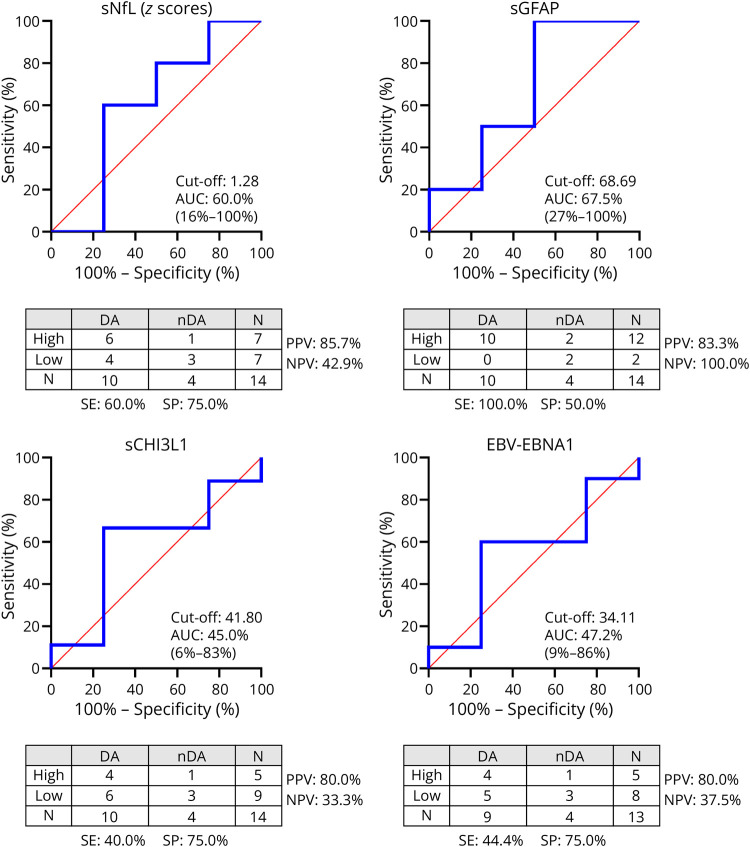
Results: We included 181 patients (66.3% females, mean [SD] age of 35.0 [9.7] years). At baseline, 25 (13.8%) were classified as noDIS and noDIT, 62 (34.3%) as DIS and noDIT, and 94 (51.9%) as DIS and DIT. Only sNfL Z-scores discriminated between groups (DIS and DIT vs DIS and noDIT [p = 0.002], DIS and DIT vs noDIS and noDIT [p < 0.001], and DIS and noDIT vs noDIS and noDIT [p = 0.026]). In noDIS and noDIT patients (median interquartile range [IQR] follow-up of 8.1 [5.0-11.7] years), high sNfL Z-scores best predicted MS diagnosis (specificity [SP] and 95% CI of 93.3% [68.1-99.8] and positive predictive value [PPV] of 87.5% [47.3-99.7]). Among DIS and noDIT patients (median [IQR] follow-up of 6.8 [4.0-9.1] years), high sNfL Z-scores best predicted MS diagnosis (SP of 80% [28.4-99.5] and PPV of 97.3% [85.8-99.9]) without considering oligoclonal band (OB) status. In the subset of patients of this group with negative OBs, a combination of high sNfL Z-scores and sGFAP levels predicted MS diagnosis (SP of 100% [39.8-100] and PPV of 100% [54.1-100]).

Discussion: These results suggest that sNfL and sGFAP may be incorporated in particular scenarios to diagnose MS in patients with CIS not fulfilling current diagnostic criteria.


Conflict of interest statement

The authors report no relevant disclosures. Go to Neurology.org/N for full disclosures.

Figures

Figure 1
Figure 1. Distribution of Serum Biomarker Levels in Patients With CIS Classified According to DIS and DIT
Boxplots showing serum levels of neurofilament light chain (sNfL) represented as Z-scores, levels of glial fibrillary acidic protein (sGFAP) in pg/mL, levels of chitinase 3-like 1 (sCHI3L1) in ng/mL, and IgG levels (U/mL) to Epstein-Barr virus–encoded nuclear antigen 1 (EBV-EBNA1) in patients not presenting dissemination in space nor dissemination in time (noDISnoDIT), patients presenting dissemination in space without dissemination in time (DISnoDIT), and patients presenting dissemination in space and dissemination in time (DISDIT). A y-axis segmentation was performed to represent better high and low sGFAP and sCHI3L1 levels. After adjusting for age: for sNfL Z-scores, p = 0.001 and p < 0.001 for DISDIT vs DISnoDIT and noDISnoDIT, respectively, and p = 0.030 for DISnoDIT vs noDISnoDIT; for EBV-EBNA1, p = 0.020 for DISDIT vs noDISnoDIT. Significant p values are shown in bold. CIS = clinically isolated syndrome; DIS = dissemination in space; DIT = dissemination in time.
Figure 2
Figure 2. Performance of Baseline Serum Biomarker Levels to Discriminate Between MS Converters and Nonconverters in CIS Patients With noDIS and noDIT
ROC curves of baseline serum biomarker levels show the area under the ROC curve (AUC) with 95% CIs, sensitivity (SE), specificity (SP), positive predictive value (PPV), and negative predictive value (NPV). (A) ROC curves for sNfL Z-scores in all patients and patients presenting with optic neuritis. (B) ROC curves for sGFAP, sCHI3L1, and EBV-EBNA1. CIS = clinically isolated syndrome; DA = disease activity; EBV-EBNA1 = Epstein-Barr virus–encoded nuclear antigen 1; MS = multiple sclerosis; nDA = no disease activity; sCHI3L1 = levels of chitinase 3-like 1; sGFAP = glial fibrillary acidic protein; sNfL = serum neurofilament light chain.
Figure 3
Figure 3. Performance of Baseline Serum Biomarker Levels to Discriminate Between MS Converters and Nonconverters in CIS Patients With DIS and noDIT Regardless of the Oligoclonal Band Status
ROC curves of baseline serum biomarker levels show the area under the ROC curve (AUC) with 95% CIs, sensitivity (SE), specificity (SP), positive predictive value (PPV), and negative predictive value (NPV). CIS = clinically isolated syndrome; DA = disease activity; DIS = dissemination in space; MS = multiple sclerosis; nDA = no disease activity.
Figure 4
Figure 4. Performance of Baseline Serum Biomarker Levels to Discriminate Between MS Converters and Nonconverters in CIS Patients With DIS and noDIT With Negative Oligoclonal Bands
ROC curves of baseline serum biomarker levels show the area under the ROC curve (AUC) with 95% CIs, sensitivity (SE), specificity (SP), positive predictive value (PPV), and negative predictive value (NPV). CIS = clinically isolated syndrome; DA = disease activity; DIS = dissemination in space; DIT = dissemination in time; MS = multiple sclerosis; nDA = no disease activity.

References

    1. Compston A, Coles A. Multiple sclerosis. Lancet. 2008;372(9648):1502-1517. doi:10.1016/S0140-6736(08)61620-7 - DOI - PubMed
    1. Iaffaldano P, Lucisano G, Butzkueven H, et al. . Early treatment delays long-term disability accrual in RRMS: results from the BMSD network. Mult Scler. 2021;27(10):1543-1555. doi:10.1177/13524585211010128 - DOI - PubMed
    1. Brown JWL, Coles A, Horakova D, et al. . Association of initial disease-modifying therapy with later conversion to secondary progressive multiple sclerosis. JAMA. 2019;321(2):175-187. doi:10.1001/jama.2018.20588 - DOI - PMC - PubMed
    1. Kalincik T, Diouf I, Sharmin S, et al. . Effect of disease-modifying therapy on disability in relapsing-remitting multiple sclerosis over 15 years. Neurology. 2021;96(5):e783-e797. doi:10.1212/WNL.0000000000011242 - DOI - PMC - PubMed
    1. McDonald WI, Compston A, Edan G, et al. . Recommended diagnostic criteria for multiple sclerosis: guidelines from the International Panel on the diagnosis of multiple sclerosis. Ann Neurol. 2001;50(1):121-127. doi:10.1002/ana.1032 - DOI - PubMed

Publication types