. 2025 Mar:80:103499.
doi: 10.1016/j.redox.2025.103499. Epub 2025 Jan 22.

Caffeine ameliorates metabolic-associated steatohepatitis by rescuing hepatic Dusp9

Affiliations

Caffeine ameliorates metabolic-associated steatohepatitis by rescuing hepatic Dusp9

Xin Xin et al. Redox Biol. 2025 Mar.

Abstract

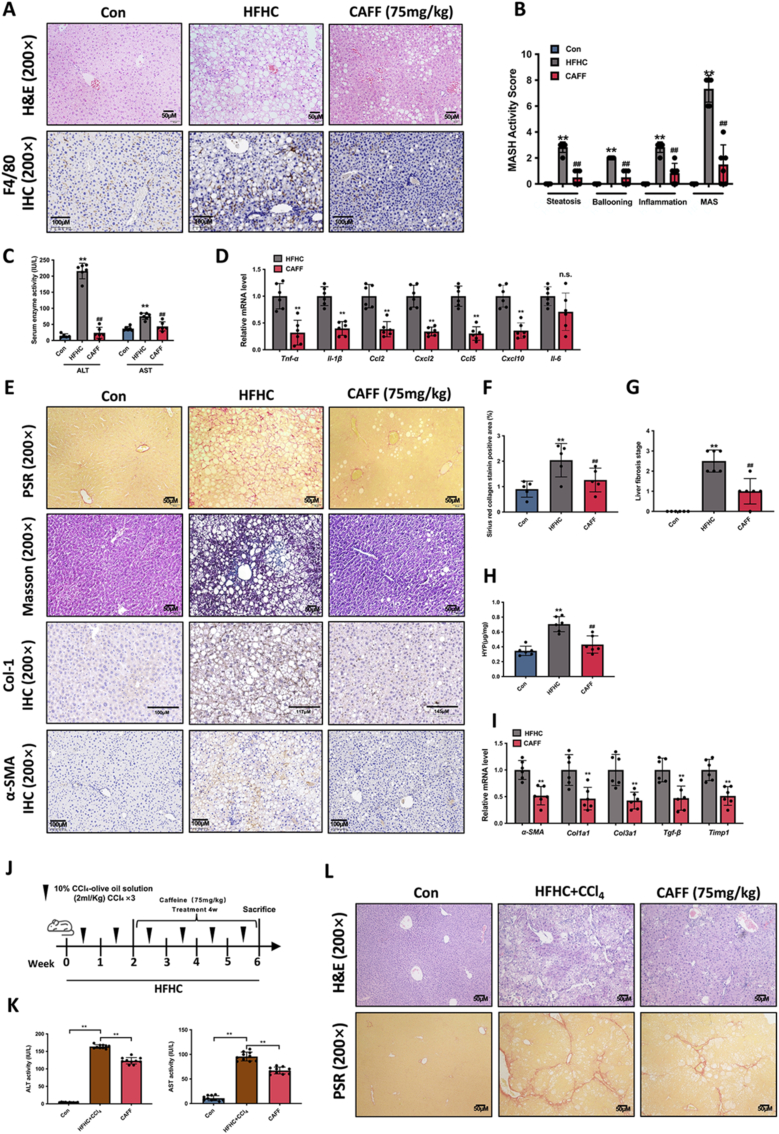
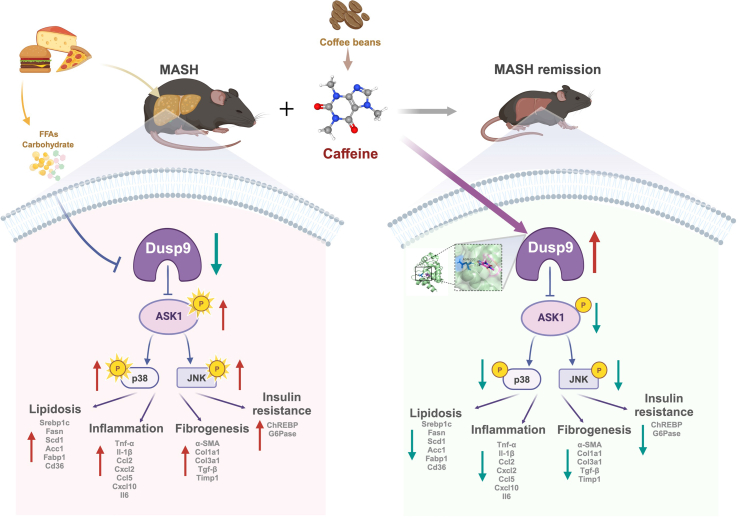
Caffeine (CAFF) is abundant in black coffee. As one of the most widely consumed beverages globally, coffee has been the focus of increasing clinical and basic research, particularly regarding its benefits in alleviating metabolic dysfunction-associated steatotic liver disease (MASLD). However, the therapeutic effects of CAFF on metabolic-associated steatohepatitis (MASH) and the underlying mechanisms remain unclear. In this study, we demonstrated that CAFF potently reduced hepatic steatosis, inflammation, and early-stage liver fibrosis in MASH mice induced by prolonged (36 weeks) high-fat high-carbohydrate (HFHC) diets and high-fat diets combined with carbon tetrachloride (CCl4) injections. By using multiple target-identifying strategies, including surface plasmon resonance (SPR), cellular thermal shift assay (CETSA), and drug affinity responsive target stability (DARTS) assay, we identified dual-specificity phosphatase 9 (Dusp9) as a key therapeutic target, which was diminished by HFHC but restored with CAFF treatment. Dusp9 knockdown in vivo and in vitro exacerbated glycolipid metabolism disorders and stunningly counteracted the systemic therapeutic effects of CAFF in the MASH models. In addition, CAFF inactivated the ASK1-p38/JNK, a downstream signaling pathway of Dusp9, which regulates inflammation and apoptosis. Our study highlights the multifaceted benefits of CAFF in treating MASH by rescuing hepatic Dusp9 expression, thereby reversing glycolipid metabolism disorders, liver inflammation, and fibrosis. These findings provide experimental evidence supporting the clinical and daily use of CAFF and black coffee in managing MASH patients.

Keywords: Black coffee; Caffeine (CAFF); Dual-specificity phosphatase 9 (Dusp9); Liver fibrosis; Metabolic dysfunction-associated steatotic liver disease (MASLD).


Conflict of interest statement

Declaration of competing interest The authors disclose no conflicts of interest.

Figures

Image 1
Graphical abstract
Fig. 1
Fig. 1
Caffeine administration ameliorates liver steatosis in HFHC-fed MASH mice. (A) Experimental design illustrating the experimental flow. Mice were fed a normal diet (control, Con) or HFHC diet for 36 weeks to induce MASH, with or without caffeine administration by oral gavage in the last 6 weeks (n = 6). (B) Representative images showed gross body, liver morphology, and Oil Red O staining of mouse livers. (C, D) Body weight and liver weight. (E) Hepatic TG contents (mg/g). (F) Quantification of Oil red O staining. (G, H) Levels of serum TG, TC, HDL, and LDL indexes. (I, J) Fasting plasma glucose, fasting insulin, and insulin resistance index, HOMA-IR (homeostasis model assessment). (K) Quantitative PCR was performed to determine the hepatic mRNA levels of genes related to lipid metabolism (Srebp1c, Fasn, Scd1, Acc1, Cpt1a, Fabp1, and Cd36). (L) Quantitative PCR was performed to determine the hepatic mRNA levels of genes related to glucose metabolism (Irs, ChREBP, and G6Pase). (M) Flow chart of the cell culture experimental design. THLE-2 cells were stimulated with FFAs and co-treated with caffeine (0.25, 0.5, and 1 mM) for 24 h. The experiment was repeated three times. (N) Representative images showing Oil red O staining and semi-quantitative assessment of Oil red O content. Scale bar, 20 μm (n = 3 independent experiments per group) (O) Levels of intracellular TG. (The data were obtained from three independent experiments per group) (P) Quantitative PCR was performed to determine the THLE-2 cells mRNA levels of genes related to lipid metabolism (Srebp1c, Fasn, Scd1, Acc1, Cpt1a, Fabp1, and Cd36). Data are presented as the mean ± SD. Significant differences between the Con group and the HFHC group, ∗p < 0.05, ∗∗p < 0.01; the significant difference between the HFHC group and the caffeine group, #p < 0.05, ##p < 0.01. The data were analyzed with a two-sided Student's t-test or one-way ANOVA.
Fig. 2
Fig. 2
Caffeine administration mitigates liver inflammation and fibrosis in MASH mice. (A) Representative images showed liver tissue H&E staining and F4/80 IHC staining (200 × magnification). (B) Hepatic ballooning, steatosis, lobular inflammation, and MASH score (MASH activity score). (C) Serum ALT and AST activities. (D) Quantitative PCR was performed to determine the hepatic mRNA levels of inflammation-related genes (Tnf-α, Il-1β, Ccl2, Cxcl2, Ccl5, Cxcl10, and Il-6). (E) Representative images of PSR, Masson, Col-1 IHC, and α-SMA IHC stained liver sections, PSR quantification is provided in (F). (G) Liver fibrosis stage in mice from each group according to PSR staining. (H) Hydroxyproline content of liver tissue in each group. (I) Quantitative PCR was performed to determine the hepatic mRNA levels of genes related to fibrosis (α-SMA, Cola1, Cola3, Tgf-β, and Timp1) from the indicated groups. (J) Working flow of liver fibrosis mice model. Mice were fed with a control diet (Con) or high-fat diet (HFHC) for 6 weeks, HFHC mice were consistently intraperitoneally injected with CCl4, 3 times per week. In the last 4 weeks, half of the HFHC mice were treated with CAFF. (K) Serum ALD and AST activities. (L) Representative Liver H&E staining, and PSR staining in three indicated groups. Data are presented as the mean ± SD. The significant difference between the Con group and the HFHC group, n = 6, ∗p < 0.05, ∗∗p < 0.01; significant differences between the HFHC group and the caffeine group, #p < 0.05, ##p < 0.01. The data were analyzed with a two-sided Student's t-test or one-way ANOVA.
Fig. 3
Fig. 3
Screening, prediction, and validation of caffeine directly targets Dusp9. (A) Workflow for identifying potential drug targets of caffeine. (B) Molecular docking of caffeine with the protein Dusp9. (C, D) The affinity of CAFF for Dusp9 was determined by using SPR. (E) Representative immunoblots from (Cellular Thermal Shift Assay) CETSA experiments in THLE-2 cells (42/48/53/58/63 °C). (F) Melt curves of Dusp9 in THLE-2 cells after caffeine or DMSO treatment by CETSA. (G) Drug affinity responsive target stability (DARTS) assay was performed to test the direct binding of Caffeine to Dusp9. (H) Fold change of Dusp9 in THLE-2 cells after caffeine (0.25/0.5/1 mM) or DMSO treatment by DARTS. (I) Expression levels of hepatic Dusp9 protein were examined with Western blot in HFHC MASH mice. (J) Western blot data of relative expression of Dusp9 protein in HFHC MASH mice. GAPDH served as a loading control. (n = 3 per group). (M) Immunohistochemical detection of Dusp9 (brown/tan) and nuclei (blue) in liver tissue from HFHC-fed MASH mice. (K) Western blot data of relative expression of Dusp9 protein in FFA-induced THLE-2 cells. (L) Relative levels of Dusp9 were analyzed in THLE-2 cells. Experiments were performed three times independently, and values represent means ± SD.∗, compared with Con p < 0.05; ∗∗, compared with Con p < 0.01; #, compared with HFHC p < 0.05; ##, compared with HFHC p < 0.01. The data were analyzed with a two-sided Student's t-test or one-way ANOVA.
Fig. 4
Fig. 4
Caffeine treatment inhibits MAPK signaling in vivo and in vitro MASH models. (A) Dusp9 downstream signaling kinases including hepatic p-ASK1, ASK1, p-p38, p38, p-JNK, and JNK, were detected with Western blot in MASH mice. (B) Schematic illustrating CAFF rescues the expression of Dusp9 attenuated by the HFHC diet and further blocks the phosphorylation of MAPK signaling. (C) Relative levels of p-ASK1, p-p38, and p-JNK were analyzed. (D) MAPK signaling molecules including p-ASK1, ASK1, p-p38, p38, p-JNK, and JNK were tested with Western blot in FFA-induced THLE-2 cells. (E) Relative levels of p-ASK1, p-p38, and p-JNK were analyzed in THLE-2 cells. Experiments were performed three times independently, and values represent means ± SD.∗, compared with Con p < 0.05; ∗∗, compared with Con p < 0.01; #, compared with HFHC p < 0.05; ##, compared with HFHC p < 0.01. The data were analyzed with a two-sided Student's t-test or one-way ANOVA.
Fig. 5
Fig. 5
Liver-specific Dusp9 knockdown exacerbates glycolipid metabolism and abolishes caffeine-mediated multiple amelioration in MASH mice. (A) The flow chart shows administration modeling, tail vein injection of AAV, administration, and sacrifice time point (n = 8, per group). (B–C) Body weight and liver weight. (D) Representative images showed Oil red O, H&E, and PSR staining from indicated groups; PSR quantification is analyzed in (M). (E) Hepatic TG contents (mg/g) in each group. (F–H) Fasting plasma glucose, fasting insulin, and insulin resistance index (HOMA-IR) in each group. (I–J) Serum ALT and AST activities. (K) Hepatic MASH score (MASH activity score) in each group. (L) Hydroxyproline content of liver tissue in each group (n = 8, per group). Values represent means ± SD.∗p < 0.05; ∗∗p < 0.01; n. s. = no significance. The data were analyzed with a two-sided Student's t-test or one-way ANOVA.
Fig. 6
Fig. 6
Dusp9 knockdown activates MAPK signaling, exacerbates liver inflammation and fibrosis, and diminishes the protective effects of caffeine in MASH mice. (A) Expression levels of hepatic Dusp9, p-ASK1, ASK1, p-p38, p38, p-JNK, and JNK protein were examined with Western blot in HFHC NASH mice. (B) Western blot data of relative expression of Dusp9, p-ASK1, p-p38, and p-JNK protein in HFHC NASH mice. (C) Immunohistochemical detection of Dusp9, α-SMA, and F4/80 (brown/tan) and nuclei (blue) in liver tissue from HFHC-fed NASH mice. (D) Quantitative PCR analysis of hepatic mRNA levels of genes related to lipid metabolism (Srebp1c, Fasn, Scd1, Acc1, and Cpt1a) in the indicated groups. (E) Quantitative PCR analysis of hepatic mRNA levels of genes related to inflammation (Tnf-α, Il-1β, Ccl2, Cxcl2, and Ccl5) in the indicated groups. (F) Quantitative PCR was performed to determine the hepatic mRNA levels of genes related to fibrosis (α-SMA, Col1a1, Col3a1, and Tgf-β) in the indicated groups. Experiments were performed three times independently, and values represent means ± SD.∗, compared with Con p < 0.05; ∗∗, compared with Con p < 0.01; #, compared with HFHC p < 0.05; ##, compared with HFHC p < 0.01. The data were analyzed with a two-sided Student's t-test or one-way ANOVA.
Fig. 7
Fig. 7
Dusp9 silencing impairs the effects of caffeine on lipid accumulation, inflammation, and MAPK signaling in FFA-induced THLE-2 cells. (A) Flow chart illustrating the experimental design for Dusp9 silencing by lentiviral transfection, followed by FFAs and CAFF incubation. The experiment was repeated three times. (B, C) Representative pictures showed Oil red O staining and semi-quantitative assessment of Oil red O content. Scale bar, 20 μm (n = 3 independent experiments per group). (D) Levels of TGs in THLE-2 cells in the indicated groups. (E) Dusp9 downstream signaling molecules including p-ASK1, ASK1, p-p38, p38, p-JNK, and JNK were tested with Western blot in FFA-induced THLE-2 cells. Relative levels of p-ASK1, p-p38, and p-JNK were analyzed in THLE-2 cells. (F) Quantitative PCR was performed to determine the hepatic mRNA levels of genes related to lipid metabolism (Srebp1, Fasn, Scd1, and Acc1) in the indicated groups. (G) Quantitative PCR was performed to determine the hepatic mRNA levels of genes related to inflammation (Tnf-α, Il-1β, Ccl2, and Cxcl2) in the indicated groups. Experiments were performed three times independently, and values represent means ± SD.∗, compared with Con p < 0.05; ∗∗, compared with Con p < 0.01; #, compared with HFHC p < 0.05; ##, compared with HFHC p < 0.01. The data were analyzed with a two-sided Student's t-test or one-way ANOVA.
Fig. 8
Fig. 8
A schematic overview depicting the ameliorative effects of caffeine on MASH through rescuing impaired Dusp9 and inactivating MAPK pathway. Caffeine (CAFF) is Caffeine (CAFF), the most abundant natural component in coffee beans, ameliorates metabolic-associated steatohepatitis (MASH) by enhancing glycolipid metabolism, reducing inflammation, and reversing liver fibrosis. Impairment of Dusp9 due to long-term HFHC diet feeding leads to the phosphorylation and activation of the MAPK pathway, which drives the progression of MASH. However, CAFF administration rescues the impaired Dusp9 and inhibits its downstream signaling activation, representing a critical mechanism and therapeutic target for improving MASH.

References

    1. Lazarus J.V., et al. Advancing the global public health agenda for NAFLD: a consensus statement. Nat. Rev. Gastroenterol. Hepatol. 2022;19(1):60–78. - PubMed
    1. Younossi Z.M., et al. The global epidemiology of nonalcoholic fatty liver disease (NAFLD) and nonalcoholic steatohepatitis (NASH): a systematic review. Hepatology. 2023;77(4):1335–1347. - PMC - PubMed
    1. Yip T.C., et al. Asian perspective on NAFLD-associated HCC. J. Hepatol. 2022;76(3):726–734. - PubMed
    1. Targher G., et al. The complex link between NAFLD and type 2 diabetes mellitus - mechanisms and treatments. Nat. Rev. Gastroenterol. Hepatol. 2021;18(9):599–612. - PubMed
    1. En Li Cho E., et al. Global prevalence of non-alcoholic fatty liver disease in type 2 diabetes mellitus: an updated systematic review and meta-analysis. Gut. 2023;72(11):2138–2148. - PubMed