. 2025 Feb 18;6(2):101928.
doi: 10.1016/j.xcrm.2025.101928. Epub 2025 Jan 28.

Targeting pancreatic cancer glutamine dependency confers vulnerability to GPX4-dependent ferroptosis

Affiliations

Targeting pancreatic cancer glutamine dependency confers vulnerability to GPX4-dependent ferroptosis

Xuqing Shen et al. Cell Rep Med. .

Abstract

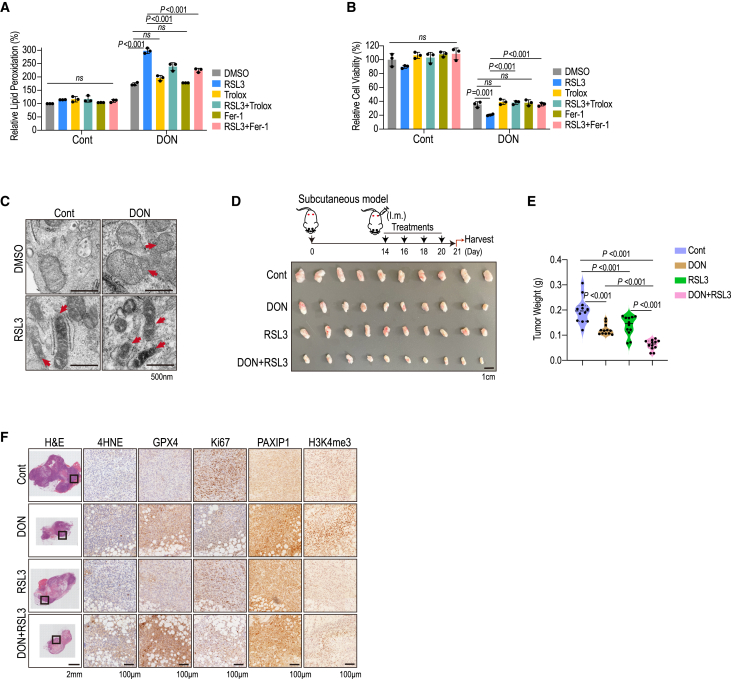
Pancreatic ductal adenocarcinoma (PDAC) relies heavily on glutamine (Gln) utilization to meet its metabolic and biosynthetic needs. How epigenetic regulators contribute to the metabolic flexibility and PDAC's response and adaptation to Gln scarcity in the tumor milieu remains largely unknown. Here, we elucidate that prolonged Gln restriction or treatment with the Gln antagonist, 6-diazo-5-oxo-L-norleucine (DON), leads to growth inhibition and ferroptosis program activation in PDAC. A CRISPR-Cas9 screen identifies an epigenetic regulator, Paxip1, which promotes H3K4me3 upregulation and Hmox1 transcription upon DON treatment. Additionally, ferroptosis-related repressors (e.g., Slc7a11 and Gpx4) are increased as an adaptive response, thereby predisposing PDAC cells to ferroptosis upon Gln deprivation. Moreover, DON sensitizes PDAC cells to GPX4 inhibitor-induced ferroptosis, both in vitro and in patient-derived xenografts (PDXs). Taken together, our findings reveal that targeting Gln dependency confers susceptibility to GPX4-dependent ferroptosis via epigenetic remodeling and provides a combination strategy for PDAC therapy.

Keywords: PDAC; combination therapy; epigenetic remodeling; ferroptosis; pancreatic ductal adenocarcinoma; prolonged glutamine starvation.


Conflict of interest statement

Declaration of interests The authors declare no competing interests.

Figures

None
Graphical abstract
Figure 1
Figure 1
Prolonged glutamine restriction triggers lipid peroxidation and ferroptosis (A) KPC1199 cell numbers cultured in gradient concentrations of glutamine (2, 0.8, or 0.4 mmol/L) and glucose (2.25, 0.9, or 0.45 g/L) for indicated days. Right, relative cell numbers compared to the complete media (Cont, 2 mmol/L glutamine and 2.25 g/L glucose) at the third day. Cell numbers were made Log10 transformation. (B) Upper, heatmap of increased and decreased differentially accessible regions (DARs) in ATAC-seq (Low Gln versus Cont). Lower, enrichment feature distributions of increased and decreased DARs were shown. Low Gln, 0.4 mmol/L glutamine and 2.25 g/L glucose. (C and D) Integrated analysis of differentially expressed genes (DEGs) from RNA-seq and genes with DARs at promoters from ATAC-seq, termed as open DEGs (C) and close DEGs (D). Lower, KEGG enrichment analyses of the 1,037 open DEGs or 253 close DEGs were shown. (E) Heatmap and genes depicted the expression levels of ferroptosis-related genes (FRGs) from open and close DEGs. (F and G) Relative lipid peroxidation (F) and malondialdehyde (MDA) (G) of KPC1199 cells. Cells were cultured in low glutamine (Low Gln) or control medium (Cont) for indicated time, stained with C11-BODIPY, and analyzed by flow cytometry. (H and I) Lipid peroxidation (H) and cell viability (I) of KPC1199 cells were measured after exposure to gradient concentrations of 6-diazo-5-oxo-l-norleucine (DON) for 72 hours. (J–L) Lipid peroxidation (J), MDA (K), and cell viability (L) of KPC1199 cells were assessed with DON treatment (1 μM) for 24, 48, or 72 h. Data represent mean ± SEM (A), or mean ± SD (F–L) with n = 3 biological replicates. p values were determined using one-way ANOVA with Tukey’s multiple comparison test (A, H, and I) or unpaired Student’s t test (F, G, and J–L).
Figure 2
Figure 2
Upregulation of H3K4me3 is essential for cellular response and adaptation to prolonged glutamine restriction (A) Levels of indicated histone modifications were determined by using western blotting in Low Gln and Cont groups. (B) Levels of SAM (S-adenosylhomocysteine) and acetyl-CoA were determined in Low Gln and Cont groups. (C) Heatmap of CUT&Tag-seq signals of H3K4me3, H3K27Ac, H3K27me3, and H2AK119ub from 3-kb upstream and downstream of transcription start site (TSS) and H3K36me3 from 3-kb upstream of TSS to 3 kb downstream of transcription end site (TES) in Low Gln and Cont groups. (D) Heatmap illustrated the correlation between transcriptional levels and indicated histone modification levels (Low Gln versus Cont). (E) Boxplots showed alternations of indicated histone modification depositions for open DEGs (n = 1,037 in Figure 1C) and all genes. (F) Integrated analysis of open DEGs and genes with increased H3K4me3 at promoter (n = 4,017, CUT&Tag-seq, FC_RPKM ≥ 1.5). Right, the KEGG enrichment analysis of the 163 H3K4me3-related open DEGs. (G) Heatmap illustrated mRNA levels and H3K4me3 depositions at the promoters of indicated genes in Low Gln and Cont groups. Transcripts per kilobase of exon model per million mapped reads (TPMs) were shown. (H) Representative Integrative Genomics Viewer (IGV) screenshot of ATAC-seq signals, H3K4me3 signals (CUT&Tag-seq), and Fosl1/Junb signals (ChIP-seq, GSE134233) of indicated genes. (I) Top 5 known motifs at H3K4me3-gain zones of 163 overlapping genes. (J and K) KPC1199 cells were treated with DON (1 μM), DON and MM-102 (25 μM), or DMSO as control for 72 h. (J) The mRNA levels of Hmox1, Steap3, Atg7, Slc7a11, and Gpx4 were determined by RT-qPCR. (K) Western blot analysis of Hmox1, Slc7a11, Gpx4, Atg7, β-Actin, H3K4me3, and Histone H3 in the indicated groups. Data represent mean ± SEM (B), mean with range (E), or mean ± SD (J) with n = 3 biological replicates. p values were determined using unpaired Student’s t test (B and E) or one-way ANOVA with Tukey’s multiple comparison test (J).
Figure 3
Figure 3
CRISPR-Cas9 screening reveals that PAXIP1 mediates increased H3K4 trimethylation under glutamine restriction (A) Schematic diagram of the experimental design for the epigenome-wide CRISPR-Cas9 screen. (B) Bubble-rank plot illustrated genes whose knockout significantly enhanced (positive, red) or reduced (negative, blue) the relative cell viability under low-glutamine treatment (Low Gln) compared to the control (Cont). (C) Western blot analysis of Paxip1, β-Actin, H3K4me3, and Histone H3 in sgLacz, sgPaxip1#1, and sgPaxip1#3 cells treated with or without DON (1 μM) for 72 hours. (D) Heatmap of CUT&Tag-seq signals of H3K4me3 from 3-kb upstream and downstream of TSS in sgLacz and sgPaxip1#1 cells with or without DON treatment (1 μM). (E) Correlation between CUT&Tag signals of PAXIP1 and H3K4me3. (F) Left, heatmap of DON-induced PAXIP1 peaks at promoter in wild-type KPC1199 (sgLacz) cells under DON treatment (1 μM). Right, heatmap of H3K4me3 peaks within DON-induced PAXIP1-binding domains in sgLacz and sgPaxip1#1 cells with or without DON treatment (1 μM). (G) Representative IGV screenshot of H3K4me3 CUT&Tag signals at the indicated genes from sgLacz and sgPaxip1#1 cells with or without DON treatment (1 μM). (H) Relative quantitative PCR analysis of H3K4me3 occupancies in the zones indicated in (G). The input was used as the control. (I and J) sgLacz, sgPaxip1#1, and sgPaxip1#3 cells were treated with or without DON (1 μM) for 72 h. (I) The mRNA levels of Hmox1, Steap3, Atg7, Slc7a11, and Gpx4 were determined by RT-qPCR. (J) Western blot analysis of Hmox1, Slc7a11, Gpx4, and β-Actin in the indicated groups. Data represent mean ± SD (H and I) with n = 3 biological replicates. p values were determined using two-sided Pearson’s correlation test (E) and one-way ANOVA with Tukey’s multiple comparison test (H and I). ∗, 0.01 < p ≤ 0.05; ∗∗, 0.001 < p ≤ 0.01; ∗∗∗, p ≤ 0.001.
Figure 4
Figure 4
HMOX1 promotes cellular ferrous iron accumulation, mediating lipid peroxidation upon glutamine restriction (A and B) KPC1199 cells were treated as indicated and stained with FeRhoNox-1 (Fe2+ indicator). The relative labile iron pool levels were then evaluated by using flow cytometry. (C and D) Relative labile iron pool (C) and lipid peroxidation (D) were assessed in KPC1199 cells under DON (1 μM) and/or DFO (100 μM) treatment for 72 hours. (E and F) Relative labile iron pool (E) and lipid peroxidation (F) were assessed in KPC1199 cells under DON (1 μM) and/or ZnPP (10 μM) treatment for 72 hours. (G) Hmox1 levels were examined by western blotting in sgHmox1#2, #3, and the control sgLacz cells with or without DON treatment (1 μM). (H–J) Relative levels of labile iron pool (H), lipid peroxidation (I), and MDA (J) were assessed in indicated cells with or without DON (1 μM) treatment for 72 h. Data represent mean ± SD (A–F and H–J) with n = 3 biological replicates. p values were determined using unpaired Student’s t test (A and B), two-way ANOVA with Tukey’s multiple comparison test (C–F, H, and I), or one-way ANOVA with Tukey’s multiple comparison test (J).
Figure 5
Figure 5
Targeting glutamine metabolism sensitizes PDAC cells to GPX4 inhibitor-induced ferroptosis (A) Relative lipid peroxidation levels were assessed in KPC1199 cells under DON (1 μM) treatment for 72 h. RSL3 (1 μM), Trolox (100 μM), and Fer-1 (10 μM) were added into the indicated groups for the final 6 hours. (B) Cell viability was assessed in KPC1199 cells under DON (1 μM) treatment for 72 h. RSL3 (5 μM), Trolox (100 μM), and Fer-1 (10 μM) were added into the indicated groups for the final 12 hours. (C) KPC1199 cells were treated with DON (1 μM) or control for 72 h. RSL3 (5 μM) and DMSO were added into the indicated groups for the final 12 h. Transmission electron microscopy (TEM) images showed mitochondrial morphology, and the mitochondrial outer membrane rupture was indicated with red arrow. Scale bars, 500 nm. (D and E) Upper, schematic diagram of the subcutaneous tumor model and treatment. Subcutaneous tumors were intratumorally administered with DON, RSL3, the combination, and DMSO as control. Tumors were collected and weighted (n = 10 per group). Scale bar, 1 cm. (F) Representative H&E staining and immunohistochemical analysis of 4HNE, GPX4, Ki67, PAXIP1, and H3K4me3 levels in tumors from the indicated groups of (D). Scale bars, 2 mm and 100 μm for insets. Data were represented as mean ± SD (A and B) with n = 3 biological replicates or mean ± SEM (E). p values were determined using one-way ANOVA with Tukey’s multiple comparison test (A, B, and E).
Figure 6
Figure 6
DON treatment induces lipid peroxidation in human PDAC (A) Cell viability of PANC-1, MIA PaCa-2, BxPC-3, and AsPC-1 cells under DON treatment for 72 hours. (B and C) Relative lipid peroxidation levels (B) and cell viability (C) were assessed in AsPC-1 and MIA PaCa-2 cells under treatment of indicated concentrations of DON. (D) The mRNA levels of Hmox1, Steap3, Atg7, Slc7a11, and Gpx4 were determined by RT-qPCR in AsPC-1 and MIA PaCa-2 cells under treatment of DON (AsPC-1 10 μM; MIA PaCa-2 4 μM) and/or MM-102 (25 μM). (E) Western blot analysis of HMOX1, SLC7A11, GPX4, β-Actin, H3K4me3, and Histone H3 in AsPC-1 and MIA PaCa-2 cells. (F and G) Relative levels of labile iron pool (F) and lipid peroxidation (G) were assessed in AsPC-1 and MIA PaCa-2 cells under treatment of DON (AsPC-1 10 μM; MIA PaCa-2 4 μM) and/or DFO (100 μM) for 72 hours. (H and I) Relative levels of labile iron pool (H) and lipid peroxidation (I) were assessed in AsPC-1 and MIA PaCa-2 cells under treatment of DON (AsPC-1 10 μM; MIA PaCa-2 4 μM) and/or ZnPP (10 μM) for 72 h. Data were represented as mean ± SD (B–D and F–I) with n = 3 biological replicates. p values were determined using one-way ANOVA with Tukey’s multiple comparison test (B–D) or two-way ANOVA with Tukey’s multiple comparison test (F–I). ∗, 0.01 < p ≤ 0.05; ∗∗, 0.001 < p ≤ 0.01; ∗∗∗, p ≤ 0.001.
Figure 7
Figure 7
Targeting glutamine dependency confers vulnerability to GPX4 inhibitor-induced ferroptosis in human PDAC (A) Lipid peroxidation levels were assessed in AsPC-1 and MIA PaCa-2 cells after treatment with DON (AsPC-1 10 μM; MIA PaCa-2 4 μM) for 72 h. RSL3 (AsPC-1 4 μM; MIA PaCa-2 10 μM), Trolox (100 μM), and Fer-1 (10 μM) were added into the indicated groups for the final 6 hours. (B) Cell viability was assessed in AsPC-1 and MIA PaCa-2 cells after treatment with DON (AsPC-1 10 μM; MIA PaCa-2 4 μM) for 72 h. RSL3 (10 μM), Trolox (100 μM), and Fer-1 (10 μM) were added into the indicated groups for the final 12 hours. (C–F) Schematic diagram of therapeutic treatment in the patient-derived xenograft (PDX) tumor model. PDX tumors of #1 PDX2022003 (C, n = 10 per group) and #2 PDX2022002 (E, n = 8 per group) were intratumorally administered with DON, RSL3, the combination, and DMSO as control; tumors were collected and weighted as shown. Representative H&E staining and immunohistochemical analysis of 4HNE, GPX4, and Ki67 levels in #1 PDX2022003 (D) and #2 PDX2022002 (F) tumors from the indicated groups. Scale bars, 1 cm, 2 mm, and 100 μm. Data were represented as mean ± SD (A and B) with n = 3 biological replicates or mean ± SEM (C and E). p values were determined using one-way ANOVA with Tukey’s multiple comparison test (A–C and E).

References

    1. DeBerardinis R.J., Lum J.J., Hatzivassiliou G., Thompson C.B. The biology of cancer: metabolic reprogramming fuels cell growth and proliferation. Cell Metabol. 2008;7:11–20. doi: 10.1016/j.cmet.2007.10.002. - DOI - PubMed
    1. Pavlova N.N., Zhu J., Thompson C.B. The hallmarks of cancer metabolism: Still emerging. Cell Metabol. 2022;34:355–377. doi: 10.1016/j.cmet.2022.01.007. - DOI - PMC - PubMed
    1. Altman B.J., Stine Z.E., Dang C.V. From Krebs to clinic: glutamine metabolism to cancer therapy. Nat. Rev. Cancer. 2016;16:619–634. doi: 10.1038/nrc.2016.71. - DOI - PMC - PubMed
    1. Kamphorst J.J., Nofal M., Commisso C., Hackett S.R., Lu W., Grabocka E., Vander Heiden M.G., Miller G., Drebin J.A., Bar-Sagi D., et al. Human pancreatic cancer tumors are nutrient poor and tumor cells actively scavenge extracellular protein. Cancer Res. 2015;75:544–553. doi: 10.1158/0008-5472.CAN-14-2211. - DOI - PMC - PubMed
    1. Encarnacion-Rosado J., Kimmelman A.C. Harnessing metabolic dependencies in pancreatic cancers. Nat. Rev. Gastroenterol. Hepatol. 2021;18:482–492. doi: 10.1038/s41575-021-00431-7. - DOI - PMC - PubMed

MeSH terms

Substances