. 2025 Feb 18;6(2):101932.
doi: 10.1016/j.xcrm.2025.101932. Epub 2025 Jan 28.

A functional cardiac patch promotes cardiac repair by modulating the CCR2- cardiac-resident macrophage niche and their cell crosstalk

Affiliations

A functional cardiac patch promotes cardiac repair by modulating the CCR2- cardiac-resident macrophage niche and their cell crosstalk

Chengbin Ding et al. Cell Rep Med. .

Abstract

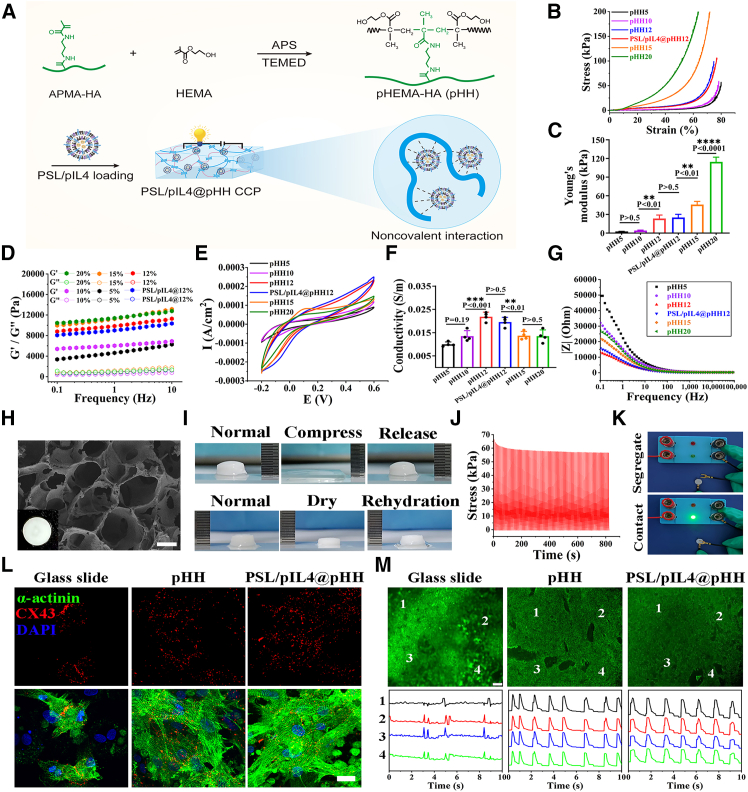
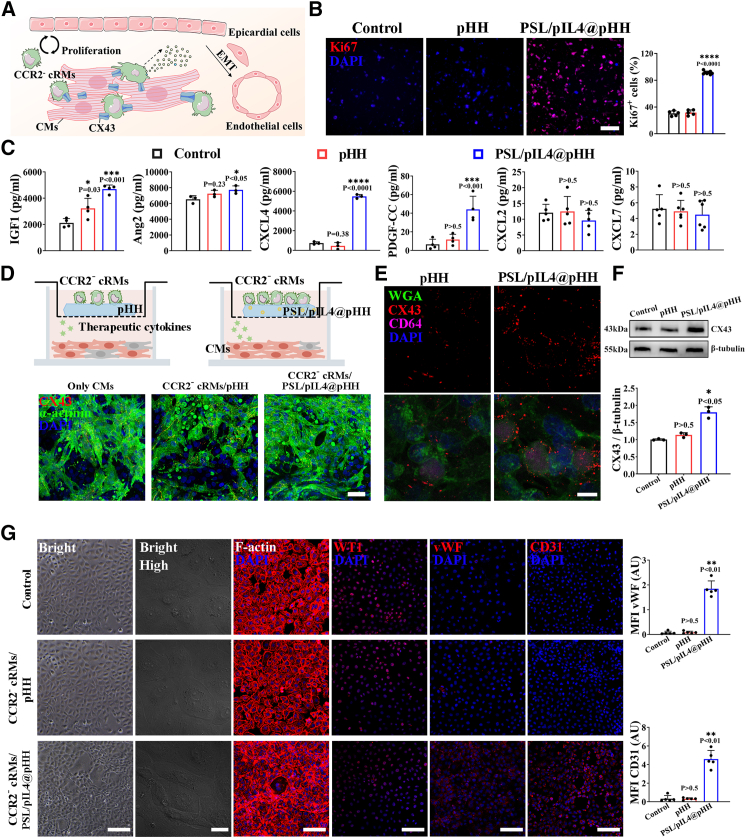
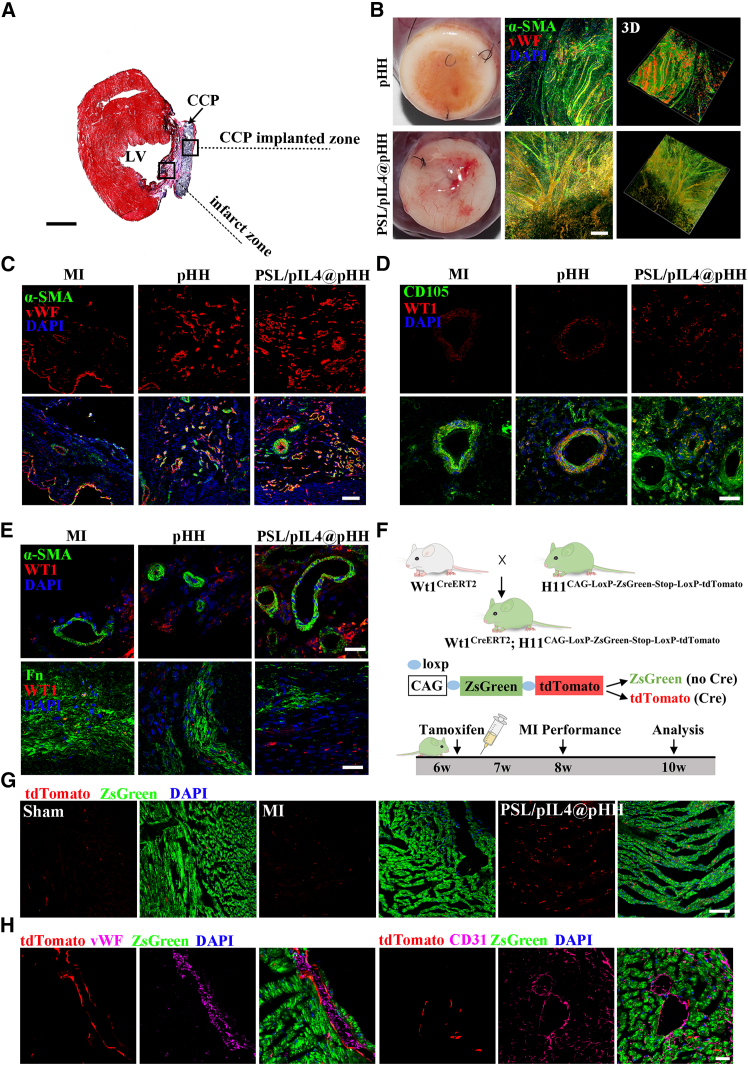
C-C chemokine receptor type 2 (CCR2-) cardiac-resident macrophages (CCR2- cRMs) are known to promote cardiac repair after myocardial infarction (MI). However, the substantial depletion and slow recovery of CCR2- cRMs pose significant barriers in cardiac recovery. Here, we construct a functional conductive cardiac patch (CCP) that can provide exogenously elastic conductive microenvironment and induce endogenously reparative microenvironment mediated by CCR2- cRMs for MI repair. This CCP exhibits suitable mechanical properties, conductivity, and high water retention, reminiscent of natural myocardium, which can actively engage in modulating CCR2- cRM renewal and their cell crosstalk. The functional CCP can promote the expression of Connexin43 between CCR2- cRMs and cardiomyocytes (CMs) and regulate paracrine signaling to activate epicardial cell epithelial-to-mesenchymal transition (EMT) toward endothelial cells using rat and Wt1CreERT2 transgenic lineage tracing mice. Overall, this study provides a promising strategy to construct a synergistic reparative microenvironment for MI repair.

Keywords: cardiac-resident macrophage; cell crosstalk; conductive cardiac patch; epicardial cell; myocardial infarction; revascularization.


Conflict of interest statement

Declaration of interests The authors declare no competing interests.

Figures

None
Graphical abstract
Figure 1
Figure 1
Preparation, characterization, and internalization of PSL/pIL4 (A) Schematic illustrated the composition of PSL, and the assembly and cell transfection process of PSL/pIL4. (B) Representative macroscopic image of the Tyndall effect of PSL-1 solution, and the particle size distribution of PSL-1 determined by dynamic light scattering (left) and transmission electron microscopy (right). Scale bar, 100 μm. (C) Representative fluorescence images of RAW264.7 treated with different PSLs (PSL-1: 10%PS, PSL-2: 5%PS, PSL-3: 0%PS) for 5 h. PSLs were labeled by DiI. Scale bar, 40 μm. (D) Flow cytometry analysis of the internalization efficiency to RAW264.7 after incubation with PSL-1 for 5 h. (E) The uptake of PSL-1 (labeled with DiO) by CCR2 cRMs. Scale bar, 10 μm. (F) The flow cytometry analysis for the endocytosis of PSL-1 (DiO-labeled) in the cRM and CM co-culture system after 5 h treatment. (G) Representative fluorescence images and statistical analysis of endocytosis of PSL-1 (labeled with DiI) in RAW264.7 under different conditions, including none, 4°C, CPZ, EIPA, and filipin pre-treatment (n = 4). Scale bar, 40 μm. Error bar represented ±SD. CPZ, chlorpromazine; EIPA, 5-(N-ethyl-N-isopropyl)-amiloride. (H) Fluorescent visualization of PSL-1 localization in RAW264.7 at 5 and 10 h after treatment (PSL, red; nuclei, blue; lysosome, green) and intensity profiles across the cell. Scale bar, 10 μm. Please also see Figures S1 and S2.
Figure 2
Figure 2
Preparation and characterization of PSL/pIL4@pHH CCP and its influence on CMs functionalization (A) Schematic of PSL/pIL4@pHH CCP fabrication process. (B and C) The stress-strain curves (B) and the elastic modulus (C) of different pHH hydrogels (HEMA concentration was 5%, 10%, 12%, 15%, and 20%, respectively) (n = 3). Error bar represented ±SD. (D) Rheological dynamic oscillation frequency sweep test of different hydrogels (Gʹ [storage/elastic modulus] and G″ [loss/viscous modulus]). (E and F) The cyclic voltammetry curves (E) and corresponding electrical conductivity (F) of different hydrogels (n = 4). Error bar represented ±SD. (G) The electrical impedance spectra (EIS, impedance (|Z|) versus frequency) of different hydrogels. (H) Representative macroscopic image and scanning electron microscopy (SEM) image of pHH12 hydrogel. Scale bar, 40 μm. (I) Digital images of pHH12 hydrogel showing compressive elasticity (upper row) and their water-driven shape-restoration (lower row). (J) The cyclic compression test of pHH12 hydrogel at a strain rate of 25 mm min−1 up to 60% deformation for 100 cycles. (K) The luminance changes of the LED light bulb. The circuit was assembled by pHH12 hydrogel and LED light bulb, gel was segregated (up) and contacted (bottom). (L) Cardiac-specific proteins expression of α-actinin (green) and CX43 (red) in the CMs on glass slide, pHH hydrogel, and PSL/pIL4@pHH hydrogel at day 7. Scale bar, 20 μm (M) Calcium transient (up) in the CMs and corresponding frequency signals (bottom) in different groups after 7 days of culture. Please also see Figures S3 and S4.
Figure 3
Figure 3
PSL/pIL4@pHH CCP modulated the proliferation and paracrine behavior of CCR2 cRMs to influence CMs and epicardial cells (A) Schematic described PSL/pIL4@pHH CCP modulated CCR2 cRM proliferation and cell crosstalk with CMs/epicardial cells, including CCR2 cRMs directly coupled with CMs via CX43 and CCR2 cRM-secreted cytokines to activate epicardial cell phenotype transition. (B) Representative fluorescence images of Ki67-positive CCR2 cRMs after cultured on glass slide, pHH CCP, and PSL/pIL4@pHH CCP for 3 days. Scale bar, 100 μm. Error bar represented ±SD. (C) Quantitative analysis of the cytokine secretion of CCR2 cRMs by ELISA at day 3 in different groups. n = 3 independent samples. Error bar represented ±SD. (D) Schematic and representative fluorescence images of CMs co-cultured with CCR2 cRMs on different CCPs for 3 days by a transwell system. Scale bar, 50 μm. (E) Immunostaining for CX43 protein expression (red) between CMs (WGA: green) and CCR2 cRMs (CD64: magenta) after CCR2 cRMs and CMs directly co-cultured on pHH CCP and PSL/pIL4@pHH CCP for 3 days. Scale bar, 10 μm. (F) Western blotting to detect CX43 protein levels. n = 3 independent samples. Quantitative data were presented with median and interquartile range values and compared using the rank-sum test. (G) Representative bright-field and fluorescence images of epicardial cells co-cultured with CCR2 cRMs/glass slide, CCR2 cRMs/pHH CCP, and CCR2 cRMs/PSL/pIL4@pHH CCP by a transwell system at day 3 (left), and the statistical analysis (right) of vWF and CD31 in epicardial cells based on the immunofluorescence images. Scale bar, 100 μm (n = 5). The quantitative data were presented with median and interquartile range values and compared using the rank-sum test. Please also see Figure S4.
Figure 4
Figure 4
PSL/pIL4@pHH CCP implantation modulated the proportion of CCR2 cRMs/CCR2+ RMs in the rat MI model to rectify the aberrant immune microenvironment and improve cardiac function (A) The population of CCR2 cRMs dramatically decreased after MI for 3 days detected by flow cytometry (n = 3). (B) Graphical representation of the experimental design. The rat MI model was established, and different CCPs were implanted. CCR2 cRMs/CCR2+ RMs were isolated from rat hearts by flow cytometry at day 7, day 14, and day 28 post implant. (C) Representative gate plots of CCR2 cRMs at different time points by flow cytometry in different groups. (D) Quantitative analysis of CCR2 cRMs based on flow cytometry in different groups (n = 4). Error bar represented ±SD. (E) The proportion of CCR2 cRM/CCR2+ RM population based on flow cytometry at day 7 (left), day 14 (middle), and day 28 (right). Error bar represented ±SD. (F) Representative immunofluorescence images of CD68/Ki67 and quantitative analysis of CCR2 cRMs (CD68+Ki67+) after implantation for 28 days (n = 5). Ki67 (green), DAPI (blue), and CD68 (red). Scale bar, 50 μm. The data were presented with median and interquartile range values and compared using the rank-sum test. (G) Schematic described the antagonistic relationship between CCR2v cRMs and CCR2+ RMs from peripheral blood. (H) Changes of FS in different groups determined by echocardiography at day 7, day 14, and day 28 after implantation. (I) Linear regression analysis for the association of the percentage of CCR2 cRMs and FS. Dashed lines indicated 95% confidence intervals. Please also see Figure S5.
Figure 5
Figure 5
PSL/pIL4@pHH CCP implantation improved myocardial electrical integration by modulating the CX43 expression after MI for 4 weeks (A) Representative epicardial activation maps located on the infarcted area in different groups after implantation for 4 weeks. Red: the earliest activation, blue: the latest activation, and numbers indicated activation time (ms). (B) The potential amplitude of the infarction area in each group. (C) Immunofluorescent staining of α-actinin (green) and CX43 (red) proteins in the infarct area in different groups. Scale bar, 40 μm. (D) Immunofluorescence images of CX43 protein (red) expression between CMs (WGA: green) and CCR2 cRMs (CD64: magenta) in different groups. Scale bar, 10 μm. (E) The conduction velocities in the infarcted area in different groups were calculated based on epicardial activation maps (n = 4). Error bar represented ±SD. (F) Quantitative analysis of the potential amplitude in all groups (n = 4). Error bar represented ±SD. (G and H) The percentages of α-actinin proteins (G) and CX43 proteins (H) in different groups were calculated based on immunostaining images (n = 5). Error bar represented ±SD. (I) Quantitative analysis of CX43-positive CCR2 cRMs (n = 6). Error bar represented ±SD. Please also see Figure S5.
Figure 6
Figure 6
PSL/pIL4@pHH CCP implantation activated epicardial cell EMT and facilitated revascularization in the infarction area (A) Schematic of areas assessed for vascularization from Masson’s trichrome staining heart tissue, including the infarct zone and CCP implanted zone. Scale bar, 2 mm. (B) Representative bright-field and fluorescence images of blood vessels on the CCP after implantation for 4 weeks. Scale bar, 200 μm. (C) vWF immunostaining (red) and α-SMA immunostaining (green) in the infarct area in different groups. Scale bar, 200 μm. (D and E) Representative histological immunofluorescence staining of WT1 (red) and multi-lineage markers (green) including CD105, α-SMA, and Fn proteins in infarct areas after implantation for 4 weeks. Scale bar, 40 μm. (F) Experimental design for tamoxifen-treated WT1CreER/+ H11tdtomato/+ mice. (G) Representative images of tracing epicardium-derived cells in different groups after implantation for 2 weeks. Scale bar, 100 μm. (H) Immunostaining of endothelial marker vWF (magenta) (left) and CD31 (magenta) (right) in the infarct area. Scale bar, 25 μm. Please also see Figures S6 and S7.
Figure 7
Figure 7
PSL/pIL4@pHH CCP promoted cardiac repair in MI rats (A) Representative images of rat gross hearts in different groups. Scale bar, 1 cm. (B) Representative images of Masson’s trichrome staining of heart sections. Red: myocardium, blue: fibrous tissues. Scale bar, 2 mm. (C) Wheat-germ agglutinin (WGA) staining showed CM boundaries in the border area. Scale bar, 50 μm. (D and E) Quantitative analysis of infarction area (n = 9) (D) and infarcted wall thickness (n = 7) (E) based on Masson’s trichrome staining images. Error bar represented ±SD. (F) Statistical analysis of CM size based on WGA staining (n = 5). Error bar represented ±SD. (G) LV echocardiography in different groups after CCP implantation for 1 week and 4 weeks. (H) Changes of FS, EF, LVIDs, and LVIDd in different groups were determined by echocardiography after implantation for 1 week and 4 weeks. (I) Statistical analysis of the changes of FS, EF, LVIDs, and LVIDd in different groups during the 4 weeks’ implantation period. Error bar represented ±SD. Please also see Figure S7.

References

    1. Hastings C.L., Roche E.T., Ruiz-Hernandez E., Schenke-Layland K., Walsh C.J., Duffy G.P. Drug and cell delivery for cardiac regeneration. Adv. Drug Deliv. Rev. 2015;84:85–106. doi: 10.1016/j.addr.2014.08.006. - DOI - PubMed
    1. Matsa E., Sallam K., Wu J.C. Cardiac stem cell biology: glimpse of the past, present, and future. Circ. Res. 2014;114:21–27. doi: 10.1161/circresaha.113.302895. - DOI - PMC - PubMed
    1. McMurray J.J.V., Pfeffer M.A. Heart failure. Lancet (London, England) 2005;365:1877–1889. doi: 10.1016/s0140-6736(05)66621-4. - DOI - PubMed
    1. Ruschitzka F., Abraham W.T., Singh J.P., Bax J.J., Borer J.S., Brugada J., Dickstein K., Ford I., Gorcsan J., 3rd, Gras D., et al. Cardiac-resynchronization therapy in heart failure with a narrow QRS complex. N. Engl. J. Med. 2013;369:1395–1405. doi: 10.1056/NEJMoa1306687. - DOI - PubMed
    1. Shin S.H., Hung C.L., Uno H., Hassanein A.H., Verma A., Bourgoun M., Køber L., Ghali J.K., Velazquez E.J., Califf R.M., et al. Mechanical dyssynchrony after myocardial infarction in patients with left ventricular dysfunction, heart failure, or both. Circulation. 2010;121:1096–1103. doi: 10.1161/circulationaha.109.863795. - DOI - PubMed