. 2025 Mar 7;12(3):ENEURO.0376-24.2024.
doi: 10.1523/ENEURO.0376-24.2024. Print 2025 Mar.

Hawkmoth Pheromone Transduction Involves G-Protein-Dependent Phospholipase Cβ Signaling

Affiliations

Hawkmoth Pheromone Transduction Involves G-Protein-Dependent Phospholipase Cβ Signaling

Anna C Schneider et al. eNeuro. .

Abstract

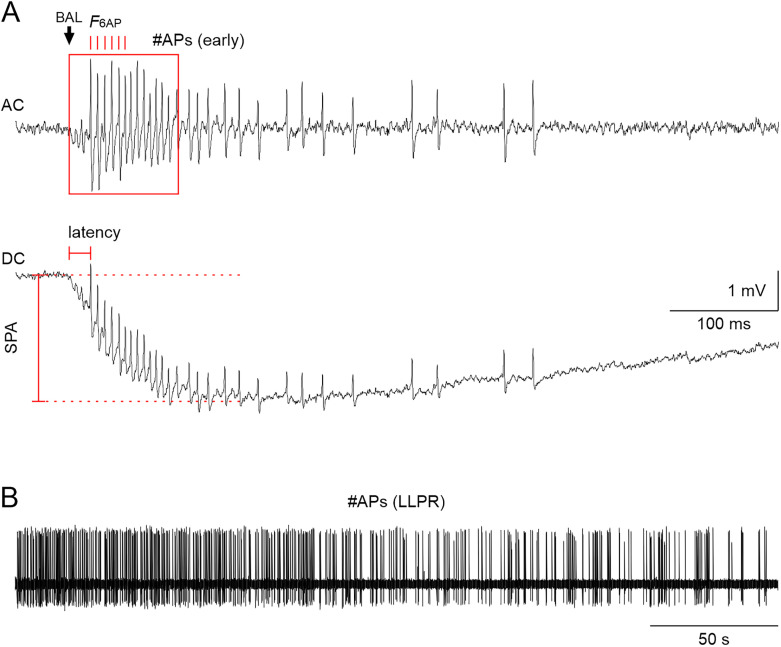
Evolutionary pressures adapted insect chemosensation to their respective physiological needs and tasks in their ecological niches. Solitary nocturnal moths rely on their acute olfactory sense to find mates at night. Pheromones are detected with maximized sensitivity and high temporal resolution through mechanisms that are mostly unknown. While the inverse topology of insect olfactory receptors and heteromerization with the olfactory receptor coreceptor suggest ionotropic transduction via odorant-gated receptor-ion channel complexes, contradictory data propose amplifying G-protein-coupled transduction. Here, we used in vivo tip-recordings of pheromone-sensitive sensilla of male Manduca sexta hawkmoths at specific times of day (rest vs activity). Since the olfactory receptor neurons distinguish signal parameters in three consecutive temporal windows of their pheromone response (phasic; tonic; late, long-lasting), respective response parameters were analyzed separately. Disruption of G-protein-coupled transduction and block of phospholipase C decreased and slowed the phasic response component during the activity phase of hawkmoths without affecting any other component of the response during activity and rest. A more targeted disruption of Gα subunits by blocking Gαo or sustained activation of Gαs using bacterial toxins affected the phasic pheromone response, while toxins targeting Gαq and Gα12/13 were ineffective. Consistent with these data, the expression of phospholipase Cβ4 depended on zeitgeber time, which indicates circadian clock-modulated metabotropic pheromone transduction cascades that maximize sensitivity and temporal resolution of pheromone transduction during the hawkmoth's activity phase. Thus, discrepancies in the literature on insect olfaction may be resolved by considering circadian timing and the distinct odor response components.

Keywords: circadian clock; insect; olfaction.


Conflict of interest statement

The authors declare no competing financial interests.

Figures

Figure 1.
Figure 1.
Quantification of the three phases of the pheromone response of hawkmoth long trichoid sensilla. The BAL-elicited spiking response consists of three consecutive spiking patterns (3 components) with distinct kinetics but variable duration (1) a phasic, high-frequency spiking response that lasts <100 ms (A), (2) a tonic spiking response with lower and more variable spiking frequency that lasts >100 ms (A), and (3) a late long-lasting spiking response (LLPR) that lasts seconds to minutes (B) (Dolzer et al., 2003; Nolte et al., 2016). A, High-pass filtered (AC, top trace) and unfiltered (DC, bottom trace) recording of the sensillum potential with APs of the phasic–tonic ORN response to BAL. BAL stimulus: 50 ms, 10 µl of 0.1 mg/ml on 1 cm2 filter paper; arrow: start of the BAL response. For the phasic response, we calculated the average instantaneous AP frequency of the first six APs (F6AP, red ticks, top trace) of the BAL response. A combination of both phasic and part of the tonic response was evaluated as the number of APs in a 100 ms window starting at the onset of the BAL response [#APs (early), red box, top trace]. Latency (red horizontal marking, bottom trace) is the time from the beginning of the BAL response to the first AP. SPA is the amplitude from the baseline voltage before BAL stimulation to the negative peak (red vertical marking, bottom trace) (B) High-pass filtered recording of the LLPR. The LLPR was evaluated as the number of APs [#APs (LLPR)] in the 295 s before the next BAL stimulus, excluding the first 5 s after the BAL stimulus.
Figure 2.
Figure 2.
Illustration of the linear fit analysis of pheromone responses. A, BAL stimuli were applied every 5 min in the 120-min-long tip-recordings of hawkmoth trichoid sensilla. For each animal and experimental condition [here, one control (black) and one GDP-β-S (red) animal], we generated a linear regression model for time and respective BAL response parameters (here, latency to the first AP after the onset of the BAL response) and used a t test to determine whether the slope of the fit significantly differed from zero (solid line) or not (dashed line). B, To quantify the response kinetics to BAL stimulation, we binned the data of the first second after the BAL stimulus in 10 ms bins across all BAL stimulations for each animal. Each resulting cumulative histogram (dotted line) was fitted with a sigmoidal function (solid line) for quantification that yielded three fit parameters: maximum spike number (APmax), time of the midpoint of the sigmoid (t1/2; indicated by arrows at the x-axis), and slope of the midpoint (k). Depicted are examples of two animals.
Figure 3.
Figure 3.
Inhibition of G-protein signaling of pheromone-sensitive ORNs by GDP-β-S decreased the phasic BAL response and increased response latency during the hawkmoth's activity phase. A, Examples of high-pass filtered tip-recordings (AC) of ORN responses in control (ctrl, recording solution + DMSO, black) and with the G-protein antagonist GDP-β-S (dissolved in SLR + DMSO, red) at ZT 1–3, 100 min after the start of the recording. Arrow indicates the onset of BAL response. Response parameters (Fig. 1) during the moth's late activity phase (ZT 1–3; B) and at rest (ZT 9–11; C) in control and GDP-β-S. Data are shown as mean (line) ± standard deviation (shaded area). D, One-way ANOVA results with appropriate post hoc test for multiple comparisons (α = 0.05) for the slopes of BAL response parameters (see Materials and Methods and Fig. 2A). F6AP slopes decreased significantly, and latency slopes increased significantly in GDP-β-S compared with control at the activity phase (ZT 1–3). No other parameters showed significant differences compared with control at either ZT. Dots show data for individual experiments; red lines indicate the mean. Raw data are provided in Extended Data Figure 3-1.
Figure 4.
Figure 4.
Inhibition of G-protein signaling changed kinetics of the ORN response to BAL stimulation during the activity phase. A, Peristimulus time histograms (PTSH; 10 ms bins) of the first second of the ORN response to BAL stimulation in control (black) and in GDP-β-S (red). Data are shown as mean (line) ± standard deviation (shaded area). Arrow: onset of BAL response. B, Fit parameters [total number of spikes in 1 s after onset of the BAL response (APmax), time of the sigmoid midpoint (t1/2), and slope (k) of the midpoint] of sigmoidal fits to the cumulative spike histograms (see Eq. 1, Materials and Methods, and Fig. 2B). One-way ANOVA with appropriate post hoc test (α = 0.05) revealed a significantly steeper slope (k closer to zero) in control compared with GDP-β-S during the activity phase (ZT 1–3). Steeper slopes indicate faster rise and fall times of the spike count in the PTSHs. The total number of spikes and sigmoid midpoint were not significantly different. Dots show fit parameter values for individual experiments; red lines indicate the mean. Raw data are provided in Extended Data Figure 4-1.
Figure 5.
Figure 5.
Inhibition of PLC of pheromone-sensitive ORNs with U73122 decreased the phasic BAL responses at both ZTs while decreasing SPA and increasing response latency only at ZT 1–3. A, Example high-pass filtered (AC) tip-recordings of ORN responses in control (U73343, dark purple) and in PLC inhibitor (U73122, light purple) at ZT 1–3, 100 min. The arrow indicates the onset of the BAL response. Response parameters (Fig. 1) during the activity phase (ZT 1–3; B) and at rest (ZT 9–11; C) in control and U73122. Data are shown as mean (lines) ± standard deviation (shaded areas). D, One-way ANOVA results with appropriate post hoc test for multiple comparisons (α = 0.05) for the slopes of BAL response parameters (see Materials and Methods and Fig. 2A). Compared with controls, F6AP slopes decreased at both ZTs in U73122, but SPA and latency slopes increased only at the activity phase (ZT 1–3). Other BAL response parameters showed no significant differences between control and U73122 at either ZT. Dots show data of individual experiments; red lines indicate the mean. Raw data are provided in Extended Data Figure 5-1.
Figure 6.
Figure 6.
Responses to BAL stimulation at ZT 1–3 were affected by toxins that target Gαs or Gαo subunits. A, Examples of tip-recordings from ORNs with BAL stimulation in control (black), with cTox (blue), pTox (yellow), and pmTox (green); repeated measures of one animal shown for each toxin. AC: high-pass filtered recording to highlight AP response; DC: unfiltered SPA with APs; Arrow: onset of the BAL response. B, Quantification with one-way RM ANOVA with appropriate post hoc test for multiple comparisons (α = 0.05) of the same parameters as in Figure 3 and Figure 5. During the activity phase (ZT 1–3), the frequency of the phasic BAL responses (F6AP) and the number of APs during the first 100 ms of the response [#APs (early)] decreased in cTox (blue; sustained activation of Gαs) and pTox (yellow; inhibition of Gαo), while response latency increased significantly. The effect of pmTox (green; constitutive activation of Gα12/13, Gαi, and Gαq) was not different from control. Raw data are provided in Extended Data Figure 6-1.
Figure 7.
Figure 7.
Relative expression levels of mRNA for G-proteins, PLCβ, and the circadian clock protein timeless (tim) in male hawkmoth antenna at different ZTs. qPCR revealed that mRNA levels of PLCβ4 peaked significantly at the beginning of the activity phase at ZT 17. Gαo, Gαq, Gαs, and PLCβ1 did not change throughout the day. The mRNA of the cycling circadian clock protein timeless (tim) served as the positive control. Dots indicate values for biological replicates; each biological replicate contains extracts from eight antennae and three technical repeats. Red lines depict the mean. One-way ANOVA with appropriate post hoc test for pairwise comparisons (α = 0.05). The phylogenetic tree for PLCβ is provided in Extended Data Figure 7-1. Nucleotide sequences of the genes are provided in Extended Data Figure 7-2.

Similar articles

References

    1. Adamo SA, Davies G, Easy R, Kovalko I, Turnbull KF (2016) Reconfiguration of the immune system network during food limitation in the caterpillar Manduca sexta. J Exp Biol 219:706–718. 10.1242/jeb.132936 - DOI - PubMed
    1. Altner H, Prillinger L (1980) Ultrastructure of invertebrate chemo-, thermo-, and hygroreceptors and its functional significance. In: International review of cytology (Bourne GH, Danielli JF, eds), pp 69–139. New York: Academic Press.
    1. Baker TC, Cardé RT (1979) Analysis of pheromone-mediated behaviors in male Grapholita molesta, the oriental fruit moth (Lepidoptera: Tortricidae). Environ Entomol 8:956–968. 10.1093/ee/8.5.956 - DOI
    1. Baker TC, Vogt RG (1988) Measured behavioural latency in response to sex-pheromone loss in the large silk moth Antheraea polyphemus. J Exp Biol 137:29–38. 10.1242/jeb.137.1.29 - DOI - PubMed
    1. Bau J, Justus KA, Loudon C, Cardé RT (2005) Electroantennographic resolution of pulsed pheromone plumes in two species of moths with bipectinate antennae. Chem Senses 30:771–780. 10.1093/chemse/bji069 - DOI - PubMed

LinkOut - more resources