. 2025 Jan 29;16(1):1159.
doi: 10.1038/s41467-025-56570-x.

Genetically-encoded targeted protein degradation technology to remove endogenous condensation-prone proteins and improve crop performance

Affiliations

Genetically-encoded targeted protein degradation technology to remove endogenous condensation-prone proteins and improve crop performance

Ming Luo et al. Nat Commun. .

Abstract

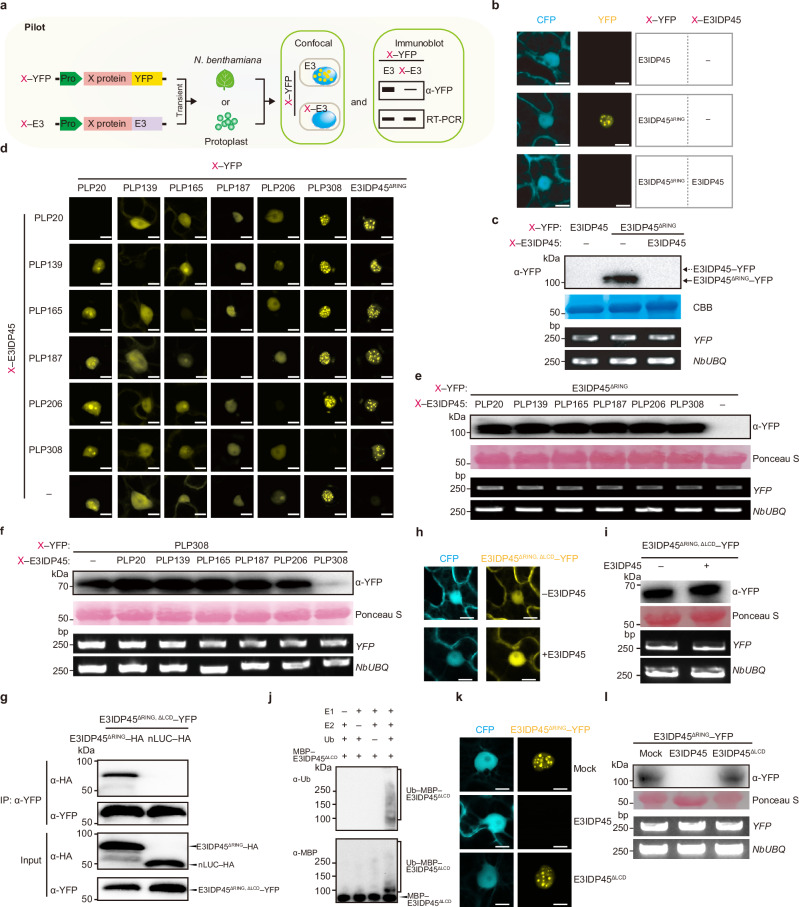
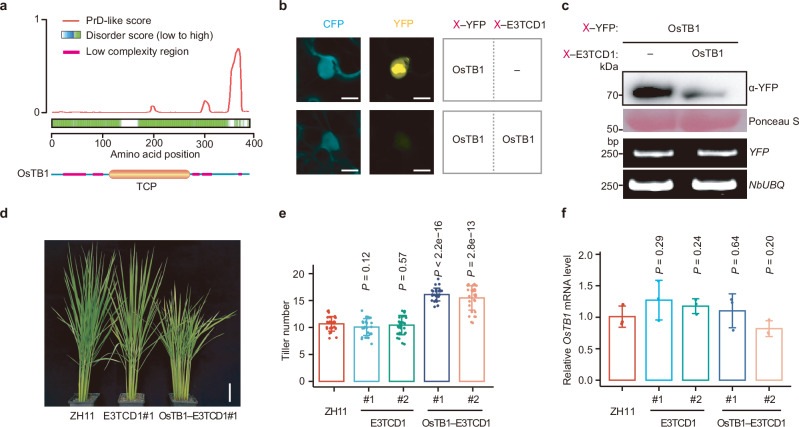
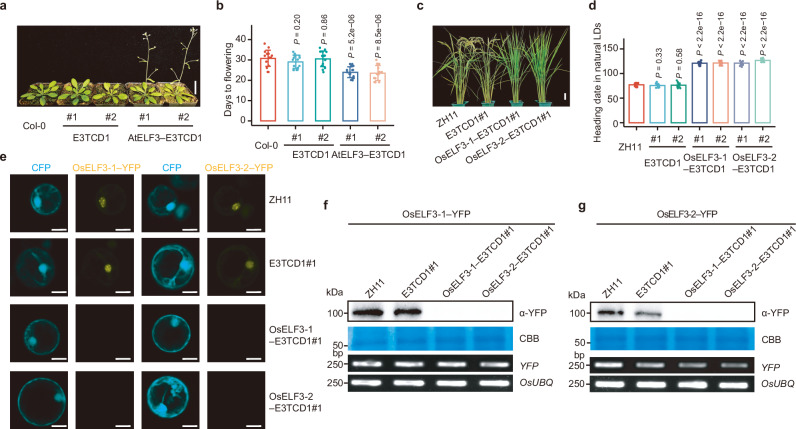
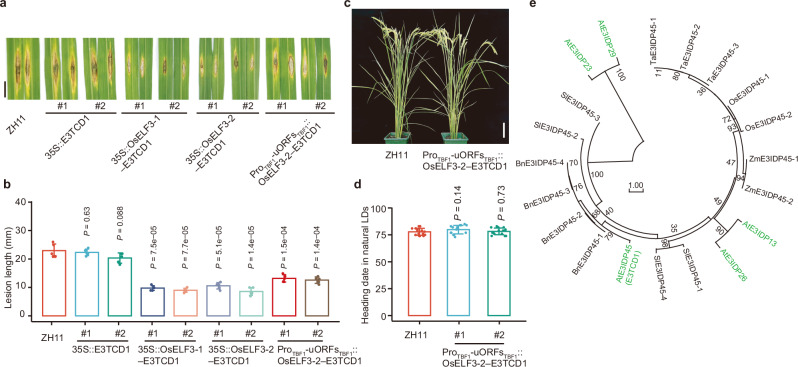
Effective modulation of gene expression in plants is achievable through tools like CRISPR and RNA interference, yet methods for directly modifying endogenous proteins remain lacking. Here, we identify the E3 ubiquitin ligase E3TCD1 and develope a Targeted Condensation-prone-protein Degradation (TCD) strategy. The X-E3TCD1 fusion protein acts as a genetically engineered degrader, selectively targeting endogenous proteins prone to condensation. For example, a transgenic E3TCD1 fusion with Teosinte branched 1 (TB1) degrades the native TB1 protein, resulting in increased tiller numbers in rice. Additionally, conditional degradation of the negative defense regulator Early Flowering 3 via a pathogen-responsive ProTBF1-uORFsTBF1 cassette enhances rice blast resistance without affecting flowering time in the absence of pathogen. Unlike prevailing targeted protein degradation strategies, the TCD system does not rely on small molecules, antibodies, or genetic knock-in fusion tags, demonstrating its promise as a transgene-based approach for optimizing crop performance.


Conflict of interest statement

Competing interests: A patent with the application number 2024116014154 using all data generated from this study has been filed by Wuhan University, listing G.X., M.L., and Q.W. as inventors. Other authors claim no competing interests.

Figures

Fig. 1
Fig. 1. Screening E3 ligases with condensation and self-degradation capacities for the Targeted Condensation-prone-protein Degradation system (TCD).
See also Supplementary Figs. 1, 2. a The schematic diagram of TCD. X, an endogenous target protein X. E3, an E3 ligase from the UPS system. X–E3, a genetically engineered protein degrader by fusing X with E3. b The heatmap to show the distribution of E3 ligases among the RING subfamilies during screening. Plants possess three families of E3 ligases: RING, HECT, and U-box. A total of 508 RING E3 ligases were analyzed using PLAAC to predict their status as intrinsically disordered proteins (IDPs). Of these, 51 were identified as potential IDPs (E3IDPs). Among these E3IDPs, 44 were successfully cloned and expressed in N. benthamiana as YFP fusion proteins (E3IDP–YFP). 17 E3IDPs formed visible condensates, 17 did not form visible condensates, and 10 exhibited no detectable fluorescence signals. Deleting the RING domain (ΔRING) restored YFP fluorescence as condensates for five of the ten fluorescenceless E3IDP–YFP. c Exemplifying E3IDPs with (E3IDP1) or without (E3IDP6) visible condensates. d Exemplifying E3IDPs with or without RING domains (ΔRING). ΔLCD, deleting the LCD domain. e The domain organization of E3IDP45. The SMART website predicts low-complexity regions (red) and the RING domain (orange; 620–659). LCD, the truncation-experiment-mapped region (green; 227–527) required to form visible condensates in N. benthamiana. f In vitro ubiquitination assay to evaluate the self-ubiquitination capacity of E3IDP45. E1, E2, and ubiquitin (Ub) are components of the ubiquitin-transfer cascade with MBP-tagged E3IDP45 (MBP–E3IDP45) simultaneously as an E3 and substrate. g, h Immunoblot analysis (g) and microscopic observation (h) of E3IDP45–YFP in the absence (Mock) or presence of E1 inhibitor TAK-243, the proteasome inhibitor MG-132, and the autophagy inhibitor E64d. Ponceaus S staining (g) was used as a control for protein loading. Semi-quantitative RT-PCR was conducted against YFP with NbUBQ as the internal control (g). For microscopic observation, 35S::CFP serves as the control (c, d, h). Scale bar, 10 µm (c, d, h). Source data are provided as a Source Data file.
Fig. 2
Fig. 2. Validating E3IDP45 for the TCD system.
See also Supplementary Figs. 3, 4. a The schematic of the pilot assays involving transient expression of the X–E3 degrader with the X–YFP target in N. benthamiana or protoplasts to assess TCD efficiency via microscopic observation or immunoblot analysis. X–YFP, YFP-tagged target protein X. X–E3, the degrader for X after fusing with E3. b, c Degradation of the E3IDP45ΔRING–YFP by the E3IDP45 degrader in the pilot experiments of microscopic observation (b) and immunoblot analysis (c) in N.benthamiana. d Microscopic observation of each X–YFP after co-expression with different X–E3IDP45 degraders. Six transcription factors and the E3IDP45ΔRING were examined as the target X protein. e, f Immunoblot analysis of E3IDP45ΔRING–YFP (e) and PLP308–YFP (f) after co-expression with different X–E3IDP45 degraders. g Co-immunoprecipitation to show the interaction between E3IDP45ΔRING with the LCD domain deleted (E3IDP45ΔRING, ΔLCD) and E3IDP45ΔRING. h, i Degradation of E3IDP45ΔRING–YFP without the LCD in the target (E3IDP45ΔRING, ΔLCD) by the E3IDP45 degrader in the pilot experiments of microscopic observation (h) and immunoblot analysis (i) in N.benthamiana. j In vitro ubiquitination assay to evaluate the self-ubiquitination capacity of E3IDP45ΔLCD. k, l Degradation of the E3IDP45ΔRING–YFP target by degraders of E3IDP45 without the LCD in the degrader (E3IDP45ΔLCD) in the pilot experiments of microscopic observation (k) and immunoblot analysis (l) in N.benthamiana. Coomassie brilliant blue (CBB; c) or Ponceaus S staining (e, f, i, l) was used as a control for protein loading. Semi-quantitative RT-PCR was conducted against YFP with NbUBQ as the internal control (c, e, f, i, l). For microscopic observation, 35S::CFP serves as the control (b, h, k). Scale bar, 10 µm (b, d, h, k). Source data are provided as a Source Data file.
Fig. 3
Fig. 3. Genetic analysis of PLP308 in promoting cell death by the TCD via the transient assay.
See also Supplementary Fig. 5. a The schematic to illustrate the application of the TCD system for genetic analysis of target protein X through transient and transgenic assays. Different promoters (Pro) are necessary to control the spatial and temporal expression as well as the expression intensity of the degrader X–E3. b Trypan blue staining to show PLP308–YFP-triggered cell death without (E3TCD1) or with the degrader (PLP308–E3TCD1). Macroscopic cell death appears after transient expression of PLP308–YFP in N. benthamiana for 72 h. c Ion leakage to show PLP308–YFP-triggered cell death. Leaf discs were used for measuring ion leakage after transient expression of PLP308–YFP in N. benthamiana. The points and error bars show the mean ± s.d. of ion concentration (n  =  4; 6 discs each). d, e Microscopic observation (d) and immunoblot analysis (e) of the YFP-tagged PLP308–E3TCD1 degrader (YFP–PLP308–E3TCD1) in the absence (Mock) or presence of E1 inhibitor TAK-243 after transient expression in N. benthamiana. f In vitro ubiquitination assay to detect the ubiquitination of the target PLP308 by the degrader PLP308–E3TCD1. E1, E2, and ubiquitin (Ub) are components of the ubiquitin-transfer cascade with MBP-tagged PLP308–E3TCD1 (MBP–PLP308–E3TCD1) as an E3 and MBP–HA–PLP308 as a substrate. HA, hemagglutinin tag. g, h Microscopic observation (g) and immunoblot analysis (h) of the PLP308–YFP degradation by the PLP308–E3TCD1 degrader in the absence (Mock) or presence of E1 inhibitor TAK-243 after transient expression in N. benthamiana. Ponceaus S staining (e, h) was used as a control for protein loading. Semi-quantitative RT-PCR was conducted against YFP with NbUBQ as the internal control (e, h). For microscopic observation, 35S::CFP serves as the control (d, g). Scale bar, 1 cm (b), 10 µm (d, g). Source data are provided as a Source Data file.
Fig. 4
Fig. 4. Modulating rice tiller numbers by the TCD system in rice.
a Prediction of OsTB1 as an intrinsically disordered protein (IDP) using PLAAC and D2P2 algorithms indicated by Prion domain (PrD)-like score and disorder score, respectively. The bottom section displays low complexity regions and the RING domain as annotated by the SMART website. b, c Pilot experiments to show the degradation of OsTB1 by the OsTB1–E3TCD1 degrader through microscopic observation (b) and immunoblot analysis (c). Ponceaus S staining was used as a control for protein loading. For microscopic observation, 35S::CFP serves as the control. Semi-quantitative RT-PCR is conducted against YFP with NbUBQ as the internal control. d, e The rice tiller numbers in rice Zhonghua11 (ZH11) plants transformed with 35S::E3TCD1 or 35S::OsTB1–E3TCD1. Two independent transgenic lines (#1 and #2) were used for each construct. The bars show the mean ± s.d. (n  = 30) of tiller numbers, and a two-sided Student’s t test was used to determine the significance. f Quantitative RT-PCR to show the relative endogenous OsTB1 mRNA levels in the transgenic lines. Primers binding to the untranslated region, which was not included in the OsTB1–E3TCD1 transgene, were used to amplify the endogenous OsTB1 gene. The bars show the mean ± s.d. (n  =  3) after normalization to ZH11, a two-sided Student’s t test was used to determine the significance. Scale bar, 10 µm (b), 10 cm (d). Source data are provided as a Source Data file.
Fig. 5
Fig. 5. Modulating flowering times in Arabidopsis and rice with the TCD system.
See also Supplementary Figs. 6–9. a, b The flowering phenotype of Arabidopsis Col-0 plants transformed with 35S::E3TCD1 or 35S::AtELF3–E3TCD1. Two independent transgenic lines (#1 and #2) are shown. The bars show the mean ± s.d. (n  =  16) of the days to flowering after seeding, and a two-sided Student’s t test was used to determine the significance. c, d The flowering phenotype of rice Zhonghua11 (ZH11) plants transformed with 35S::E3TCD1, 35S::OsELF3-1–E3TCD1 or 35S::OsELF3-2–E3TCD1. Two independent transgenic lines (#1 and #2) were used for each construct. The bars show the mean ± s.d. (n  =  15) of the days to heading after seeding under the natural long-day (LD) condition, and a two-sided Student’s t test was used to determine the significance. eg In planta degradation assay to demonstrate the degradation of the OsELF3-1 or OsELF3-2 target protein by the OsELF3-1–E3TCD1 or OsELF3-2–E3TCD1 degrader by microscopic observation (e) and immunoblot analysis (f, OsELF3-1; g, OsELF3-2). The plasmids of 35S::CFP/35S::OsELF3-1–YFP or 35S::CFP/35S::OsELF3-2–YFP were co-transformed into the protoplasts prepared from the transgenic plants. Coomassie brilliant blue (CBB) was used as a control for protein loading. Semi-quantitative RT-PCR was conducted against YFP with NbUBQ as the internal control. Scale bar, 3 cm (a), 10 cm (c), 10 µm (e). Source data are provided as a Source Data file.
Fig. 6
Fig. 6. Conditional TCD with the TBF1 expression control cassette.
See also Supplementary Fig. 8. a, b Symptoms and quantification after the fungal pathogen M. oryzae infection in the growth chamber on rice Zhonghua11 (ZH11) plants transformed with 35S::E3TCD1, 35S::OsELF3-1–E3TCD1, 35S::OsELF3-2–E3TCD1 or ProTBF1-uORFsTBF1::OsELF3-2–E3TCD1. Two independent transgenic lines (#1 and #2) were used for each construct. ProTBF1-uORFsTBF1, the ‘TBF1-cassette’ consisting of the immune-inducible promoter (ProTBF1) and two pathogen-responsive upstream open reading frames (uORFsTBF1) of the Arabidopsis TBF1 gene. The bars show the mean ± s.d. (n  =  5) of the lesion length, and a two-sided Student’s t test was used to determine the significance. c, d The flowering phenotype of rice Zhonghua11 (ZH11) plants transformed with ProTBF1-uORFsTBF1::OsELF3-2–E3TCD1. Two independent transgenic lines (#1 and #2) were used for each construct. The bars show the mean ± s.d. (n  =  15) of the days to heading after seeding under the natural long-day (LD) condition, and a two-sided Student’s t test was used to determine the significance. e The phylogenetic tree to show the homologs of E3TCD1 in Arabidopsis thaliana (At), Oryza sativa (Os), Zea mays (Zm), Triticum aestivum (Ta), Brassica napus (Bn), and Solanum lycopersicum (Sl). Scale bar, 1 cm (a), 10 cm (c). Source data are provided as a Source Data file.

Similar articles

References

    1. Bailey-Serres, J., Parker, J. E., Ainsworth, E. A., Oldroyd, G. E. D. & Schroeder, J. I. Genetic strategies for improving crop yields. Nature575, 109–118 (2019). - PMC - PubMed
    1. Liu, G., Lin, Q., Jin, S. & Gao, C. The CRISPR-Cas toolbox and gene editing technologies. Mol. Cell82, 333–347 (2022). - PubMed
    1. Cardi, T. et al. CRISPR/Cas-mediated plant genome editing: outstanding challenges a decade after implementation. Trends Plant Sci.28, 1144–1165 (2023). - PubMed
    1. Mou, R., Niu, R., Yang, R. & Xu, G. Engineering crop performance with upstream open reading frames. Trends Plant Sci.10.1016/j.tplants.2024.10.005 (2024). - PubMed
    1. Kamthan, A., Chaudhuri, A., Kamthan, M. & Datta, A. Small RNAs in plants: recent development and application for crop improvement. Front. Plant Sci. 6, 10.3389/fpls.2015.00208 (2015). - PMC - PubMed

MeSH terms

LinkOut - more resources