. 2025 Jan 29;16(1):1161.
doi: 10.1038/s41467-025-56363-2.

Single cell profiling of circulating autoreactive CD4 T cells from patients with autoimmune liver diseases suggests tissue imprinting

Affiliations

Single cell profiling of circulating autoreactive CD4 T cells from patients with autoimmune liver diseases suggests tissue imprinting

Anaïs Cardon et al. Nat Commun. .

Abstract

Autoimmune liver diseases (AILD) involve dysregulated CD4 T cell responses against liver self-antigens, but how these autoreactive T cells relate to liver tissue pathology remains unclear. Here we perform single-cell transcriptomic and T cell receptor analyses of circulating, self-antigen-specific CD4 T cells from patients with AILD and identify a subset of liver-autoreactive CD4 T cells with a distinct B-helper transcriptional profile characterized by PD-1, TIGIT and HLA-DR expression. These cells share clonal relationships with expanded intrahepatic T cells and exhibit transcriptional signatures overlapping with tissue-resident T cells in chronically inflamed environments. Using a mouse model, we demonstrate that, following antigen recognition in the liver, CD4 T cells acquire an exhausted phenotype, play a crucial role in liver damage, and are controlled by immune checkpoint pathways. Our findings thus suggest that circulating autoreactive CD4 T cells in AILD are imprinted by chronic antigen exposure to promote liver inflammation, thereby serving as a potential target for developing biomarkers and therapies for AILD.


Conflict of interest statement

Competing interests: The authors declare no competing interest.

Figures

Fig. 1
Fig. 1. Detection and immune-phenotyping of circulating liver-self-antigen-specific CD4 T cells.
A Schematic representation of the detection of antigen-specific CD4 T cells based on the upregulation of CD40 ligand (CD154) after 4 h of ex vivo peptide stimulation. B Pseudocolor dot plot representation of CD45RA and CD154 expression at the surface of CD4 T cells after stimulation with peptide pools from the indicated antigens (numbers indicate mean of CD45RACD154+ cells per million total CD4). C Pseudocolor dot plot representation of PD-1, CXCR5, and CD154 expression at the surface of CD45RA- mCD4 T cells after stimulation with peptide pools from the indicated antigens (numbers indicate mean percentage). D Frequency of CD154+ naïve, memory, memory PD-1+ (mPD-1+) and memory CXCR5+ (mCXCR5+) CD4 T cells per million CD4 T cells after Sepsecs, CYP2D6 or PDCE2 peptides stimulation of PBMCs from 12 SLA+ patients and 9 SLA- patients (left; ****: p < 0.0001); or 4 LKM1+ patients and 4 LKM1- patients (central; **: p = 0.0098 (Memory); p = 0.0090 (mPD1+)); or 14 M2+ patients and 14 M2- patients (right; ****: p < 0.0001, *: p = 0,0471). E Frequency of CD154+ naïve, memory, mPD-1+ and mCXCR5+ CD4 T cell per million CD4 T cells after MP65 (C.ALB; ****: p < 0.0001), MP1 (H1N1; ****: p < 0.0001) or SPIKE (SARS-CoV-2; ****: p < 0.0001, ***: p = 0.0003) peptides stimulation of PBMCs from 13, 24 and 23 patients respectively. Two-sided, two-way ANOVA with Sidak’s multiple comparisons test was used for (D, E). Source data are provided as a Source Data file.
Fig. 2
Fig. 2. Single-cell RNA sequencing of liver-self-antigens-specific CD4 T cells.
A total of 2768 CD154+ mCD4 T cells (648 Sepsecs-, 113 CYP2D6-, 583 PDCE2-, 273 MP65-, 798 MP1- and 353 SPIKE-specific CD4 T cells) from 7 SLA+, 3 LKM1+ and 6 M2+ patients were analyzed for transcriptome and TCR sequences at the single cell level using FB5P-seq. A UMAP representation of antigen-specific memory CD4 T cell single-cell transcriptomes, colored by non-supervised Louvain cluster identity. B UMAP representation colored by antigen reactivity. C UMAP representation colored by patient ID. D TCRαβ clonal diversity of antigen-specific single T cells for each antigen-reactivity. Numbers indicate the number of single cells analyzed with a TCRαβ sequence. Black and grey sectors indicate the proportion of TCRαβ clones (clonotype common to ≥ 2 cells) within single-cells analyzed; white sector: unique clonotypes. E Louvain cluster distribution of antigen-specific T cell clonotypes for each reactivity, as indicated. F UMAP representation of selected antigen reactivity cluster groups of memory CD4 T cells (C.ALB, H1N1, SARS-CoV-2, and auto-reactivity). G Single-cell gene expression heatmap for top 10 marker genes of cells from each antigen reactivity group defined in (F). H Dot plot representation of four selected marker genes of clusters C.ALB, H1N1, SARS-CoV-2, and auto-reactivity. Source data are provided as a Source Data file.
Fig. 3
Fig. 3. Tracking TCR clonotypes between liver biopsies and circulating CD4 T cell subsets.
A Experimental design for scRNA-seq and TCR-seq of memory PD-1+CXCR5- CD4 T cells from four distinct AILD patients. B UMAP representation of circulating memory PD-1+CXCR5- CD4 T cell transcriptomes, colored by non-supervised Louvain clustering. C Dot plot representation of top 3 marker genes of each clusters in (B). D Frequency representation (‘counts’) of each top 100 largest liver TCRβ sequences found in circulating PD-1+ mCD4 T cells. For each TCRβ sequences the cluster affiliation is indicated based on scRNA-seq and TCR-seq of memory PD-1+CXCR5- CD4 T cells. Pie chart represent the global cluster affiliation of the top 100 largest liver TCRβ sequences found in circulating PD-1+ mCD4 T cells per patient. E Left: UMAP representation of circulating memory PD-1+CXCR5- CD4 T cell transcriptomes colored by gene set score for the indicated antigen-reactivity module. Right: violin plots of gene set score distribution of cells from different Louvain clusters, as indicated. Two-sided, pairwise comparison with a paired Wilcoxon rank test. All p values are listed in the supplementary Data 9 for (E). Source data are provided as a Source Data file.
Fig. 4
Fig. 4. Single cell transcriptomic analysis of unstimulated Sepsecs-specific CD4 T cells.
A Experimental design for scRNA-seq data analysis of Sepsecs/SLA185-197 HLA-DRB1*0301 pMHCII tetramer positive cells. B Pseudocolor dot plot representation of pMHCII tetramer staining in three of six patients. Top: surface expression of CD45RA and pMHCII tetramer in CD4+ T cells. Bottom: surface expression of PD-1 and pMHCII tetramer in CD4+ CD45RA T cells (numbers indicate number of CD45RATetramer+ cells per million total CD4 and percentage). C Box plots of gene set score distribution of pMHCII tetramer negative (TTneg, n = 366) or positive (TTpos, n = 75) cells from six AIH patients for antigen reactivity modules as indicated (auto-reactivity, p = 6.4 × 10−14; H1N1, p = 0.011). Each box plot indicates a patient sample. D Box plots of gene set score distribution of pMHCII tetramer negative (TTneg) or positive (TTpos) cells for top marker genes of circulating memory PD-1+CXCR5 CD4 T cell clusters defined in Fig. 3E (Cluster 1, p = 0.51; Cluster 2, p = 1 × 10−9; Cluster 3, p = 0.37; Cluster 5, p = 0.54; Cluster 6, p = 0.64). Data are presented as mean values ± SD. Two-sided, Unpaired Mann-Whitney test was used. Source data are provided as a Source Data file.
Fig. 5
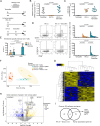
Fig. 5. Characterization of circulating PD-1+TGIT+HLA-DR+ non-TREG CD4 T cells as liver-autoreactive CD4 T cells.
A opt-SNE representation of blood memory CD4 T cell subsets, colored by non-supervised FlowSOM clustering, from 5 control non-autoimmune patients with non-alcoholic steatohepatitis (NASH), 14 AIH patients with an active disease (Active AIH), and 13 AIH patients in remission under treatment. B Differential cluster abundance between active AIH and NASH patients. C PD-1, TIGIT, and HLA-DR expression. D Surface marker heatmap of the clusters identified in (A). E Experimental design for bulk-RNA-seq after cell sorting and 24 h in vitro TCR stimulation. F Selected genes heatmap of indicated CD4 T cell subsets after or not TCR stimulation from five distinct patients (mean representation).
Fig. 6
Fig. 6. Analysis of antigen-specific CD4 T cells from the liver and the spleen of an in vivo non-TCR-transgenic mouse model.
A Experimental design for investigation of immune response against the HA antigen in the liver. HA/iCre mice received either tamoxifen treatment (n = 9), HA immunization treatment (HA i.m; n = 15), or HA immunization followed 2 weeks later by tamoxifen treatment (HA i.m + Tamoxifen; n = 12). Mice were euthanized 2 weeks after the last treatment. B Relative HA mRNA expression in the liver. ACTB was used as loading control. C Analysis of normalized anti-HA antibody rate in serum of mice. D Analysis of HA-tetramer-specific CD4 T cells in the spleen (top) and in the liver (bottom). Contour plot representation of HA tetramer staining and CD44 expression in CD4 T cells from HA i.m and HA i.m + Tamoxifen mice (left). Frequency of HA-tetramer-specific memory (CD44high) CD4 T cells per million cells (right). Dotted lines in the frequency graphs represent threshold of positive detection of HA-specific CD4 T cell population. E Analysis of PD-1 expression in detectable HA-specific memory CD4 T cells from the spleen and the liver of HA i.m and HA i.m + Tamoxifen mice. F Principal component analysis (PCA) of bulk-RNA-seq transcriptome of HA-specific CD4 T cells isolated from the liver or the spleen. G Gene expression heatmap of HA-specific CD4 T cells. H Volcano plot of gene expression change between liver and spleen HA-specific CD4 T cells. I Genes from GO enrichment pathways upregulated and shared between mouse liver HA-specific CD4 T cells and human autoreactive CD4 T cells. Data are presented as mean values ± SD in graphs (B, C, and E). Dunn’s multiple comparisons test was used for (BD). Two-sided Mann-Whitney test was used for (E). p-values and adjusted p-values (multiple comparisons) are indicated. Source data are provided as a Source Data file.
Fig. 7
Fig. 7. Immune checkpoint pathways control liver antigen-specific CD4 T cell responses and mediate hepatic tolerance.
A Experimental design for PD-1 and CTLA-4 blockade (ICI) in HA immunized tamoxifen-treated HA/iCre mice. Injection of isotype control antibodies to ICI was used as control (ISO). B Histological liver inflammation scoring analysis of liver tissue sections from immunized tamoxifen-treated control (Ctrl; n = 8) and HA/iCre (n = 16) mice treated either with isotype control antibodies (+ISO; Ctrl: n = 4, HA/iCre: n = 8) or anti-PD-1 and anti-CTLA-4 blocking antibodies (+ICI; Ctrl: n = 4, HA/iCre: n = 8). C Representative pictures of paraffin-embedded liver sections stained with HPS coloration from indicated conditions. Black line is used as scale. D Experimental design for CD4 depletion (αCD4 abs) in immunized tamoxifen-treated HA/iCre mice receiving PD-1 and CTLA-4 blockade protocol (n = 13). Injection of isotype control antibody to αCD4 abs was used as control (ISO; n = 8). E Analysis of normalized anti-HA antibody rate in serum of mice. F Histological liver inflammation scoring analysis of liver tissue sections. G Representative pictures of paraffin-embedded liver sections stained with HPS coloration from indicated conditions. Black line is used as scale. H Pseudocolor dot plot representation of HA tetramer staining and CD44 expression in CD8 T cells from spleen (top) and liver (bottom) of ISO (n = 5) and αCD4 abs (n = 4) mice (left). Frequency of HA tetramer-specific memory (CD44high) CD8 T cells per million cells (right). Data are presented as mean values ± SD in graphs (B, E, F, and H). Two-sided Mann-Whitney test was used for (B, E, F, and H). p-values are indicated. Source data are provided as a Source Data file.

References

    1. Poch, T. et al. Single-cell atlas of hepatic T cells reveals expansion of liver-resident naive-like CD4+ T cells in primary sclerosing cholangitis. J. Hepatol.75, 414–423 (2021). - PMC - PubMed
    1. Zimmer, C. L. et al. A biliary immune landscape map of primary sclerosing cholangitis reveals a dominant network of neutrophils and tissue-resident T cells. Sci. Transl. Med.13, eabb3107 (2021). - PubMed
    1. Andrews, T. S. et al. Single-cell, single-nucleus, and spatial transcriptomics characterization of the immunological landscape in the healthy and PSC human liver. J. Hepatol.80, 730–743 (2024). - PubMed
    1. Webb, G. J., Hirschfield, G. M., Krawitt, E. L. & Gershwin, M. E. Cellular and molecular mechanisms of autoimmune hepatitis. Annu. Rev. Pathol. Mech. Dis.13, 247–292 (2018). - PubMed
    1. European Association for the Study of the Liver. EASL clinical practice guidelines: autoimmune hepatitis. J. Hepatol.63, 971–1004 (2015). - PubMed

MeSH terms