. 2025 Jan 29;16(1):1145.
doi: 10.1038/s41467-025-56470-0.

Sucrose-preferring gut microbes prevent host obesity by producing exopolysaccharides

Affiliations

Sucrose-preferring gut microbes prevent host obesity by producing exopolysaccharides

Hidenori Shimizu et al. Nat Commun. .

Abstract

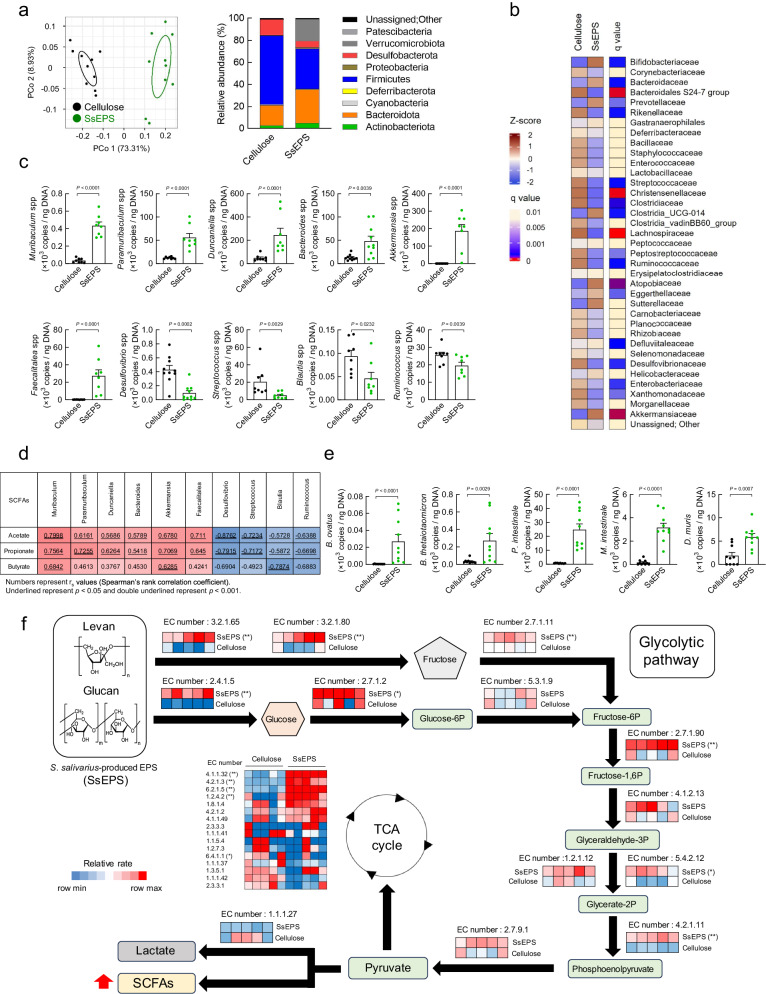
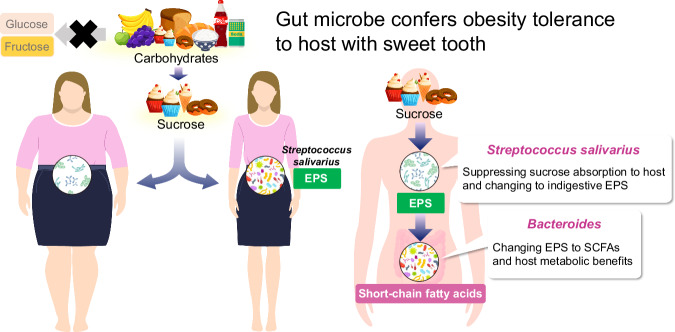
Commensal bacteria affect host health by producing various metabolites from dietary carbohydrates via bacterial glycometabolism; however, the underlying mechanism of action remains unclear. Here, we identified Streptococcus salivarius as a unique anti-obesity commensal bacterium. We found that S. salivarius may prevent host obesity caused by excess sucrose intake via the exopolysaccharide (EPS) -short-chain fatty acid (SCFA) -carbohydrate metabolic axis in male mice. Healthy human donor-derived S. salivarius produced high EPS levels from sucrose but not from other sugars. S. salivarius abundance was significantly decreased in human donors with obesity compared with that in healthy donors, and the EPS-SCFA bacterial carbohydrate metabolic process was attenuated. Our findings reveal an important mechanism by which host-commensal interactions in glycometabolism affect energy regulation, suggesting an approach for preventing lifestyle-related diseases via prebiotics and probiotics by targeting bacteria and EPS metabolites.


Conflict of interest statement

Competing interests: H.S., K.H., and D.S. are employees of Noster Inc. The other authors declare no competing interests.

Figures

Fig. 1
Fig. 1. Isolation and characterisation of exopolysaccharide (EPS)-producing human commensal bacterium S. salivarius.
a High-EPS-producing bacteria using ropy bacterial colonies as an indicator in human and mouse faeces cultured in MRS medium containing 15% fructose, galactose, glucose, lactose, maltose, and sucrose. Red arrowheads indicate EPS production. b Types of EPS-producing bacteria isolated from 47 human faecal samples. c Correlation between high-EPS-producing bacterial abundance in human faeces and donor body mass index (BMI). (n = 132, 48 independent experiments). Two-tailed Mann–Whitney U test was used for the statistical analysis. d Structural characterisation was performed using proton nuclear magnetic resonance (1H NMR) spectroscopy. e Growth curves of EPS biosynthesis and optical density at 600 nm (OD600) (n = 3 independent experiments). f, g The KEGG pathway enrichment of EPS synthesis pathways and expression of putative levansucrase and glycosyltransferases mRNAs in MRS medium containing sucrose or glucose during bacterial culture for 10 h were determined using RNA-seq (n = 4 independent experiments). h Expression of putative levansucrase and glycosyltransferases mRNAs in MRS medium containing sucrose or glucose during bacterial culture for 10 h was measured using RT-qPCR (n = 4 independent experiments). Two-tailed Mann–Whitney U test was used for the statistical analysis. Results are presented as the mean ± standard error of the mean (SE). Source data are provided as a Source Data file.
Fig. 2
Fig. 2. Gut microbial analysis in human faeces.
a Spearman’s rank correlation between faecal levels of total short-chain fatty acids (SCFAs) such as acetate, propionate, and butyrate, exopolysaccharides (EPS) and donor body mass index (BMI) in human faeces (n = 132, 48 independent experiments). Two-tailed Mann–Whitney U test was used for the statistical analysis. b Results of correlation analysis among EPS hydrolase, glycolysis, and SCFA production between lean donors and donors with obesity (n = 26 independent experiments). c Comparison of polysaccharide synthesis, polysaccharide decomposition, glycolytic pathway enrichment, and SCFA synthesis between lean donors and donors with obesity in shotgun metagenomic sequencing analysis (n = 26 independent experiments). ***P < 0.001, **P < 0.01, *P < 0.05 Two-tailed Mann–Whitney U test was used for the statistical analysis. Results are presented as the mean ± standard error of the mean (SE). Source data are provided as a Source Data file.
Fig. 3
Fig. 3. Metabolic improvement effect of SsEPS intake on high-fat diet (HFD)-induced obesity.
a Bacterial SCFA levels in the culture supernatants of each gut bacterium (n = 6 independent experiments). **P < 0.01. Two-tailed Mann–Whitney U test was used for the statistical analysis. be C57BL/6J and Gpr41Gpr43 double-deficient mice were fed an HFD supplemented with 10% cellulose or SsEPS for 12 weeks. Faecal and plasma SCFA levels were measured using GC-MS (b), changes in body and tissue weight (c) Epi, epididymal; peri, perirenal; sub, subcutaneous; WAT, white adipose tissue. (n = 9, 10 independent experiments). **P < 0.01, *P < 0.05. Two-tailed Mann–Whitney U test was used for the statistical analysis. Blood glucose, plasma non-esterified fatty acid (NEFAs) (d), GLP-1 (e), and PYY levels (f) were measured at the end of the experimental period (n = 9, 10 independent experiments). Two-tailed Mann–Whitney U test was used for the statistical analysis. NS, not significant. g Daily food intake at 12 weeks of age (n = 5 independent experiments). Two-tailed Mann–Whitney U test was used for the statistical analysis. h Expression of Ucp 1 mRNA (n = 10 independent experiments) was measured by RT-qPCR in subcutaneous WAT. Two-tailed Mann–Whitney U test was used for the statistical analysis. i, j Following 24 h of fasting, the mice were fed 0.2 g AIN-93G, containing 50% cellulose or 50% SsEPS, and an intraperitoneal glucose tolerance test was performed 1 h after feeding. Wild-type (n = 10 independent experiments), Gpr41Gpr43 double-deficient (n = 7, 8 independent experiments), ICR (n = 8, 9 independent experiments), and GF-ICR (n = 8 independent experiments) mice were used. **P < 0.01, *P < 0.05 (Mann–Whitney U test). Plasma insulin levels were measured 15 min after intraperitoneal glucose administration. Wild-type (n = 8, 9 independent experiments), Gpr41Gpr43 double-deficient (n = 7, 8 independent experiments), ICR and GF-ICR (n = 8 independent experiments) mice were used. Dunn’s post-hoc test was used for the statistical analysis. Results are presented as means ± standard error of the mean (SE). Source data are provided as a Source Data file.
Fig. 4
Fig. 4. Identification of gut bacterial SCFAs production pathway by SsEPS intake.
Gut microbial composition was evaluated to perform principal coordinate analysis and determine the relative abundance at the phylum level (a), with a heatmap of the bacterial domain at the family level (b) and genus level (c) (n = 10 independent experiments). Two-tailed Mann–Whitney U test was used for the statistical analysis. d Spearman’s rank correlation between the levels of the main contributing bacterial genera and faecal short-chain fatty acids (SCFAs) in high-fat diet (HFD)-fed mice supplemented with cellulose versus HFD-fed mice supplemented with SsEPS. e SsEPS-utilising Bacteroides and Bacteroidales S24-7 group species were detected by qPCR (n = 10 independent experiments). Two-tailed Mann–Whitney U test was used for the statistical analysis. f EPS degradation, SCFA synthesis, and glycolysis pathways were compared between cellulose- and SsEPS-fed mice in shotgun metagenomic sequencing analysis (n = 5 independent experiments). Two-tailed Mann–Whitney U test was used for the statistical analysis. Results are presented as means ± standard error of the mean (SE). Source data are provided as a Source Data file.
Fig. 5
Fig. 5. Improvement of sucrose-induced metabolic function in S. salivarius colonised mice.
Germ-free (GF) and colonised mice were generated and consumed sterilised water containing 20% sucrose. a Faecal EPS was measured by HPLC (n = 10, 10, 8, 10, 10, 8 independent experiments). Dunn’s post-hoc test was used statistical analysis. b Faecal SCFA levels were measured by GC/MS (n = 10, 9, 8, 10, 10, 8 independent experiments). Dunn’s post-hoc test was used for the statistical analysis. c After colonisation, an intraperitoneal GTT was performed (n = 8, 7, 10, 9, 6, 6 independent experiments). Dunn’s post-hoc test was used for the statistical analysis. d Plasma insulin (left; n = 8, 9, 10, 7, 9, 7, 7 independent experiments) and GLP-1 (right; n = 7, 8, 8, 7, 9, 7, 7 independent experiments) levels were measured 15 min after intraperitoneal glucose administration Dunn’s post-hoc test was used for the statistical analysis. ek After colonisation, the mice were fed an AIN-93G diet or high-fat diet (HFD) for 9 weeks. e Experimental scheme for the gnotobiotic analysis. Changes in body and tissue weights (f) and blood glucose (g) (n = 10, 10, 8, 8, 8, 8 independent experiments) under an AIN-93G diet feeding with 20% sucrose drinking water. **P < 0.01, * P < 0.05, compared between Bo+Bt and Ss+Bo+Bt mice. ## P < 0.01, # P < 0.05, compared between Ss+Bo+Bt and Ss (Mut)+Bo+Bt mice. Dunn’s post-hoc test was used for the statistical analysis. h Plasma GLP-1 (n = 7, 7, 8, 8, 8, 8 independent experiments) levels were measured at the end of the experimental period. Dunn’s post-hoc test was used for the statistical analysis. Changes in body and tissue weights under HFD feeding (i), blood glucose ( j ) and plasma GLP-1 and insulin (k) levels were measured at the end of the experimental period (n = 5, 8, 8, 9, 9 independent experiments). Dunn’s post-hoc test was used for the statistical analysis. Results are presented as means ± standard error of the mean (SE). Source data are provided as a Source Data file.
Fig. 6
Fig. 6. Improvement of sucrose-induced metabolic function in S. salivarius dominant human gut microbiota culture-colonised mice.
ah S. salivarius-dominant [Ss (+)] or -nondominant human gut microbiota culture colonised [Ss (-)] mice were generated from GF mice through transplantation with human faecal culture solution and fed a high-fat diet supplemented with sugars (sucrose, glucose, or fructose). a Experimental scheme for faecal microbiota transplantation experiment. Faecal total SCFAs (b) and EPS (c) were measured by GC/MS and HPLC. (n = 7, 7, 5, 7, 5, 7 independent experiments). Two-tailed Mann–Whitney U test was used for the statistical analysis. d Faecal S. salivarius, B. ovatus, and B. thetaiotaomicron were detected by qPCR (n = 7, 7, 5, 7, 5, 7 independent experiments). Two-tailed Mann–Whitney U test was used for the statistical analysis. e, f Changes in body and tissue weight (n = 7, 7, 5, 7, 5, 7 independent experiments). Two-tailed Mann–Whitney U test was used for the statistical analysis. Blood glucose (g) and plasma GLP-1 (h) levels were measured at the end of the experimental period (n = 7, 7, 5, 7, 5, 7 independent experiments). Two-tailed Mann–Whitney U test was used for the statistical analysis. Results are presented as means ± standard error of the mean (SE). Source data are provided as a Source Data file.
Fig. 7
Fig. 7. Schematic representation. Sucrose-preferring gut microbes prevent host obesity by producing exopolysaccharides.
Gut microbes prevent host obesity through excess dietary sucrose intake via the exopolysaccharide (EPS)–short-chain fatty acid (SCFA)–carbohydrate metabolism axis and identified S. salivarius as a unique anti-obesity commensal bacterium.

References

    1. Kahn, S. E., Hull, R. L. & Utzschneider, K. M. Mechanisms linking obesity to insulin resistance and type 2 diabetes. Nature444, 840–846 (2006). - PubMed
    1. Zimmet, P., Alberti, K. G. & Shaw, J. Global and societal implications of the diabetes epidemic. Nature414, 782–787 (2001). - PubMed
    1. Cori, C. F. Mammalian carbohydrate metabolism. Physiol. Rev.11, 144–275 (1931).
    1. Tappy, L. & Lê, K. A. Metabolic effects of fructose and the worldwide increase in obesity. Physiol. Rev.90, 23–46 (2010). - PubMed
    1. Flint, H. J., Bayer, E. A., Rincon, M. T., Lamed, R. & White, B. A. Polysaccharide utilization by gut bacteria: potential for new insights from genomic analysis. Nat. Rev. Microbiol.6, 121–131 (2008). - PubMed