. 2025 Jan 29;16(1):1156.
doi: 10.1038/s41467-025-56441-5.

Gemistocytic tumor cells programmed for glial scarring characterize T cell confinement in IDH-mutant astrocytoma

Affiliations

Gemistocytic tumor cells programmed for glial scarring characterize T cell confinement in IDH-mutant astrocytoma

Levi van Hijfte et al. Nat Commun. .

Abstract

Isocitrate dehydrogenase 1/2 mutant (IDHmt) astrocytoma is considered a T cell-deprived tumor, yet little is known regarding the phenotypes underlying T cell exclusion. Using bulk, single nucleus and spatial RNA and protein profiling, we demonstrate that a distinct spatial organization underlies T cell confinement to the perivascular space (T cell cuff) in IDHmt astrocytoma. T cell cuffs are uniquely characterized by a high abundance of gemistocytic tumor cells (GTC) in the surrounding stroma. Integrative analysis shows that GTC-high tumors are enriched for lymphocytes and tumor associated macrophages (TAM) and express immune cell migration and activation programs. Specifically, GTCs constitute a distinct sub-cluster of the astrocyte-like tumor cell state that co-localizes with immune reactive TAMs. Neighboring GTCs and TAMs express receptor-ligand pairs characteristic of reactive astrogliosis and glial scarring, such as SPP1/CD44 and IL-1β/IL1R1. Collectively, we reveal that T cell confinement in IDHmt astrocytomas associates with GTC-TAM networks that mimic glial scarring mechanisms.


Conflict of interest statement

Competing interests: The authors declare no competing interests.

Figures

Fig. 1
Fig. 1. T cell distributions show distinct spatial tissue phenotypes in IDHmt astrocytoma.
a Flowchart of study setup and methods. b Venn diagram of the sample n for each analysis modality. c Heatmap of log-transformed cell counts and inter-cell distance z-scores (n = 1293 ROIs; n = 75 samples). Columns are ordered by ROI T cell count, top annotations show patient and ROI characteristics. For distance data, blue indicates a negative z-score and higher cell clustering than expected. Red indicates a positive z-score and higher cell dispersion than expected. d Representative images from multiplex IF stainings of three tissue phenotypes based on T cell quantity and location; T cells in the perivascular space (T cell cuff), T cells in the stroma and T cells absent regions. e Representative IF image of CD3 (T cells) and LAMA2 (parenchymal basement membrane) for a T cell cuff. f Cell distance to nearest CD31+ vessel structure. The red area indicates the median cuff radius of T cell cuffs containing three or more T cells. Kolmogorov–Smirnov test, two-sided (n = 11; p < 2.2 × 10−16). g Area-adjusted T cell counts for cuff area and stromal area. Wilcoxon rank sum test, two-sided (n = 13; p = 0.0002). h Count values for all cell subsets separated for ROI tissue phenotype (n = 667 T cells absent, n = 184 T cells PS, n = 359 T cells in S). Wilcoxon rank sum test, two-sided, fdr corrected (p values from top to bottom per header: Total cells: 2.57 × 10⁻⁸, 3.38 × 10⁻¹⁵; Tumor cells: 0.021; TAMs: 3.55 × 10⁻¹⁰, 1.23 × 10⁻²¹; CD4 T cells: 5.09 × 10⁻¹²², 1.62 × 10⁻¹², 2.90 × 10⁻¹⁶⁷; CD8 T cells: 2.44 × 10⁻¹⁰⁴, 5.13 × 10⁻¹², 1.99 × 10⁻⁸⁹; B cells: 1.54 × 10⁻⁵¹, 9.41 × 10⁻²¹, 3.68 × 10⁻⁷). i Inter-cell distance z-scores for immune cell subsets in tissue phenotypes. Boxplots display distance between cell types indicated in the plot title (from) and x-axis annotations (to). Wilcoxon rank sum test, two-sided, fdr corrected (n for all ROI groups are shown in Supplementary Data 15; p values from left to right per header: B cell: 2.53 × 10⁻¹⁰, 8.81 × 10⁻²⁵, 4.68 × 10⁻²⁵, 0.0011; CD8 T cell: 2.50 × 10⁻⁹, 1.23 × 10⁻²⁴, 2.98 × 10⁻⁵⁰, 0.0972; CD4 T cell: 2.21 × 10⁻⁵, 2.40 × 10⁻⁷⁸, 2.19×10⁻¹¹, 0.1477; TAM: 7.55 × 10⁻⁵, 9.29 × 10⁻³⁹, 8.11 × 10⁻¹⁶, 1.96 × 10⁻⁶). Scale bars in (d, e) show 100 µm. S stroma, PS perivascular space, TAM tumor associated macrophage, ROI region of interest, CNV copy number variation, ns not significant. Boxplots in (gi) show the hinges at the first and third quartiles with the median as the center. The whiskers show min and max value until 1.5 times the interquartile range.
Fig. 2
Fig. 2. Gemistocytic tumor cells are localized in tumor stroma surrounding T cell cuffs and associate with the accumulation of immune cells.
a Representative images of IDH1-R132H and H&E staining of the stroma surrounding a T cell cuff. Insets show gemistocytes that stain positive for the IDH1-R132H mutation. b Electron microscopy images of a gemistocytic tumor cell (GTC; left, magnification = 6000) and a magnification of the insert (right, magnification = 25.000). c ROI (immune) cell quantities separated by GTC scores (n = 494 −, n = 216 +, n = 122 ++, n = 127 +++). Wilcoxon rank sum test, two-sided, fdr corrected (p values from top to bottom per header: Total cells: 1.16 × 10⁻¹⁰, 5.57 × 10⁻⁷, 1.16 × 10⁻¹⁰; Tumor cells: 0.0003, 0.0115, 0.0011; TAMs: 0.0193, 4.30 × 10⁻⁵, 4.00 × 10⁻¹², 2.22 × 10⁻⁷, 2.46 × 10⁻⁵; CD4 T cells: 0.0046, 9.90 × 10⁻⁷, 3.63 × 10⁻¹⁵, 1.80 × 10⁻⁴², 1.09 × 10⁻²⁸, 1.09 × 10⁻¹⁷; CD8 T cells: 0.006, 6.86 × 10⁻⁶, 2.38 × 10⁻²², 2.11 × 10⁻¹⁶, 8.73 × 10⁻¹⁰; B cells: 9.00 × 10⁻⁵, 2.26 × 10⁻⁷, 4.69 × 10⁻¹⁶, 1.16 × 10⁻¹⁰). Four bins were used to separate GTC quantity (Supplementary Fig. 5a). d Fractions of GTC ROI scores for the three spatial T cell phenotypes (n = 560 T cells absent, n = 144 T cells PS, n = 255 T cells in S). e Faction T cell cuff size for GTC scores (n = 494 -, n = 216 +, n = 122 ++, n = 127 +++). f Volcano plot of the differential gene expression test between GTC-high (n = 39; positive log2fc) and GTC-low (n = 118; negative log2fc) tumors from bulk RNA sequencing. Colors indicate marker genes for T cells and TAMs. Wald test, two-sided, fdr corrected. Lines indicate fdr-adjusted p-value and log2FoldChange cutoffs. g Gene set enrichment analysis for the differentially expressed genes from (f) between GTC-low (negative z-score) and GTC-high (positive z-score) samples. Fisher’s Exact Test, right-tailed. Scale bars in (a) show 100 µm. Scale bars in (b) show 4 µm (left) and 1 µm (right). S stroma, PS perivascular space, TAM tumor associated macrophage, GTC gemistocytic tumor cell, ROI region of interest. All GTC quantities were evaluated by three independent reviewers. Boxplots in (c) show the hinges at the first and third quartiles with the median as the center. The whiskers show min and max value until 1.5 times the interquartile range.
Fig. 3
Fig. 3. Gemistocytic tumor cells represent a transcriptionally distinct sub-population that expresses reactive astrogliosis markers.
UMAP of all cells (a; n = 65,129) and tumor cells (b; n = 42,011) for integrated snRNA-seq glioma samples (n = 7). Estimated transcriptional tumor cell states from Supplementary Fig. 6c are indicated. c Expression of bulk GTC DE genes in tumor cell clusters from (b). d Enrichment scores for bulk GTC DE genes and astrocyte-like tumor cell state markers in tumor cells from snRNA-seq data. e Log2-fold change of reactive astrogliosis markers between GTC-high and low samples in bulk RNA-seq data. Wald test, two-sided, fdr corrected. f Reactive astrogliosis marker expression in transcriptional tumor cell subpopulations from snRNA-seq data. g Differential protein presence in GTC-low (n = 53; negative log2FoldChange) and GTC-high (n = 7; positive log2FoldChange) ROIs from the NanoString GeoMx DSP proteomics data. Wald test, two-sided, fdr corrected. GTC: gemistocytic tumor cell; padj: adjusted p value; avg: average.
Fig. 4
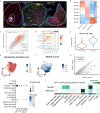
Fig. 4. Gemistocytic tumor cells co-localize with immune-reactive TAMs.
a Examples of ROIs with annotations from the NanoString GeoMx spatial transcriptomics data. For ROIs annotated as T cells in perivascular space, only stroma was selected, circumventing the T cell cuff. b Heatmap showing correlation of selected gene modules from (Supplementary Fig. 7d) with ROI annotation for tissue phenotype. Pearson’s r was used to determine correlation (n = 25 T cells in PS; n = 16 T cells in S; n = 27 T cells absent). c Comparison between the gene significance scores for T cells in perivascular space and GTC ROI annotations. Colors indicate genes assigned to gene modules from b. Pearson’s r, correlation t-test. d Enrichment scores of spatial gene modules from b in snRNA-seq cell populations. UMAP of TAMs depicting the difference in enrichment scores between monocyte derived macrophage (MDM) and microglia markers (e) and enrichment scores for gene module 3 (f). Blue indicates the MDM profile and red the microglia profile (n = 10,775). g Violin plot of enrichment scores for microglia and MDM markers in module 3-high TAMs. h Comparison of average gene expression for Module 3 positive- and negative TAMs, split according to Module 3 enrichment score (Supplementary Fig. 7g). i Expression of reactive astrogliosis signaling molecules in snRNA-seq cell populations. j Cell-cell communication inference of SPP1-CD44 signaling in the snRNA-seq data. Green indicates the centrality score. Scale bars in a indicate 100 µm. S: stroma; PS: perivascular space; TAM: tumor associated macrophage; GTC: gemistocytic tumor cell; avg. expr: average expression.
Fig. 5
Fig. 5. CD44-positive gemistocytic tumor cells form a network with immune-reactive TAMs that phenotypically characterizes the stroma surrounding T cell cuffs in IDHmt astrocytoma.
Correlation between average expression of snRNA-seq derived marker genes for GTCs and module-3 TAMs in bulk (a; n = 169) and spatial transcritptomics data (b; n = 68). Spearman’s rho, correlation t-test. Examples of CD44 (c) and CRYAB (d) stainings with matching HE stainings of the same tissue slide. e Cell proportions for multiplex panels for GTC-high (n = 8) and GTC-low (n = 6) IDHmt astrocytoma samples. f CRYAB+ cell quantification in GTC-high (n = 15) and GTC-low (n = 15) IDHmt astrocytoma samples. Wilcoxon rank sum test, two-sided (p = 0.00524). g Inter-cell distance z-scores between cell types indicated in plot title (from) and cell type indicated in x-axis label (to) in GTC-high (n = 8) and GTC-low (n = 6) IDHmt astrocytoma samples. Wilcoxon rank sum test, two-sided, fdr corrected (p = 0.0047). h Workflow depicting CD44 density calculation and allocation of cells to CD44 bins in whole tumor sections. ik Integrative analysis of two IF stainings (CD44/CD3 and CD68/CD3, left and right column, respectively) on consecutive sections of tumor samples (n = 8 GTC high, n = 6 GTC low). Detected cells from all samples were pooled and separated into 20 bins based on the adjusted CD44 density value at their tissue x/y coordinates. i Bar plot of the 20 equal-sized cell bins. The bars represent cell fractions from GTC-high (red) and GTC-low (blue) samples. j Average adjusted CD44 density per bin. k T cell (left) and TAM (right) proportion per bin for GTC-high (top) and GTC-low samples (bottom). GTC gemistocytic tumor cell. Scale bars in (c, d) indicate 50 µm. Scale bars in (h) indicate 2 mm. a, b show error bounds of ±SEM. Boxplots in (f, g) show the hinges at the first and third quartiles with the median as the center. The whiskers show min and max value until 1.5 times the interquartile range.

References

    1. Reardon, D. A. et al. Effect of Nivolumab vs Bevacizumab in patients with recurrent glioblastoma: the CheckMate 143 Phase 3 randomized clinical trial. JAMA Oncol.6, 1003–1010 (2020). - PMC - PubMed
    1. Omuro, A. et al. Radiotherapy combined with nivolumab or temozolomide for newly diagnosed glioblastoma with unmethylated MGMT promoter: an international randomized phase III trial. NeuroOncology25, 123–134 (2023). - PMC - PubMed
    1. Lim, M. et al. Phase III trial of chemoradiotherapy with temozolomide plus nivolumab or placebo for newly diagnosed glioblastoma with methylated MGMT promoter. NeuroOncology24, 1935–1949 (2022). - PMC - PubMed
    1. Wu, T. D. et al. Peripheral T cell expansion predicts tumour infiltration and clinical response. Nature579, 274–278 (2020). - PubMed
    1. Klemm, F. et al. Interrogation of the microenvironmental landscape in brain tumors reveals disease-specific alterations of immune cells. Cell181, 1643–1660.e1617 (2020). - PMC - PubMed

MeSH terms

LinkOut - more resources