. 2025 Jan 29;16(1):1153.
doi: 10.1038/s41467-025-56229-7.

Molecular and pharmacological heterogeneity of ETV6::RUNX1 acute lymphoblastic leukemia

Affiliations

Molecular and pharmacological heterogeneity of ETV6::RUNX1 acute lymphoblastic leukemia

Zhenhua Li et al. Nat Commun. .

Abstract

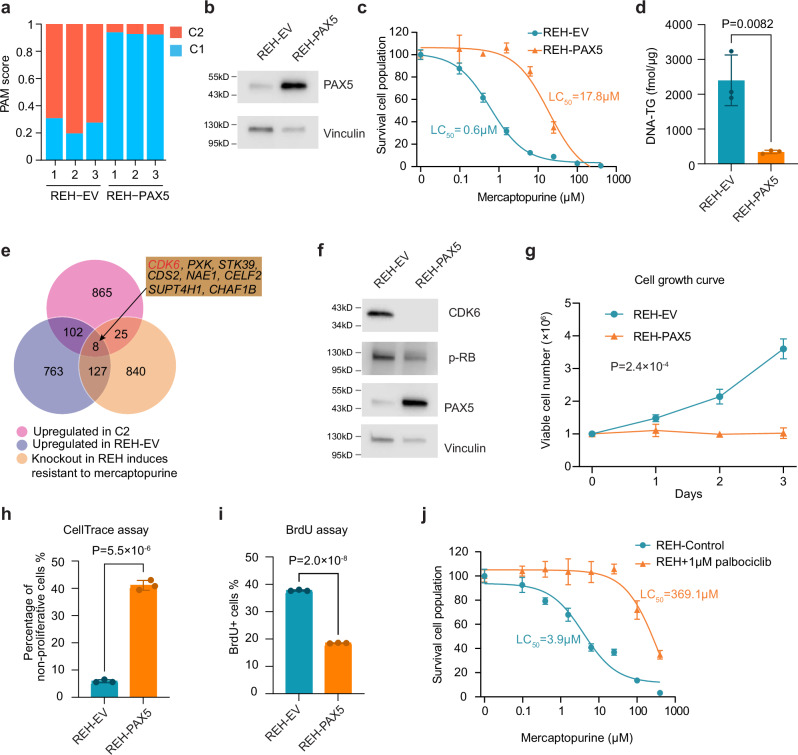
ETV6::RUNX1 is the most common fusion gene in childhood acute lymphoblastic leukemia (ALL) associated with favorable prognosis, but the optimal therapy for this subtype remains unclear. Profiling the genomic and pharmacological landscape of 194 pediatric ETV6::RUNX1 ALL cases, we uncover two transcriptomic clusters, C1 (61%) and C2 (39%). Compared to C1, the C2 subtype features higher white blood cell counts and younger age at diagnosis, as well as better early treatment responses. Pharmacologically, C2 is more sensitive to thiopurines and prednisolone, partially explained by the enrichment of PAX5 deletions. Re-introducing PAX5 in ETV6::RUNX1 ALL of the C2 subtype converts its gene expression and drug resistance profile to C1, with partial blockade of G1 to S transition mediated by CDK6 expression. Our results point to molecular heterogeneity within ETV6::RUNX1 ALL linked to divergent drug responses, providing insights into the pathogenesis and therapeutic vulnerability of this common pediatric ALL subtype.


Conflict of interest statement

Competing interests: The authors declare no competing interests.

Figures

Fig. 1
Fig. 1. Distinct subtypes within ETV6::RUNX1 ALL.
a UMAP dimension reduction of the gene expression signature of the primary discovery cohort based on 252 genes identified using non-negative matrix factorization. b, c Comparison of b the age group and c the presenting white blood cell (WBC) count between the two subtypes in the primary discovery cohort. d UMAP of the validation cohort based on 122 genes identified independently on the validation cohort using non-negative matrix factorization. e, f Comparison of e the age group and f the presenting WBC between the two subtypes in the validation cohort. In b, c, e, f association between categorical variables are tested using Chi-squared test. Source data are provided as a Source Data file.
Fig. 2
Fig. 2. Signature of B cell differentiation of ETV6::RUNX1 ALL subtypes.
a Gene set enrichment analysis comparing the C2 versus C1 using the Kyoto Encyclopedia of Genes and Genomes (KEGG) pathway and WikiPathways (WP) databases. Pathways with adjusted P < 0.001 are shown. The significance of a pathway is tested by permutation and corrected for multiple testing using the Benjamini–Hochberg procedure. b Percentages of cells in different B cell differentiation stages using gene expression-based deconvolution analysis. Only stages along the B cell differentiation are included. c Comparison of the deconvoluted percentages of HSC-like, pre-pro-B-like, and pro-B-like cells between the two ETV6::RUNX1 subtypes. Difference between the two subtypes is tested using the two-sided Mann–Whitney U test. Center line, median; box limits, upper and lower quartiles; whiskers, 1.5× interquartile range; points, outliers. HSC-like, hematopoietic stem cell-like; CLP-like, common lymphoid progenitor-like. Source data are provided as a Source Data file.
Fig. 3
Fig. 3. Treatment responses of ETV6::RUNX1 subtypes.
a, b Comparison of the a day 15 and b end-of-induction (EOI) minimal residual disease (MRD) between the C1 and C2 cases. Horizontal dashed lines separate cases with positive and negative MRD. A small random value is added to negative MRD (<0.01%) values for visualization. c Comparison of the ex vivo drug response to 20 therapeutic agents. Red dashed line indicate Bonferroni corrected P = 0.05. d Mercaptopurine, thioguanine and prednisolone were more resistant in C1 compared to C2. Red horizontal bars indicate median values. In all panels, difference between the two subtypes is compared using two-sided Mann–Whitney U test. Source data are provided as a Source Data file.
Fig. 4
Fig. 4. Genomic alterations of the two ETV6::RUNX1 ALL subtypes.
a Somatic single-nucleotide variant (SNV), short indels, and focal copy number alterations. Only genes altered in at least 10 cases are shown. b Positions of the PAX5 deletions. c Recurrent aneuploidies identified by RNA-Seq, and compared between the two subtypes using Chi-squared test. d, e Distribution of the burden of SNVs separated by mutation signatures of d C1 and e C2 cases. f Violin plots comparing the burden of SBS2 and SBS13 between C1 and C2 subtypes. Red horizontal bars indicate median values. Difference between the two subtypes is tested using the two-sided Mann–Whitney U test. Source data are provided as a Source Data file.
Fig. 5
Fig. 5. Ectopic expression of PAX5 in the REH cell line of the C2 subtype conferred resistance to mercaptopurine.
a PAM score to predict the C1/C2 subtype identity using the gene expression profiles showed the switch from C2 to C1 after overexpression of PAX5 in REH cells. b PAX5 protein is overexpressed in REH-PAX5 cells. Results are representative of three independent experiments. c REH-PAX5 cells demonstrated resistance to mercaptopurine when compared to REH-EV cells. Data are presented as mean ± SD for three biological replicates and results are representative of three independent experiments. d DNA-TG incorporation was significantly reduced in REH-PAX5 cells. Data are presented as mean ± SD for three biological replicates. Comparisons are performed using a two-sided t-test. e Venn diagram showing the overlap among the top 1000 genes that demonstrated resistance to mercaptopurine upon knockout and the top 1000 genes that are upregulated in C2 (compared to C1) and REH-PAX5 (compared to REH-EV). f CDK6 protein and pRB are reduced in REH-PAX5 cells. Results are representative of two independent experiments. g REH-PAX5 cells demonstrated a significantly slower growth rate compared to REH-EV. Data are presented as mean ± SD for three biological replicates and results are representative of three independent experiments. P-value is by linear regression adjusted for days of culturing. h Percentage of non-proliferative cells by CellTrace assay is significantly higher in REH-PAX5 cells. Data are presented as mean ± SD for three biological replicates and comparisons are performed using a two-sided t-test. i Percentage of BrdU+ cells is significantly lower in REH-PAX5 cells. Data are presented as mean ± SD for three biological replicates and comparisons are performed using a two-sided t-test. j REH cells pre-treated with palbociclib demonstrated mercaptopurine resistance. Data are presented as mean ± SD for three biological replicates. Error bars indicate standard deviations. EV, empty vector. Source data are provided as a Source Data file.

References

    1. Mullighan, C. G. The molecular genetic makeup of acute lymphoblastic leukemia. Hematol. Am. Soc. Hematol. Educ. Program10.1182/asheducation-2012.1.389 (2012). - PubMed
    1. Brady, S. W. et al. The genomic landscape of pediatric acute lymphoblastic leukemia. Nat. Genet.54, 1376–1389 (2022). - PMC - PubMed
    1. Lee, S. H. R. et al. Association of genetic ancestry with the molecular subtypes and prognosis of childhood acute lymphoblastic leukemia. JAMA Oncol.8, 354–363 (2022). - PMC - PubMed
    1. Bhojwani, D. et al. ETV6-RUNX1-positive childhood acute lymphoblastic leukemia: improved outcome with contemporary therapy. Leukemia26, 265–270 (2012). - PMC - PubMed
    1. Mattano, L. A. Jr. et al. Favorable trisomies and ETV6-RUNX1 predict cure in low-risk B-cell acute lymphoblastic leukemia: results from children’s oncology group trial AALL0331. J. Clin. Oncol.39, 1540–1552 (2021). - PMC - PubMed

MeSH terms

LinkOut - more resources