. 2025 Jan 29;16(1):1160.
doi: 10.1038/s41467-025-56494-6.

VSTM2L protects prostate cancer cells against ferroptosis via inhibiting VDAC1 oligomerization and maintaining mitochondria homeostasis

Affiliations

VSTM2L protects prostate cancer cells against ferroptosis via inhibiting VDAC1 oligomerization and maintaining mitochondria homeostasis

Juan Yang et al. Nat Commun. .

Abstract

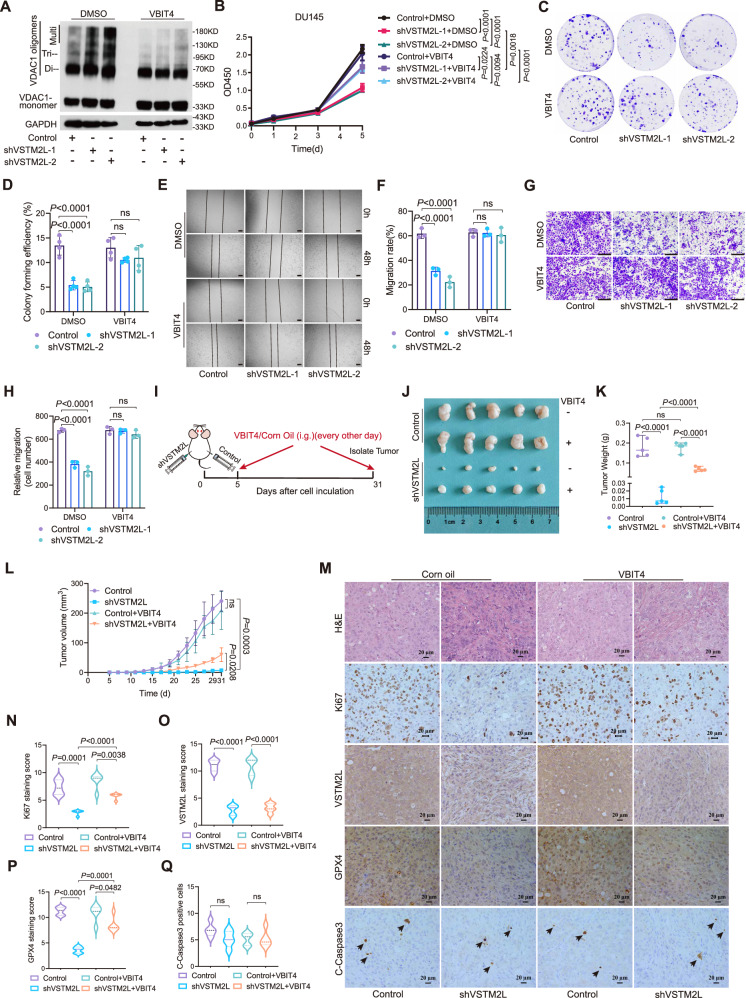
Ferroptosis is a form of iron-dependent programmed cell death, which is distinct from apoptosis, necrosis, and autophagy. Mitochondria play a critical role in initiating and amplifying ferroptosis in cancer cells. Voltage-Dependent Anion Channel 1 (VDAC1) embedded in the mitochondrial outer membrane, exerts roles in regulation of ferroptosis. However, the mechanisms of VDAC1 oligomerization in regulating ferroptosis are not well elucidated. Here, we identify that a VDAC1 binding protein V-Set and Transmembrane Domain Containing 2 Like (VSTM2L), mainly localized to mitochondria, is positively associated with prostate cancer (PCa) progression, and a key regulator of ferroptosis. Moreover, VSTM2L knockdown in PCa cells enhances the sensitivity of RSL3-induced ferroptosis. Mechanistically, VSTM2L forms complex with VDAC1 and hexokinase 2 (HK2), enhancing their binding affinity and preventing VDAC1 oligomerization, thereby inhibiting ferroptosis and maintaining mitochondria homeostasis in vitro and in vivo. Collectively, our findings reveal a pivotal role for mitochondria-localized VSTM2L in driving ferroptosis resistance and highlight its potential as a ferroptosis-inducing therapeutic target for the treatment of PCa.


Conflict of interest statement

Competing interests: The authors declare no competing interests.

Figures

Fig. 1
Fig. 1. VSTM2L is a VDAC1 interacting protein in PCa cells.
A The top ten proteins, identified by co-IP/MS, was elucidated in association with VDAC1 in LNCaP cells. B, C HEK293T cells were transfected with Myc-VDAC1 and 3 × Flag-VSTM2L expression plasmids as indicated, whole cell lysates were extracted and immunoprecipitated with anti-Flag (B) or anti-Myc (C) antibodies. D, E DU145 (D) and 22Rv1 (E) cells overexpressed Myc-VDAC1-pLVX or control cells were subjected to immunoprecipitation with anti-Myc antibody and followed by western blot analysis. F The direct interaction between VSTM2L and VDAC1 was confirmed by GST pull-down assay. GST-VSTM2L fusion proteins were purified and incubated with PC3 cell lysates and analyzed by western blotting. Purified GST proteins served as negative controls. G A representative image of an SDS-PAGE gel stained with Coomassie blue. LNCaP cells transfected with 3 × Flag-VSTM2L were collected for immunoprecipitation with anti-Flag antibodies, and separated by SDS-PAGE gel. The gel was subsequently stained with Coomassie blue to visualize the distinct binding bands. H Venn diagram showing the 574 proteins obtained by intersecting the IP-MS data of VDAC1 and VSTM2L. I The top 15 positively enriched KEGG pathways of the 574 proteins are shown. Hypergeometric test was used for P-value calculation. J Western blotting analysis of the expression of VSTM2L in mitochondria and cytoplasm of PC3, DU145 and 22Rv1 cells, respectively. Mitochondria and cytoplasmic protein levels were normalized to COX IV and α-Tubulin, respectively. The samples were derived from the same experiment and the gels/blots were processed in parallel. K Representative images of immunofluorescence staining for VSTM2L and MitoTracker in PC3, DU145, and 22Rv1 cells. The nucleus was stained with Hoechst. Scale bars, 8 μm. Source data are provided as a Source Data file.
Fig. 2
Fig. 2. VSTM2L is positively associated with prostate cancer aggressiveness.
A The top (1-25) over-expressed genes in Prostate adenocarcinoma (PRAD) were analyzed based on the TCGA cohort by using the UALCAN database (Normal, n = 52; Tumor, n = 497). B The mRNA levels of VSTM2L in PRAD and normal tissues of TCGA PRAD cohort and GTEX prostate normal data. P = 7.168E-52. C The mRNA levels of VSTM2L in PRAD and normal tissues from GENT2 database. P = 3.2305E-7. D, E The protein levels of VSTM2L from 78 paired clinical prostate cancer specimens. The IHC staining score was used to quantify the protein levels of VSTM2L. Scale bar =250 μm. P = 2.7147E-17. F, G Association between Progression-free-survival (F) or Disease-free survival (G) of prostate cancer patients and VSTM2L mRNA expression from the TCGA database. H, I The cell proliferation was measured in VSTM2L knockdown 22Rv1 (Control VS shVSTM2L-1 P = 0.000045, Control VS shVSTM2L-2 P = 2.1828E-8) (H) or DU145 (Control VS shVSTM2L-1 P = 0.000002, Control VS shVSTM2L-2 P = 0.000011) (I) cells by CCK8 assay. Data are shown as the mean ± SD (n = 5 biological replicates). J, K The effects of VSTM2L knockdown on the growth of 22Rv1 (Control VS shVSTM2L-1 P = 4.3015E-7, Control VS shVSTM2L-2 P = 4.1099E-7) or DU145 (Control VS shVSTM2L-1 P = 2.9544E-7, Control VS shVSTM2L-2 P = 8.3674E-8) cells, as detected using the colony formation assay. Data are shown as the mean ± SD (n = 4 biological replicates). L-N Wound healing analysis for assessing migration of the indicated cell strains at 0 h and indicated endpoint. Representative images (L, M) and quantification (N) are shown as indicated. Data are presented as the mean ± SD (n = 3 biological replicates). Scale bar = 200 and 250 μm. O, P Representative pictures (O) and quantification analysis (P) of migration assays in control and VSTM2L knockdown 22Rv1 cells (Control VS shVSTM2L-1 P = 0.000008, Control VS shVSTM2L-2 P = 0.000007) or DU145 cells. Data are plotted as mean ± SD (n = 3 biological replicates). Scale bar = 250 μm. P value was determined by unpaired two-tailed Student’s t-test without adjustments. (B, C), paired two-tailed Student’s t-test without adjustments (E), log-rank test (F, G), two-way ANOVA (H, I) and one-way ANOVA (K, N, P). Source data are provided as a Source Data file.
Fig. 3
Fig. 3. VSTM2L suppression promotes ferroptosis of PCa Cells.
A The cell morphology of 22Rv1 and Du145 cells with VSTM2L shRNA (shVSTM2L) or control shRNA (control) were observed by inverted light microscopy. Scale bars = 200 μm. B Representative transmission electron microscopy (TEM) images of 22Rv1 cells with control or shVSTM2L. Scale bars = 1 μm / 500 nm. CF Representative images (C) and quantification analysis (DF) of high resolution laser confocal microscopy for the morphology of mitochondria in DU145 cells transfected with control or shVSTM2L. Data shown as mean ± SD, n = 3 for each group, Scale bars = 10 μm. GI The 22Rv1(G) and DU145 (H) cells with VSTM2L shRNA (shVSTM2L-1, shVSTM2L-2) or control shRNA (Control) were stained with propidium iodide (PI, 3 μg/mL) and analyzed by flow cytometry to evaluate the cell death rate. Data is shown as mean ± SD of n = 3 biological replicates. 22Rv1 (Control VS shVSTM2L-1 P = 6.1418E-7, Control VS shVSTM2L-2 P = 1.1758E-7), DU145 (Control VS shVSTM2L-2 P = 0.00002). J Lipid peroxidation was measured by C11-BODIPY (5 μM) in 22Rv1 (Control VS shVSTM2L-1 P = 0.000019, Control VS shVSTM2L-2 P = 5.9221E-8) and Du145 cells with control or VSTM2L shRNAs. Data shown as mean ± SD of n = 3 biological replicates. K The level of glutathione (GSH) in 22Rv1 and Du145 cells with control or VSTM2L shRNAs. Data shown as mean ± SD of n = 3 biological replicates. L Western blot analysis of GPX4 and VSTM2L protein levels in VSTM2L knockdown PCa cells or control cells. Protein levels were normalized to total GAPDH. P value was determined by unpaired two-tailed Student’s t-test without adjustments (D, E, F) and one-way ANOVA (I, J, K). Source data are provided as a Source Data file.
Fig. 4
Fig. 4. VSTM2L inhibition sensitizes PCa cells to ferroptosis inducer, RSL3.
A Viability of 22Rv1 or DU145 cells transfected with VSTM2L shRNA or control shRNA was measured by CCK-8 in the presence of varying concentrations of RSL3 (0–100 μM) for 24 h. Data shown as mean ± SD of n = 3 biological replicates. B The schematic diagram of the in vivo experimental process. 1 × 10⁶ 22Rv1 shVSTM2L cells and control cells were inoculated trans-subcutaneous into nude mice. RSL3 (5 mg/kg) was intraperitoneally injected into the mice on alternate days for a total of six injections. The tumor tissues were isolated on 27th days post-inoculation. C, D General view of tumor weight (Control+RSL3 VS shVSTM2L + RSL3 P = 6.6076E-7) (C) and tumor volume (D) (examined every 3 days) of each indicated group at 27 days after cell injection. Data shown as mean ± SD, n = 5 tumors, ns, not significant. E, F The levels of GSH (E) and BH4 (Control VS shVSTM2L P = 0.000018) (F) in the tumor tissues at the indicated endpoint. Data shown as mean ± SD, n = 5 tumors. G-K Immunohistochemistry (IHC) and hematoxylin and eosin (H & E) staining for Ki-67 (Control VS shVSTM2L P = 0.000005, Control+RSL3 VS shVSTM2L + RSL3 P = 4.1427E-11) (G, H), VSTM2L (Control VS shVSTM2L P = 0.000014, Control+RSL3 VS shVSTM2L + RSL3 P = 0.000011) (G, I), GPX4 (Control VS shVSTM2L P = 0.000063, Control+RSL3 VS shVSTM2L + RSL3 P = 5.0408E-11) (G, J) and C-Caspase3 (G, K) were performed in isolated tumor tissues. Data shown as mean ± SD, n = 5 tumors, and each tumor slice randomly selected 5 magnification fields, Scale bar =20 μm. P value was determined by two-way ANOVA (A, D) and unpaired two-tailed Student’s t-test without adjustments (C, E, F, H-K). Source data are provided as a Source Data file.
Fig. 5
Fig. 5. Fer-1 reverses VSTM2L suppression induced ferroptosis of PCa cells in the presence of RSL3.
A Viability of DU145 cells transfected with VSTM2L shRNA (shVSTM2L-1, shVSTM2L-2) or control shRNA (Control) treated with or without RSL3 (2 μM), Fer-1 (5 μM), 3MA (60 μM), CQ (25 μM), Z-VAD-FMK (10 μM), Z-IETD-FMK (10 μM), Z-DEVD-FMK (10 μM) for 24 h. Data shown as mean ± SD (n = 3 biological replicates). ns, not significant. B Viability of 22Rv1 cells transfected with VSTM2L shRNAs or control shRNA treated with or without RSL3 (1 μM), Fer-1(10 μM). Data shown as mean ± SD (n = 3 biological replicates). ns, not significant. C Bright-field images of 22Rv1 cells with VSTM2L or control shRNA treated with or without RSL3 (1 μM) or Fer-1 (10 μM) for 24 h. D-F Representative flow cytometry histograms show the percentage of cell death in 22Rv1 (D) and DU145 (E) cells transfected with VSTM2L shRNAs or control shRNA, stained by PI (3 μg/mL). Quantification of the percentage of cell death rate in different cell lines (F). Cells were treated with or without RSL3 (DU145, 2 μM; 22Rv1, 1 μM) and Fer-1 (DU145, 5 μM; 22Rv1, 10 μM) for 24 h. Data shown as mean ± SD (n = 3 biological replicates). ns not significant. G Relative C11-BODIPY fluorescence measured by flow cytometry of PCa cells treated with VSTM2L shRNA or control shRNA and cultured with either RSL3 (DU145, 2 μM; 22Rv1, 1 μM), Fer-1 (DU145, 5 μM; 22Rv1, 10 μM) or both for 24 h. H The percentages of lipid peroxidation are presented as the means ± SD (n = 3 biological replicates). ns, not significant. P value was determined by two-way ANOVA. Source data are provided as a Source Data file.
Fig. 6
Fig. 6. VSTM2L suppresses VDAC1 oligomerization by facilitating the interaction between VDAC1 and HK2.
A Co-transfected Myc-VDAC1, Flag-VDAC1, and different amounts of 3 × Flag-VSTM2L into HEK293T cells, the oligomerization of VDAC1 was analyzed by co-IP/WB. The samples derived from the same experiment and the gels/blots were processed in parallel. B VSTM2L suppressed or overexpressed PCa cells were harvested, respectively, and incubated with ethylene glycol bis-(succinimidyl succinate) to cross-link proteins, then subjected to western blot to evaluate VDAC1 oligomeric status. The samples were derived from the same experiment and that gels/blots were processed in parallel. C Schematic representation of the full-length VSTM2L and its truncated mutants was shown. D HEK293T cells were transfected with indicated full-length VSTM2L or its truncated forms, as well as full-length VDAC1. Cell lysates were harvested and subjected to immunoprecipitation with anti-Flag antibodies to map the binding region of VDAC1 with VSTM2L. E 22Rv1 cells were transfected with full-length VSTM2L or its truncated mutant as indicated. Cell lysates were collected and analyzed using a cross-linking assay to identify the functional region of VSTM2L responsible for inhibiting VDAC1 oligomerization. The samples derived from the same experiment and that gels/blots were processed in parallel. F A schematic of the full-length VDAC1 and its N-terminus truncated mutant was presented. G, H HEK293T cells were co-transfected with indicated full-length or N-terminus truncated mutant of VDAC1 and full-length VSTM2L. Cell lysates were collected and subjected to immunoprecipitation with anti-Myc (G) or anti-Flag (H) antibodies. Immunoprecipitants were analyzed with anti-Flag antibody and anti-Myc antibody. I A partial list of binding proteins of VSTM2L in LNCaP cells identified by mass spectrometry analysis. J, K HEK293T cells were co-transfected with V5-HK2, Myc-VDAC1 and 3 × Flag VSTM2L. Cell lysates were harvested and subjected to immunoprecipitation with anti-Flag (J) and anti-Myc (K) antibodies. Immunoprecipitants were analyzed with anti-Flag antibody, anti-V5 antibody and anti-Myc antibody. L DU145 cells overexpressed Myc-VDAC1-pLVX or control cells were subjected to immunoprecipitation with anti-Myc antibody and followed by western blot analysis. M The whole cell lysates were prepared from DU145 cells transfected with VSTM2L shRNA lentivirus or control shRNA lentivirus, and immunoprecipitations were performed with anti-HK2 antibodies, followed by western blot with indicated antibodies. The samples were derived from the same experiment and the gels/blots were processed in parallel. N Representative images of immunofluorescence staining for VDAC1 and HK2 in VSTM2L knockdown DU145 cells or control cells. The nucleus was stained with Hoechst. Scale bar 25 μm and 10 μm. Source data are provided as a Source Data file.
Fig. 7
Fig. 7. VSTM2L suppresses ferroptosis and maintains mitochondria homeostasis via inhibiting VDAC1 oligomerization in PCa cells.
A, B The levels of mtROS in 22Rv1 (Control VS shVSTM2L-1 P = 0.000001, Control VS shVSTM2L-2 P = 5.4234E-7) (A) and DU145 (Control VS shVSTM2L-1 P = 0.000001, Control VS shVSTM2L-2 P = 4.6453E-10) cells (B) transfected with VSTM2L shRNA (shVSTM2L-1, shVSTM2L-2) or control shRNA (Control). Data shown as mean ± SD of n = 3 biological replicates. C-F VSTM2L knockdown DU145 cells were cultured with or without VBIT4 (5 μM) for 24 h, then, cell death (C, D), lipid peroxidation (E) and mtROS (F) were assessed by PI (3 μg/μL), C11-BODIPY (5 μM) and MitoSOX (5 μM) staining, respectively. Data shown as mean ± SD of n = 3 biological replicates. ns not significant. G The level of GSH in VSTM2L inhibited DU145 cells treated with or without VBIT4 (5 μM) for 24 h. Data shown as mean ± SD of n = 3 biological replicates. ns not significant. H The level of lipid peroxidation in VSTM2L suppressed DU145 cells cultured with or without MitoQ (10 nM) for 24 h and assessed by C11-BODIPY (5 μM) staining. Data shown as mean ± SD of n = 3 biological replicates. ns not significant. I The level of MMP in VSTM2L knockdown DU145 cells cultured with or without VBIT4 (5 μM) for 24 h. Data shown as mean ± SD of n = 3 biological replicates. ns not significant. J, K Representative images of mitochondrial in VSTM2L depletion DU145 cells cultured with or without VBIT4 (5 μM) by MitoPeDPP (0.5 μM, Scale bars = 25 μm) (J) and Mito-Tracker (200 nM, Scale bars = 10 μm) (K) staining. LN Mitochondria counts mean mitochondria area, mean mitochondria perimeter (L), mitochondria network (branch counts) (M), mitochondria morphology (mean mitochondria form factor and mean mitochondria aspect ratio) (N) for images shown in K by ImageJ were determined. Data shown as mean ± SD, n = 3 for each group. ns not significant. P value was determined by one-way (A) and two-way ANOVA (D- I, L-N). Source data are provided as a Source Data file.
Fig. 8
Fig. 8. VSTM2L plays oncogenic roles in PCa by inhibiting VDAC1 oligomerization.
A VSTM2L knockdown DU145 cells cultured with or without VBIT4 (5 μM) for 48 h were harvested for the subsequent cross-link assay, then subject to western blot to assess VDAC1 oligomeric status. The samples derived from the same experiment and that gels/blots were processed in parallel. BD VSTM2L suppressed DU145 cells were cultured with or without VBIT4 (5 μM) for the indicated time, then the cell viability (n = 5 biological replicates) (B) and colony formation ability (n = 4 biological replicates) (C, D) were analyzed by CCK8 assay and Crystal Violet Aqueous Solution staining, respectively. Data shown as mean ± SD. ns not significant. E, F Wound healing analysis of VSTM2L inhibited DU145 cells in the absence or presence of VBIT4 (5 μM). Representative images (E) and quantification (F) are shown as indicated. Data shown as mean ± SD of n = 3 biological replicates. ns not significant, Scale bars = 200 μm. G, H Representative pictures (G) and quantification analysis (H) of migration assays in VSTM2L knockdown DU145 cells cultured with or without VBIT4 (5 μM). Data shown as mean ± SD of n = 3 biological replicates. ns not significant, scale bars = 250 μm. I A schematic diagram of the in vivo experimental process. 3.5 × 10⁶ DU145 shVSTM2L cells and control cells were inoculated trans-subcutaneous into nude mice. The mice were administrated with VBIT4 (20 mg/kg) by gavage on alternate days until the tumor tissues were isolated on 31th days post-inoculation. J, K General view of tumor weight of each indicated groups at the endpoint. Data shown as mean ± SD, n = 5 tumors, ns not significant. L Tumor growth curves were shown. Data shown as mean ± SD, n = 5 tumors, ns not significant. MQ Immunohistochemistry (IHC) and hematoxylin and eosin (H & E) staining for Ki-67 (M, N), VSTM2L (M, O), GPX4 (M, P) and C-Caspase3 (M, Q) were performed in isolated tumor tissues. Data shown as mean ± SD, n = 5 tumors and each tumor slice was randomly selected 5 magnification fields, Scale bars =20 μm. P value was determined by two-way ANOVA (B, D, F, H, L) and unpaired two-tailed Student’s t-test without adjustments (K, NQ). Source data are provided as a Source Data file.
Fig. 9
Fig. 9. Schematic diagram showing that VSTM2L knockdown facilitates VDAC1 oligomerization, disturbs the homeostasis of mitochondria and triggers ferroptosis.
Suppression of VSTM2L led to the dissociation of HK2 from VDAC1 and the increased oligomerization of VDAC1, which disturbed the homeostasis of mitochondria, ultimately triggering ferroptosis and inhibiting PCa progression.

References

    1. Sung, H. et al. Global cancer statistics 2020: GLOBOCAN estimates of incidence and mortality worldwide for 36 cancers in 185 countries. CA: A Cancer J. Clinicians71, 209–249 (2021). - PubMed
    1. Siegel, R. L., Giaquinto, A. N. & Jemal, A. Cancer statistics, 2024. CA: A Cancer J. Clinicians74, 12–49 (2024). - PubMed
    1. Han, B. et al. Cancer incidence and mortality in China, 2022. J. Natl Cancer Cent.4, 47–53 (2024). - PMC - PubMed
    1. Pernigoni, N. et al. Commensal bacteria promote endocrine resistance in prostate cancer through androgen biosynthesis. Science374, 216–224 (2021). - PubMed
    1. Zhou, X. et al. Abrogation of HnRNP L enhances anti-PD-1 therapy efficacy via diminishing PD-L1 and promoting CD8(+) T cell-mediated ferroptosis in castration-resistant prostate cancer. Acta pharmaceutica Sin. B12, 692–707 (2022). - PMC - PubMed

MeSH terms

LinkOut - more resources