. 2025 Feb;57(2):469-479.
doi: 10.1038/s41588-024-02067-0. Epub 2025 Jan 29.

Synchronized long-read genome, methylome, epigenome and transcriptome profiling resolve a Mendelian condition

Affiliations

Synchronized long-read genome, methylome, epigenome and transcriptome profiling resolve a Mendelian condition

Mitchell R Vollger et al. Nat Genet. 2025 Feb.

Abstract

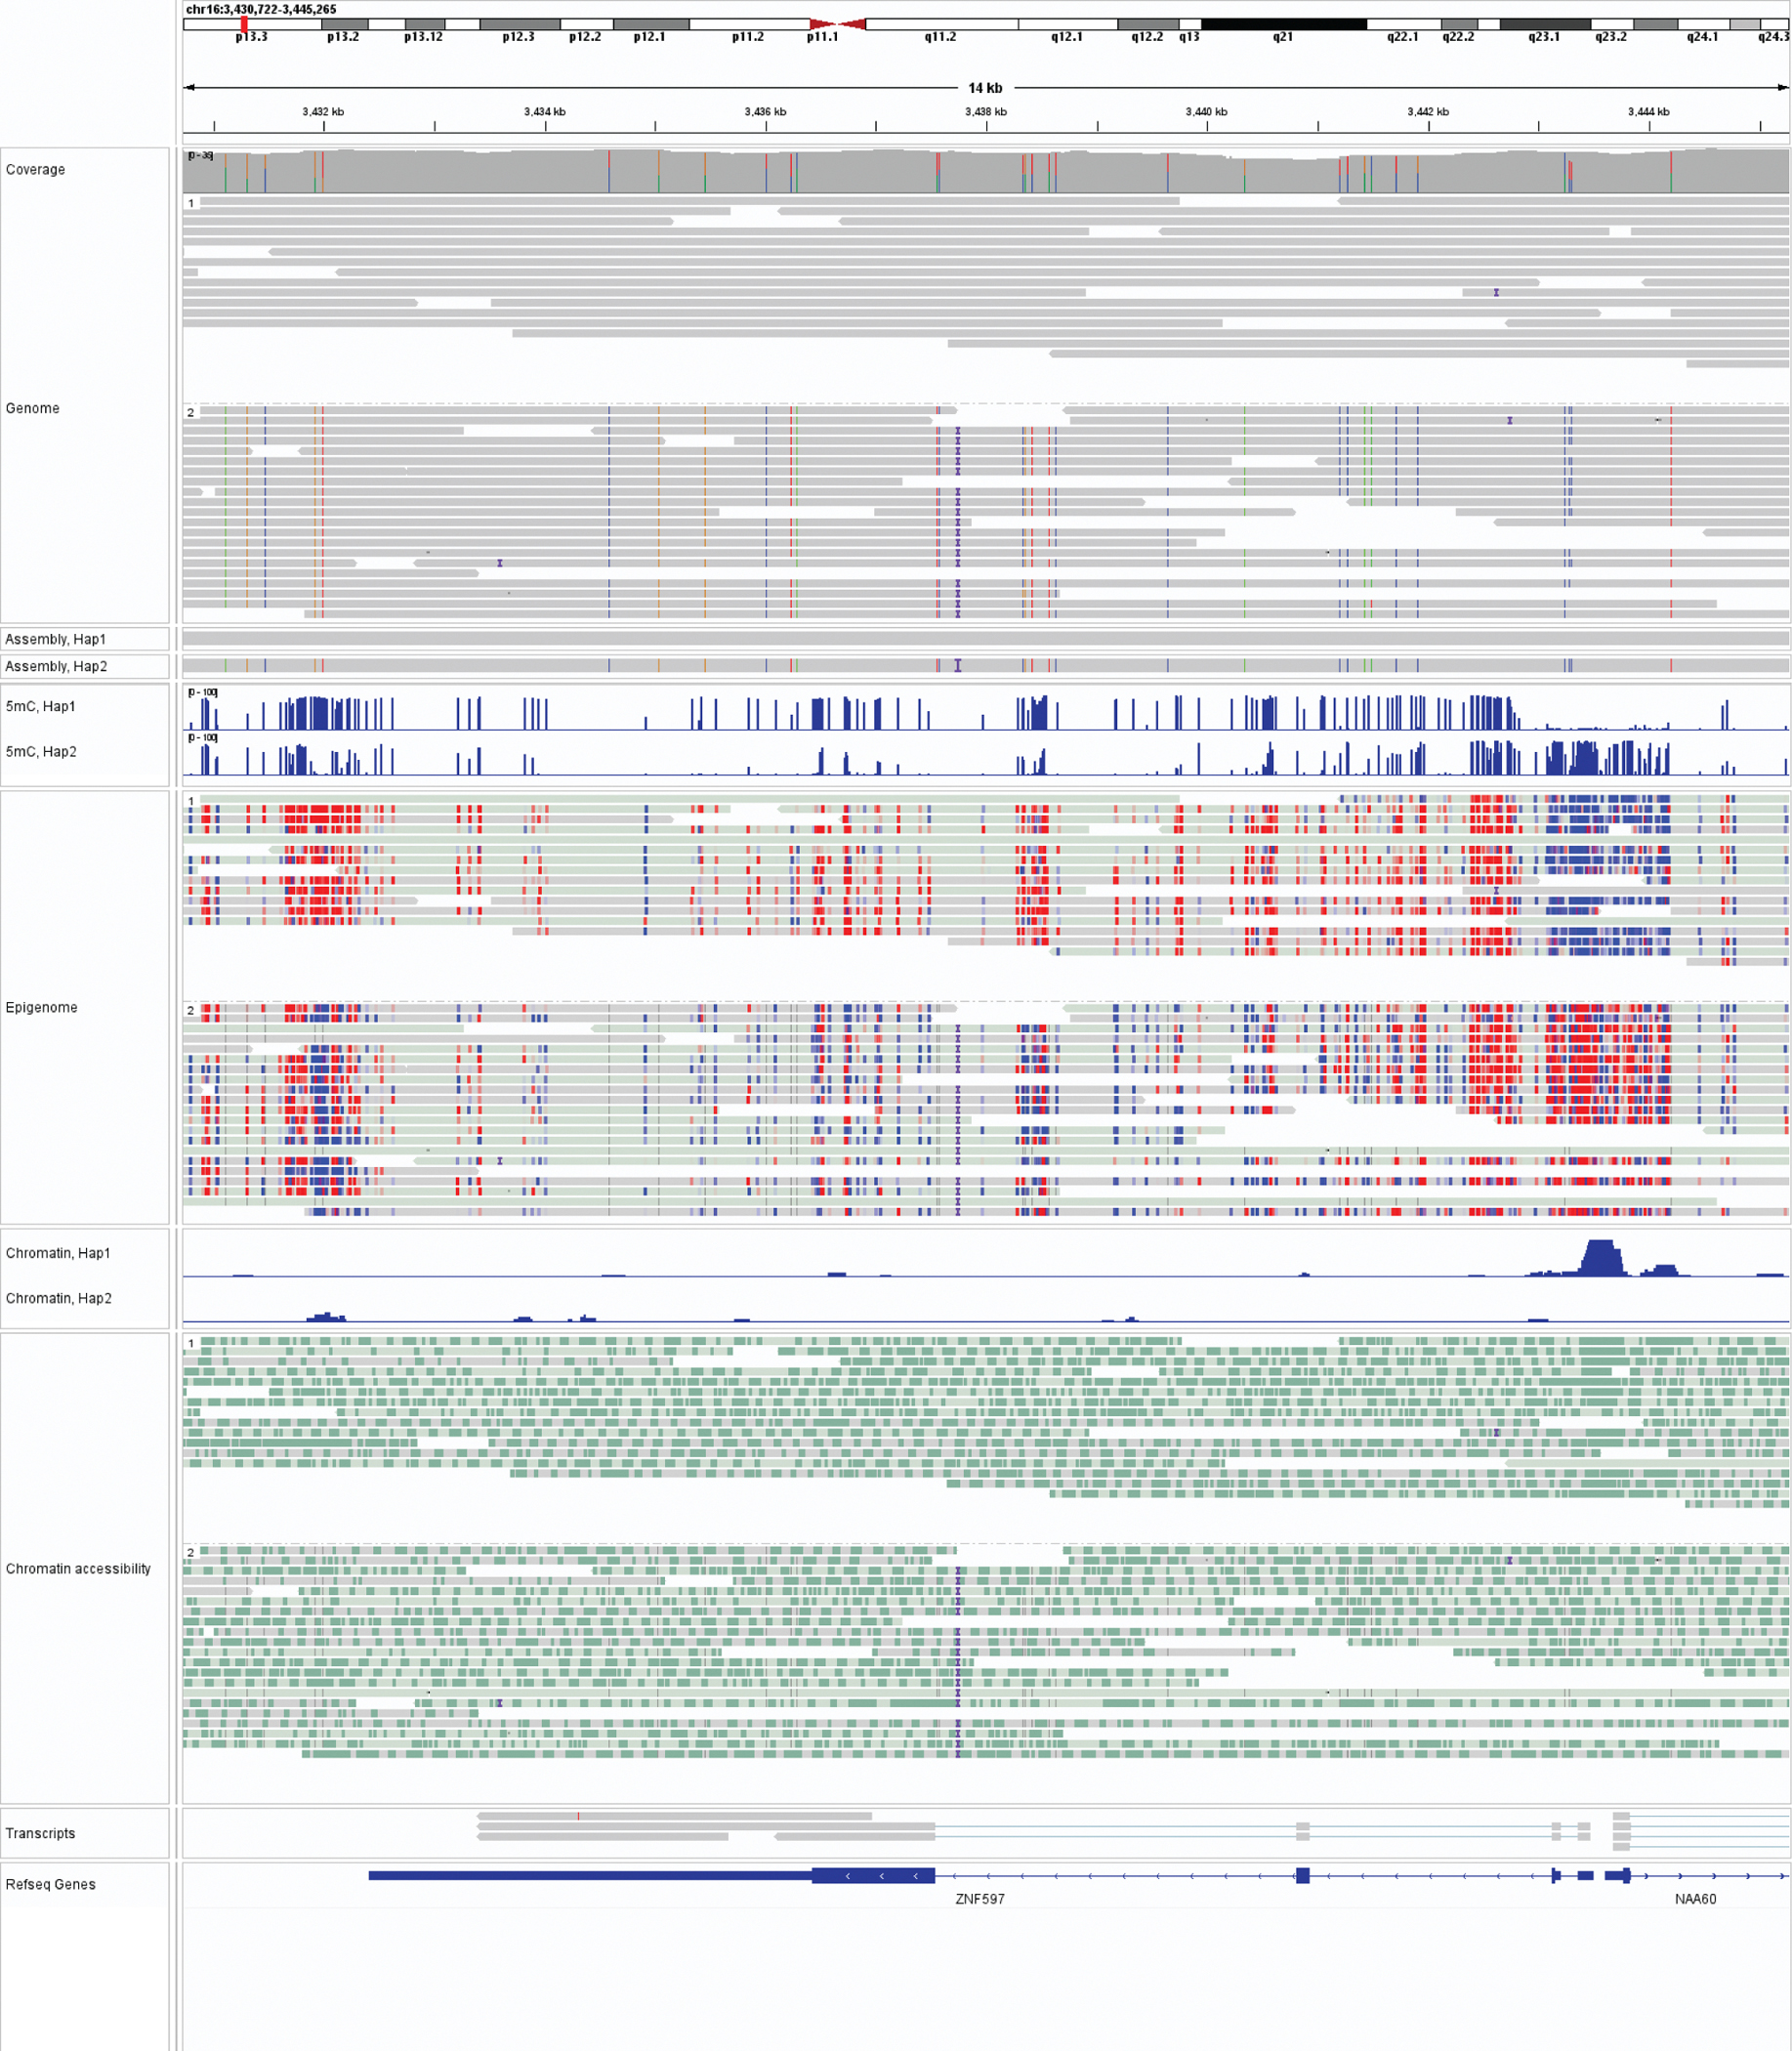
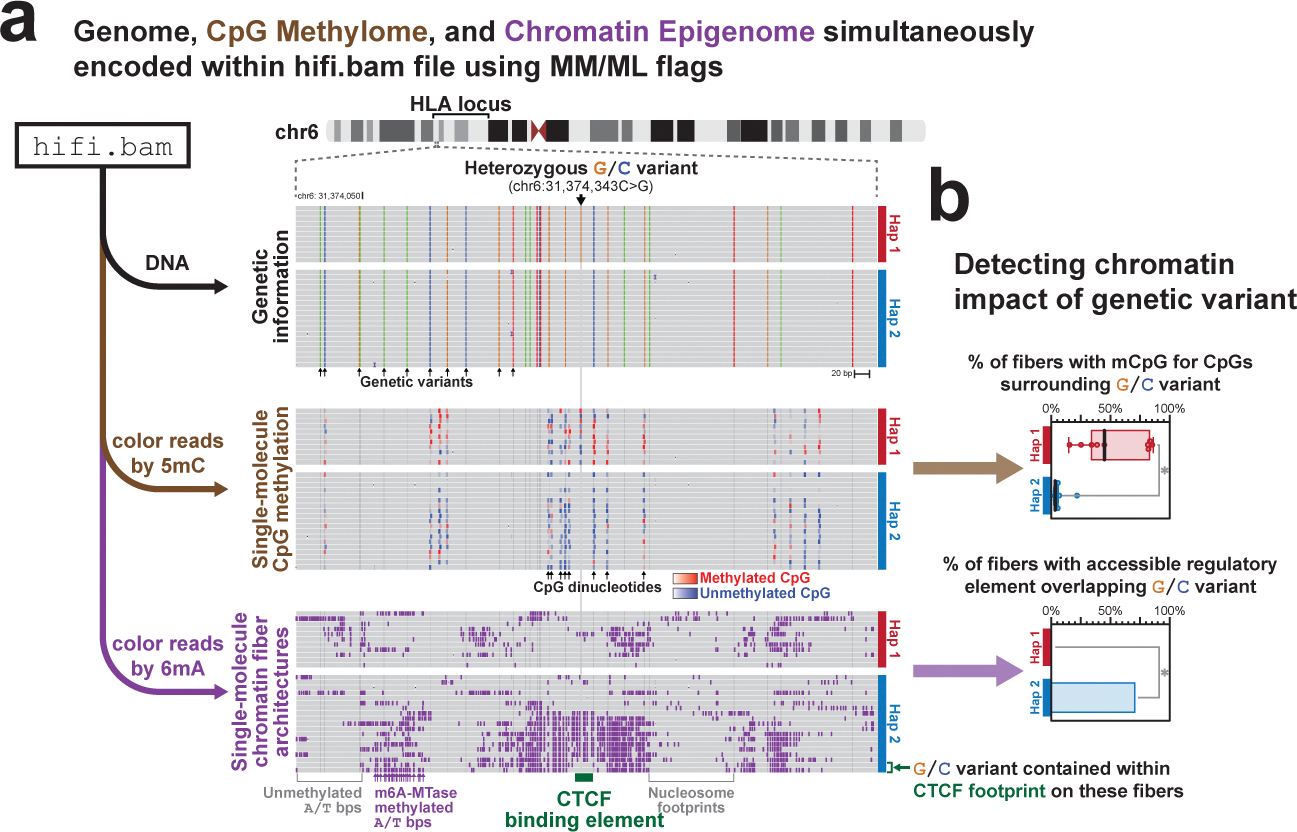
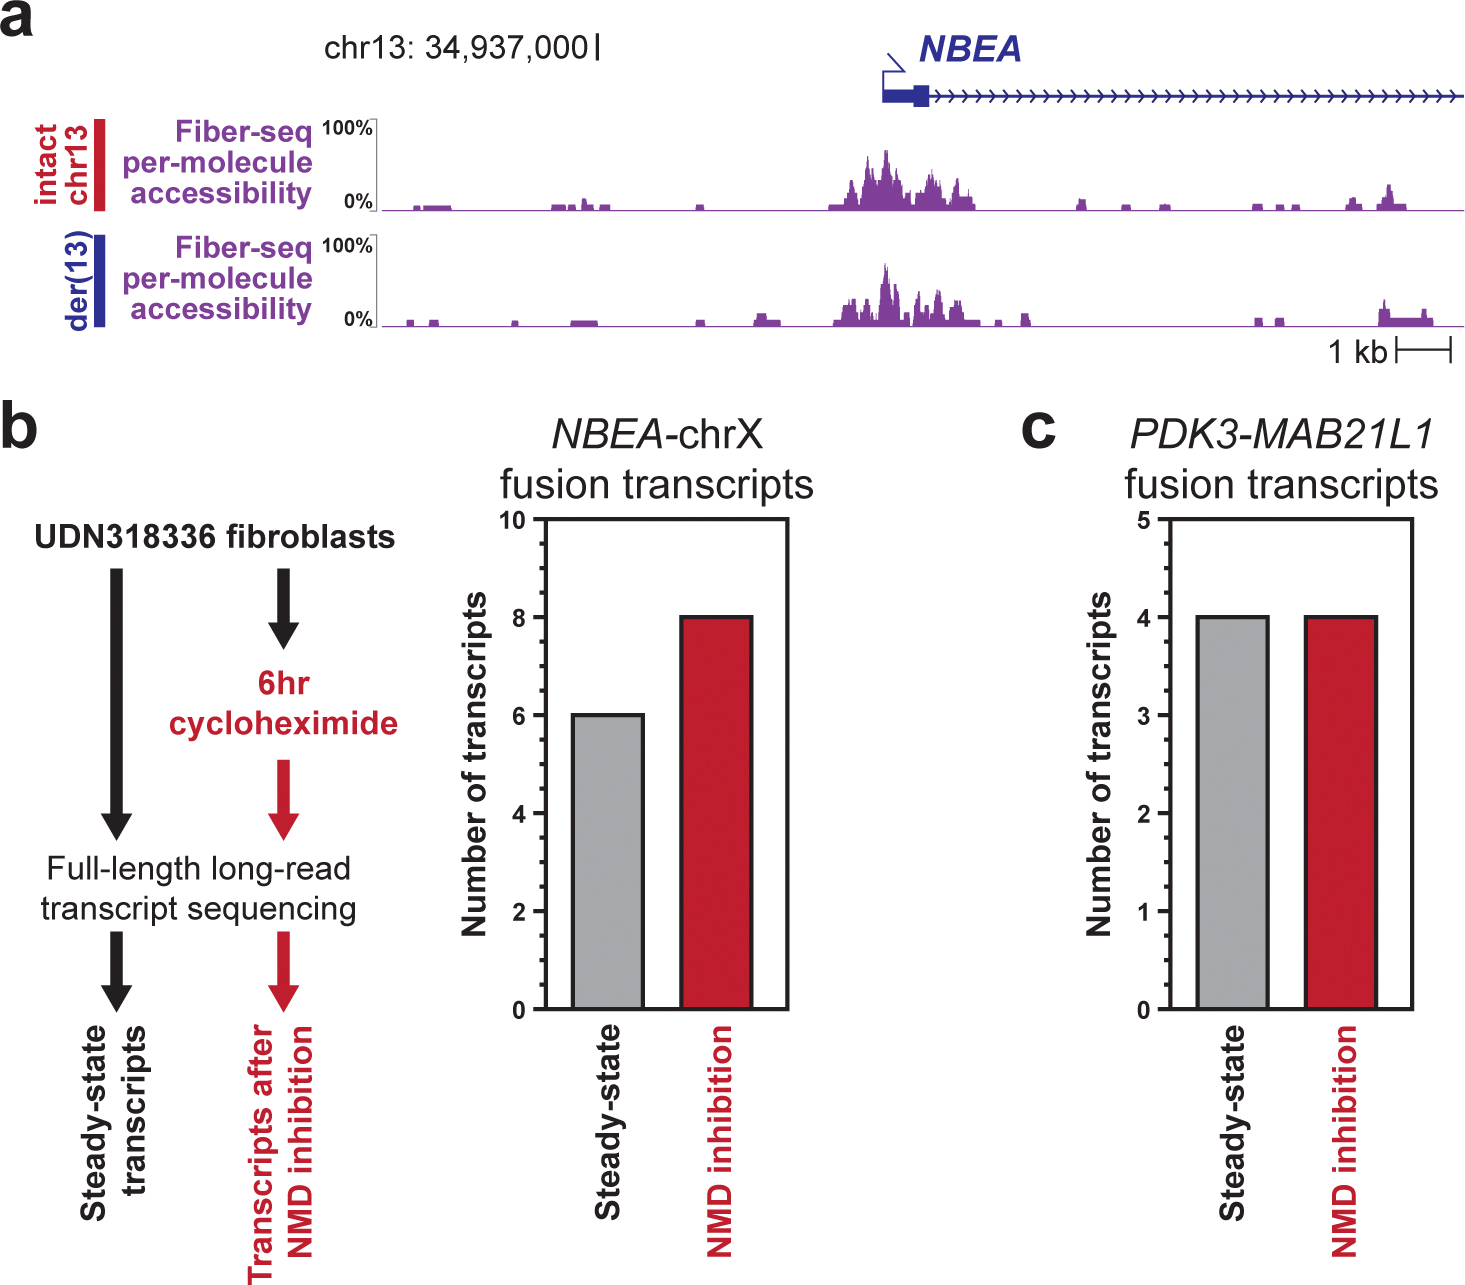
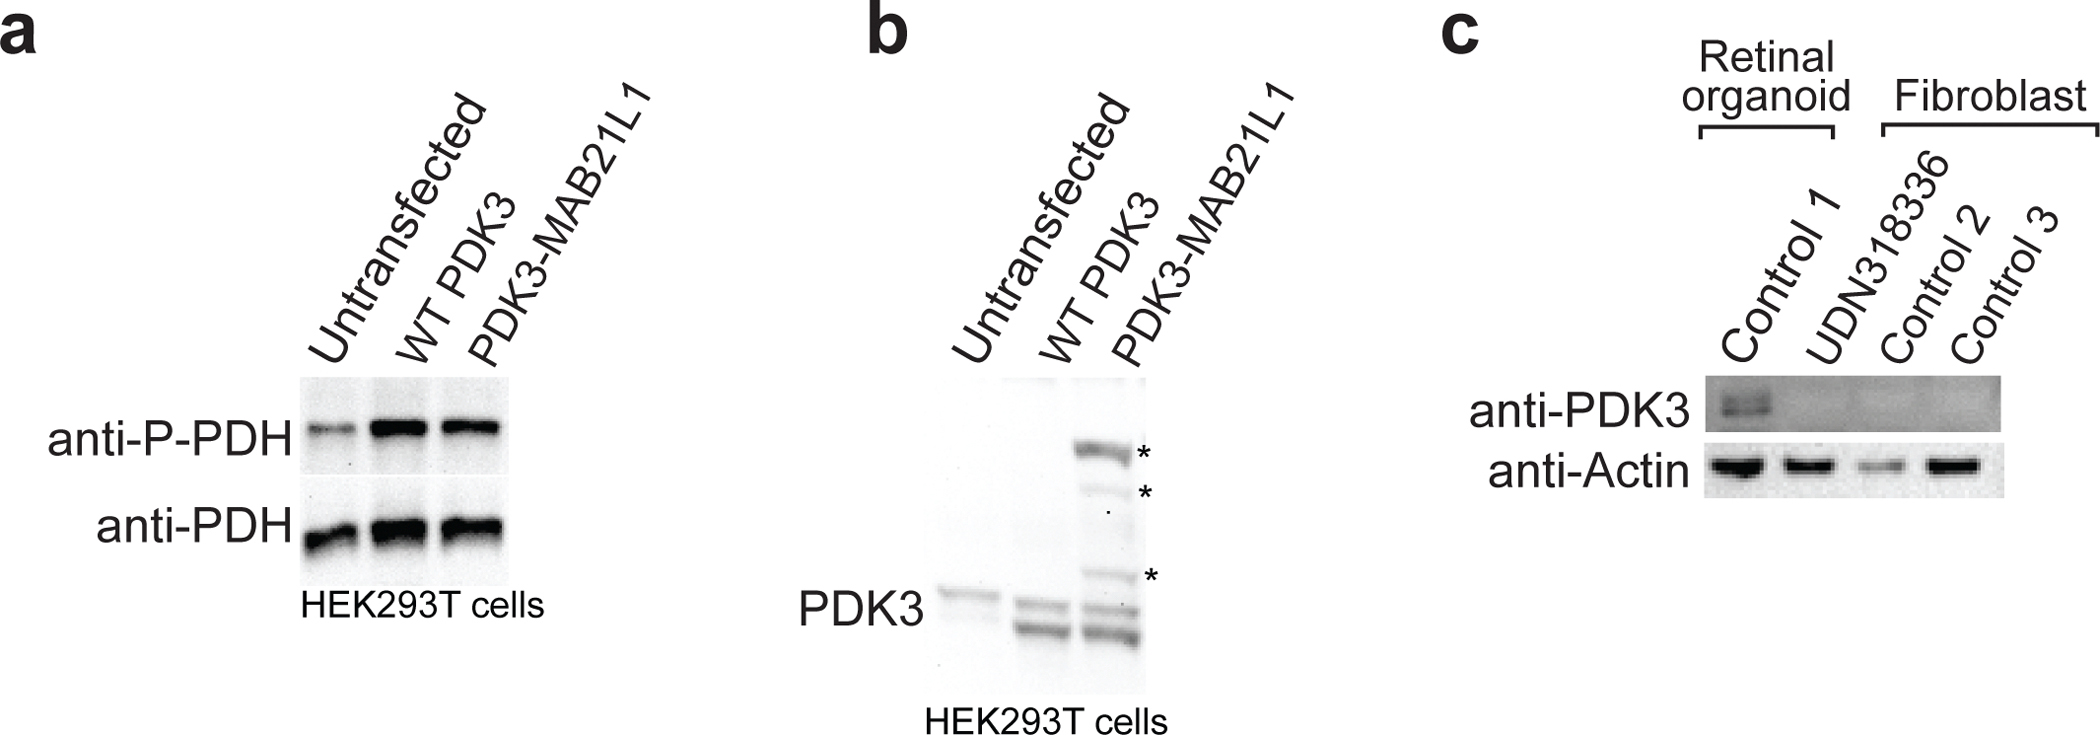
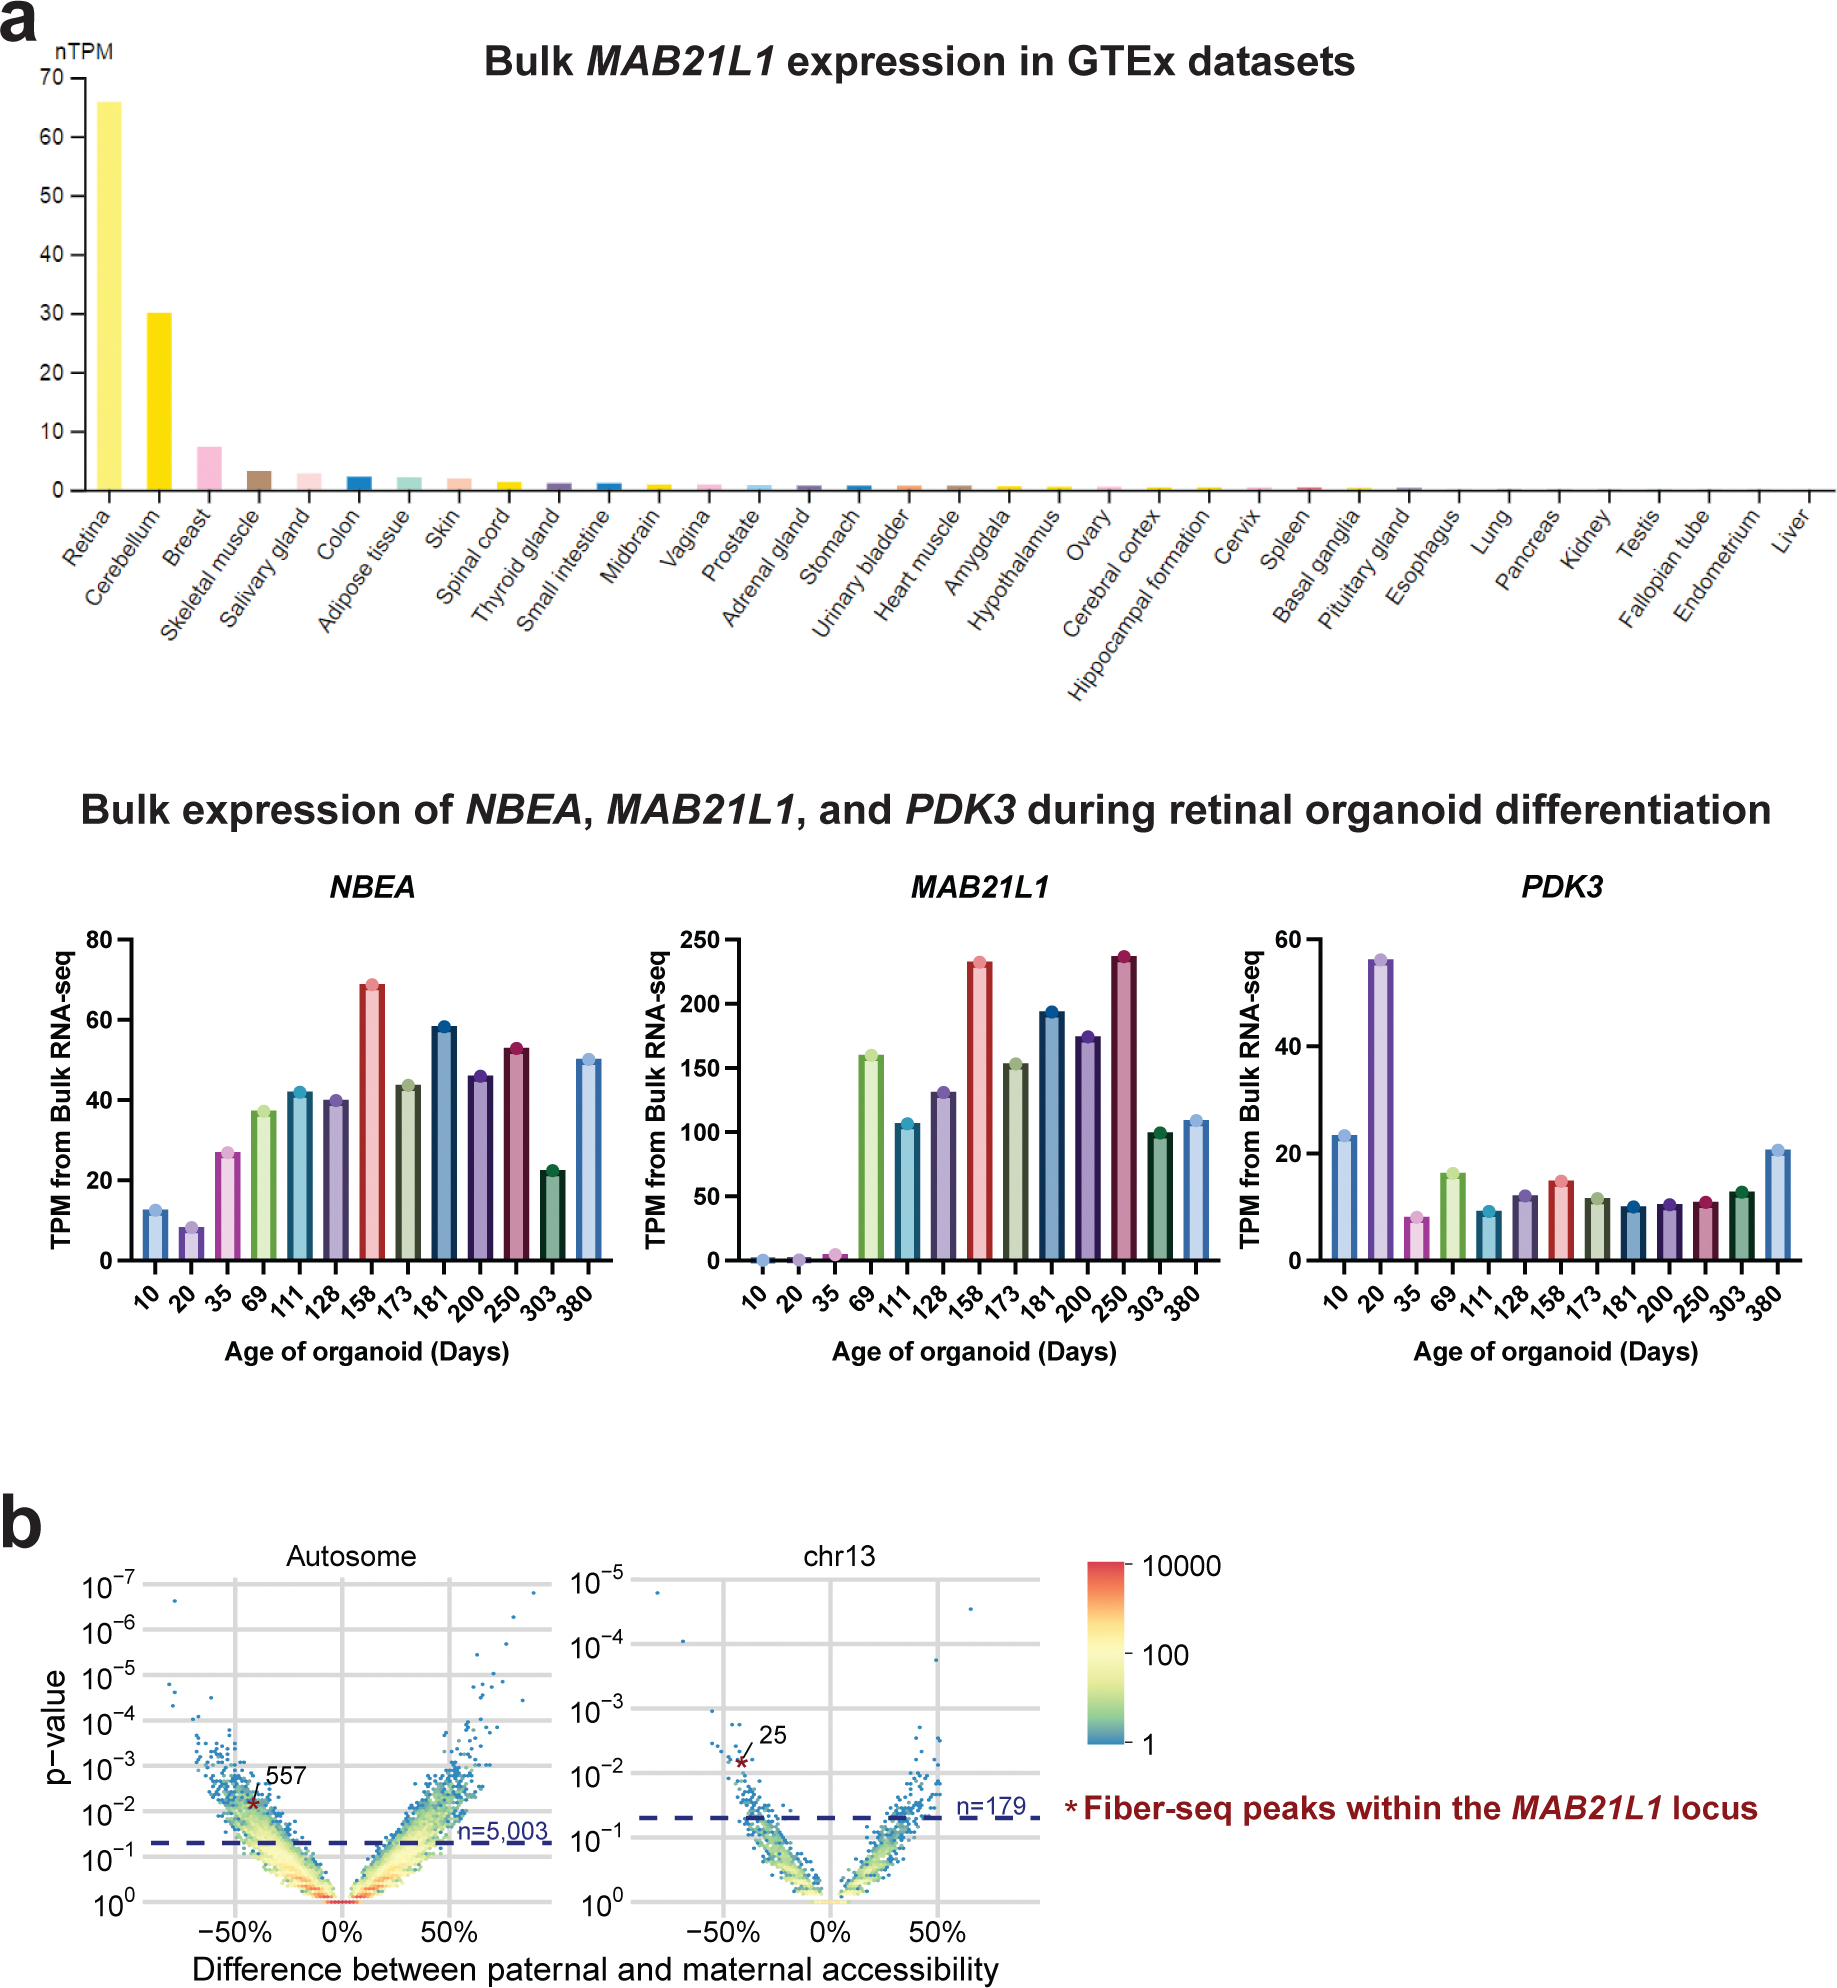
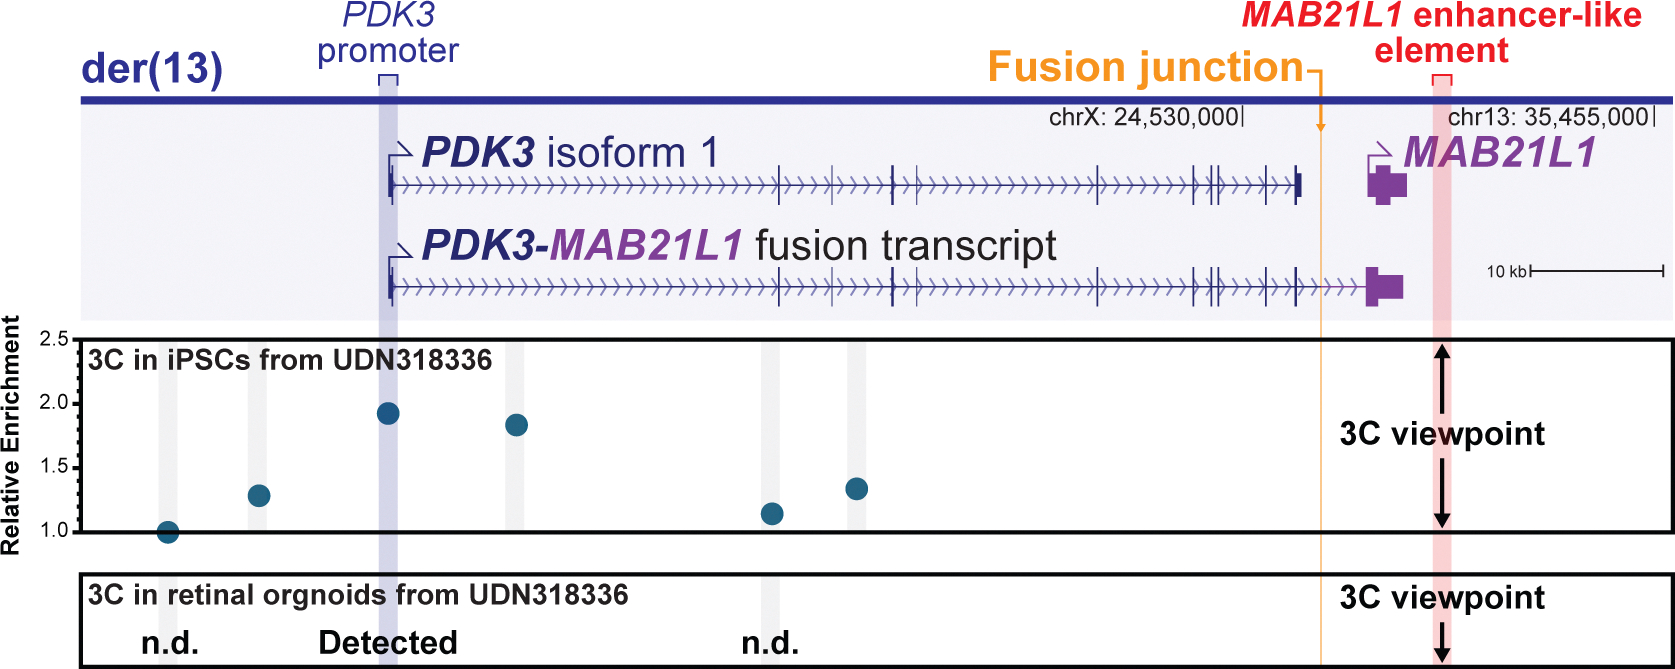
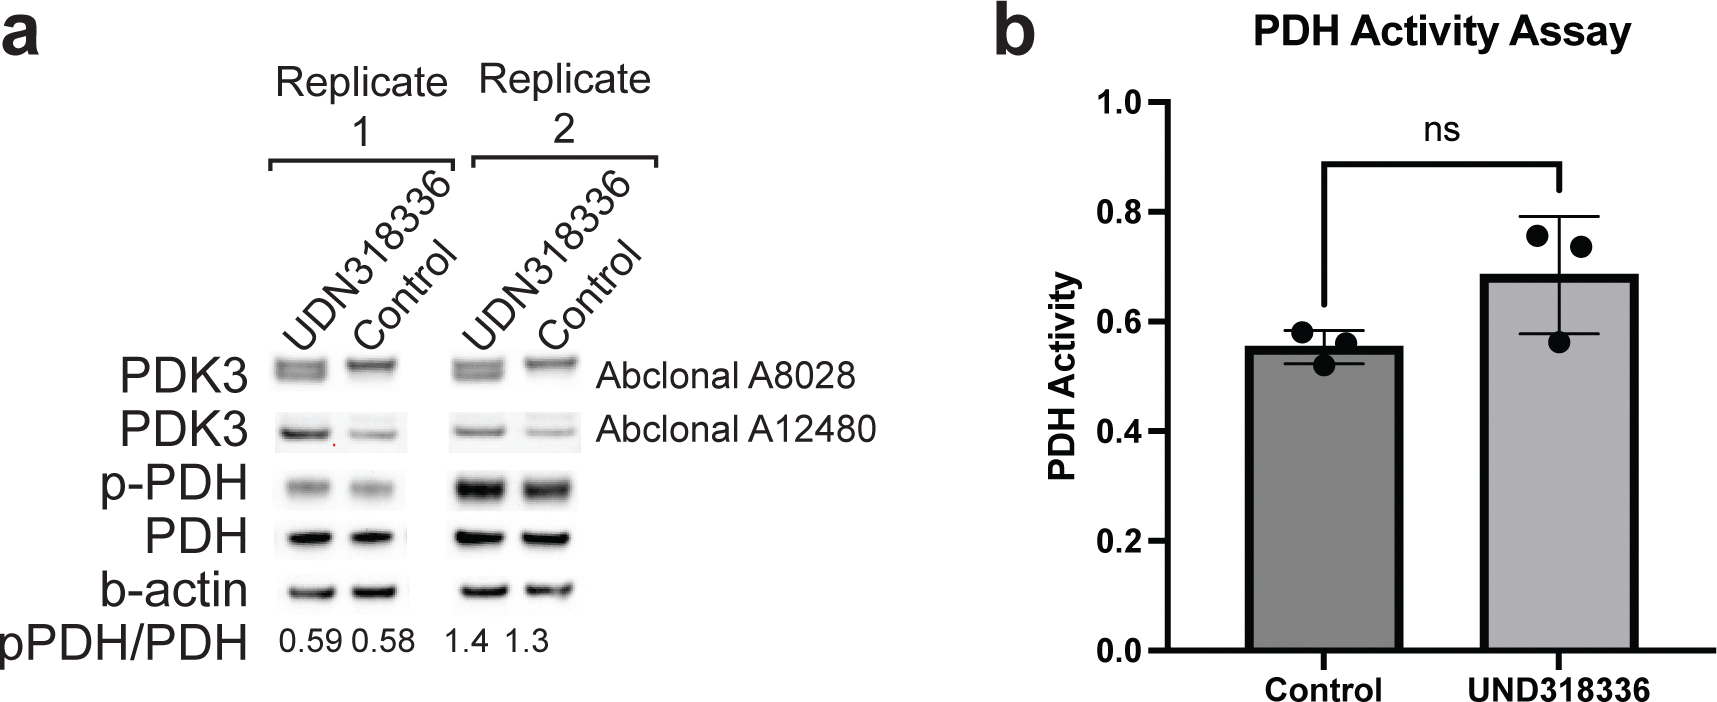
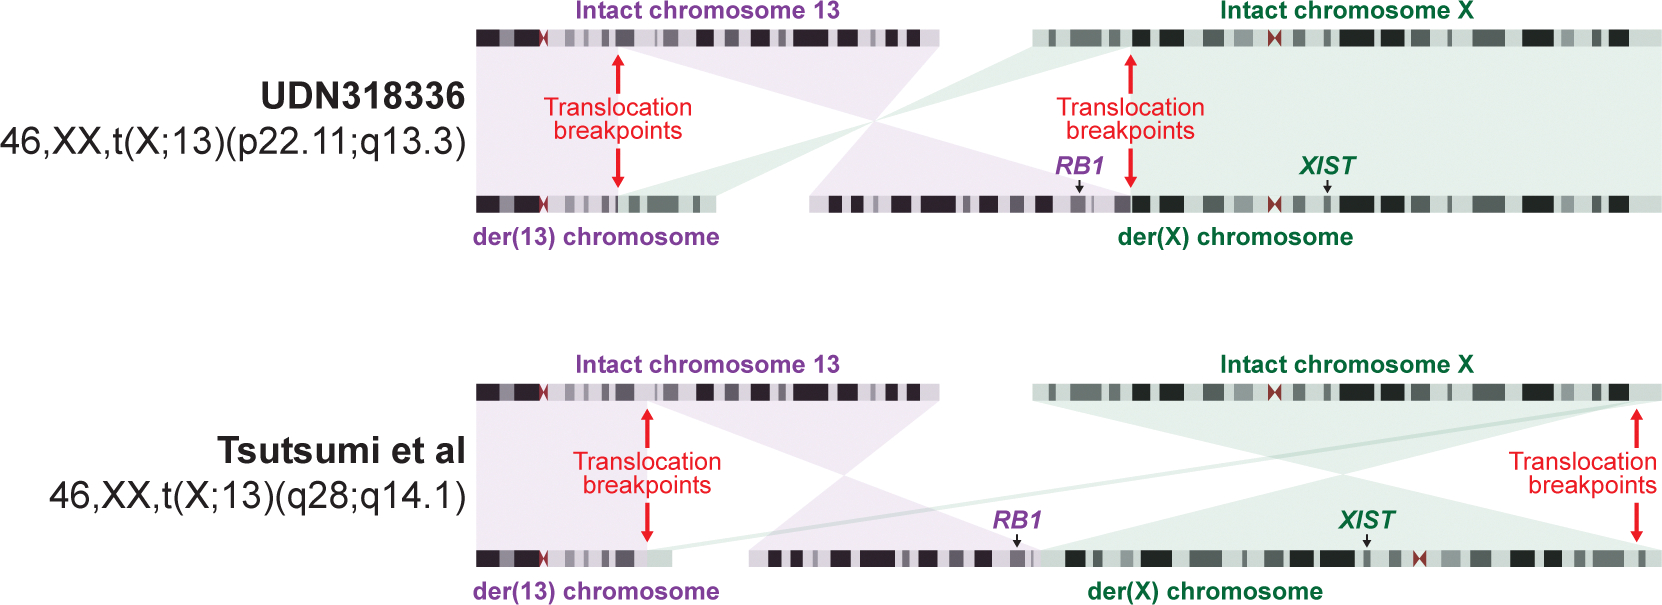
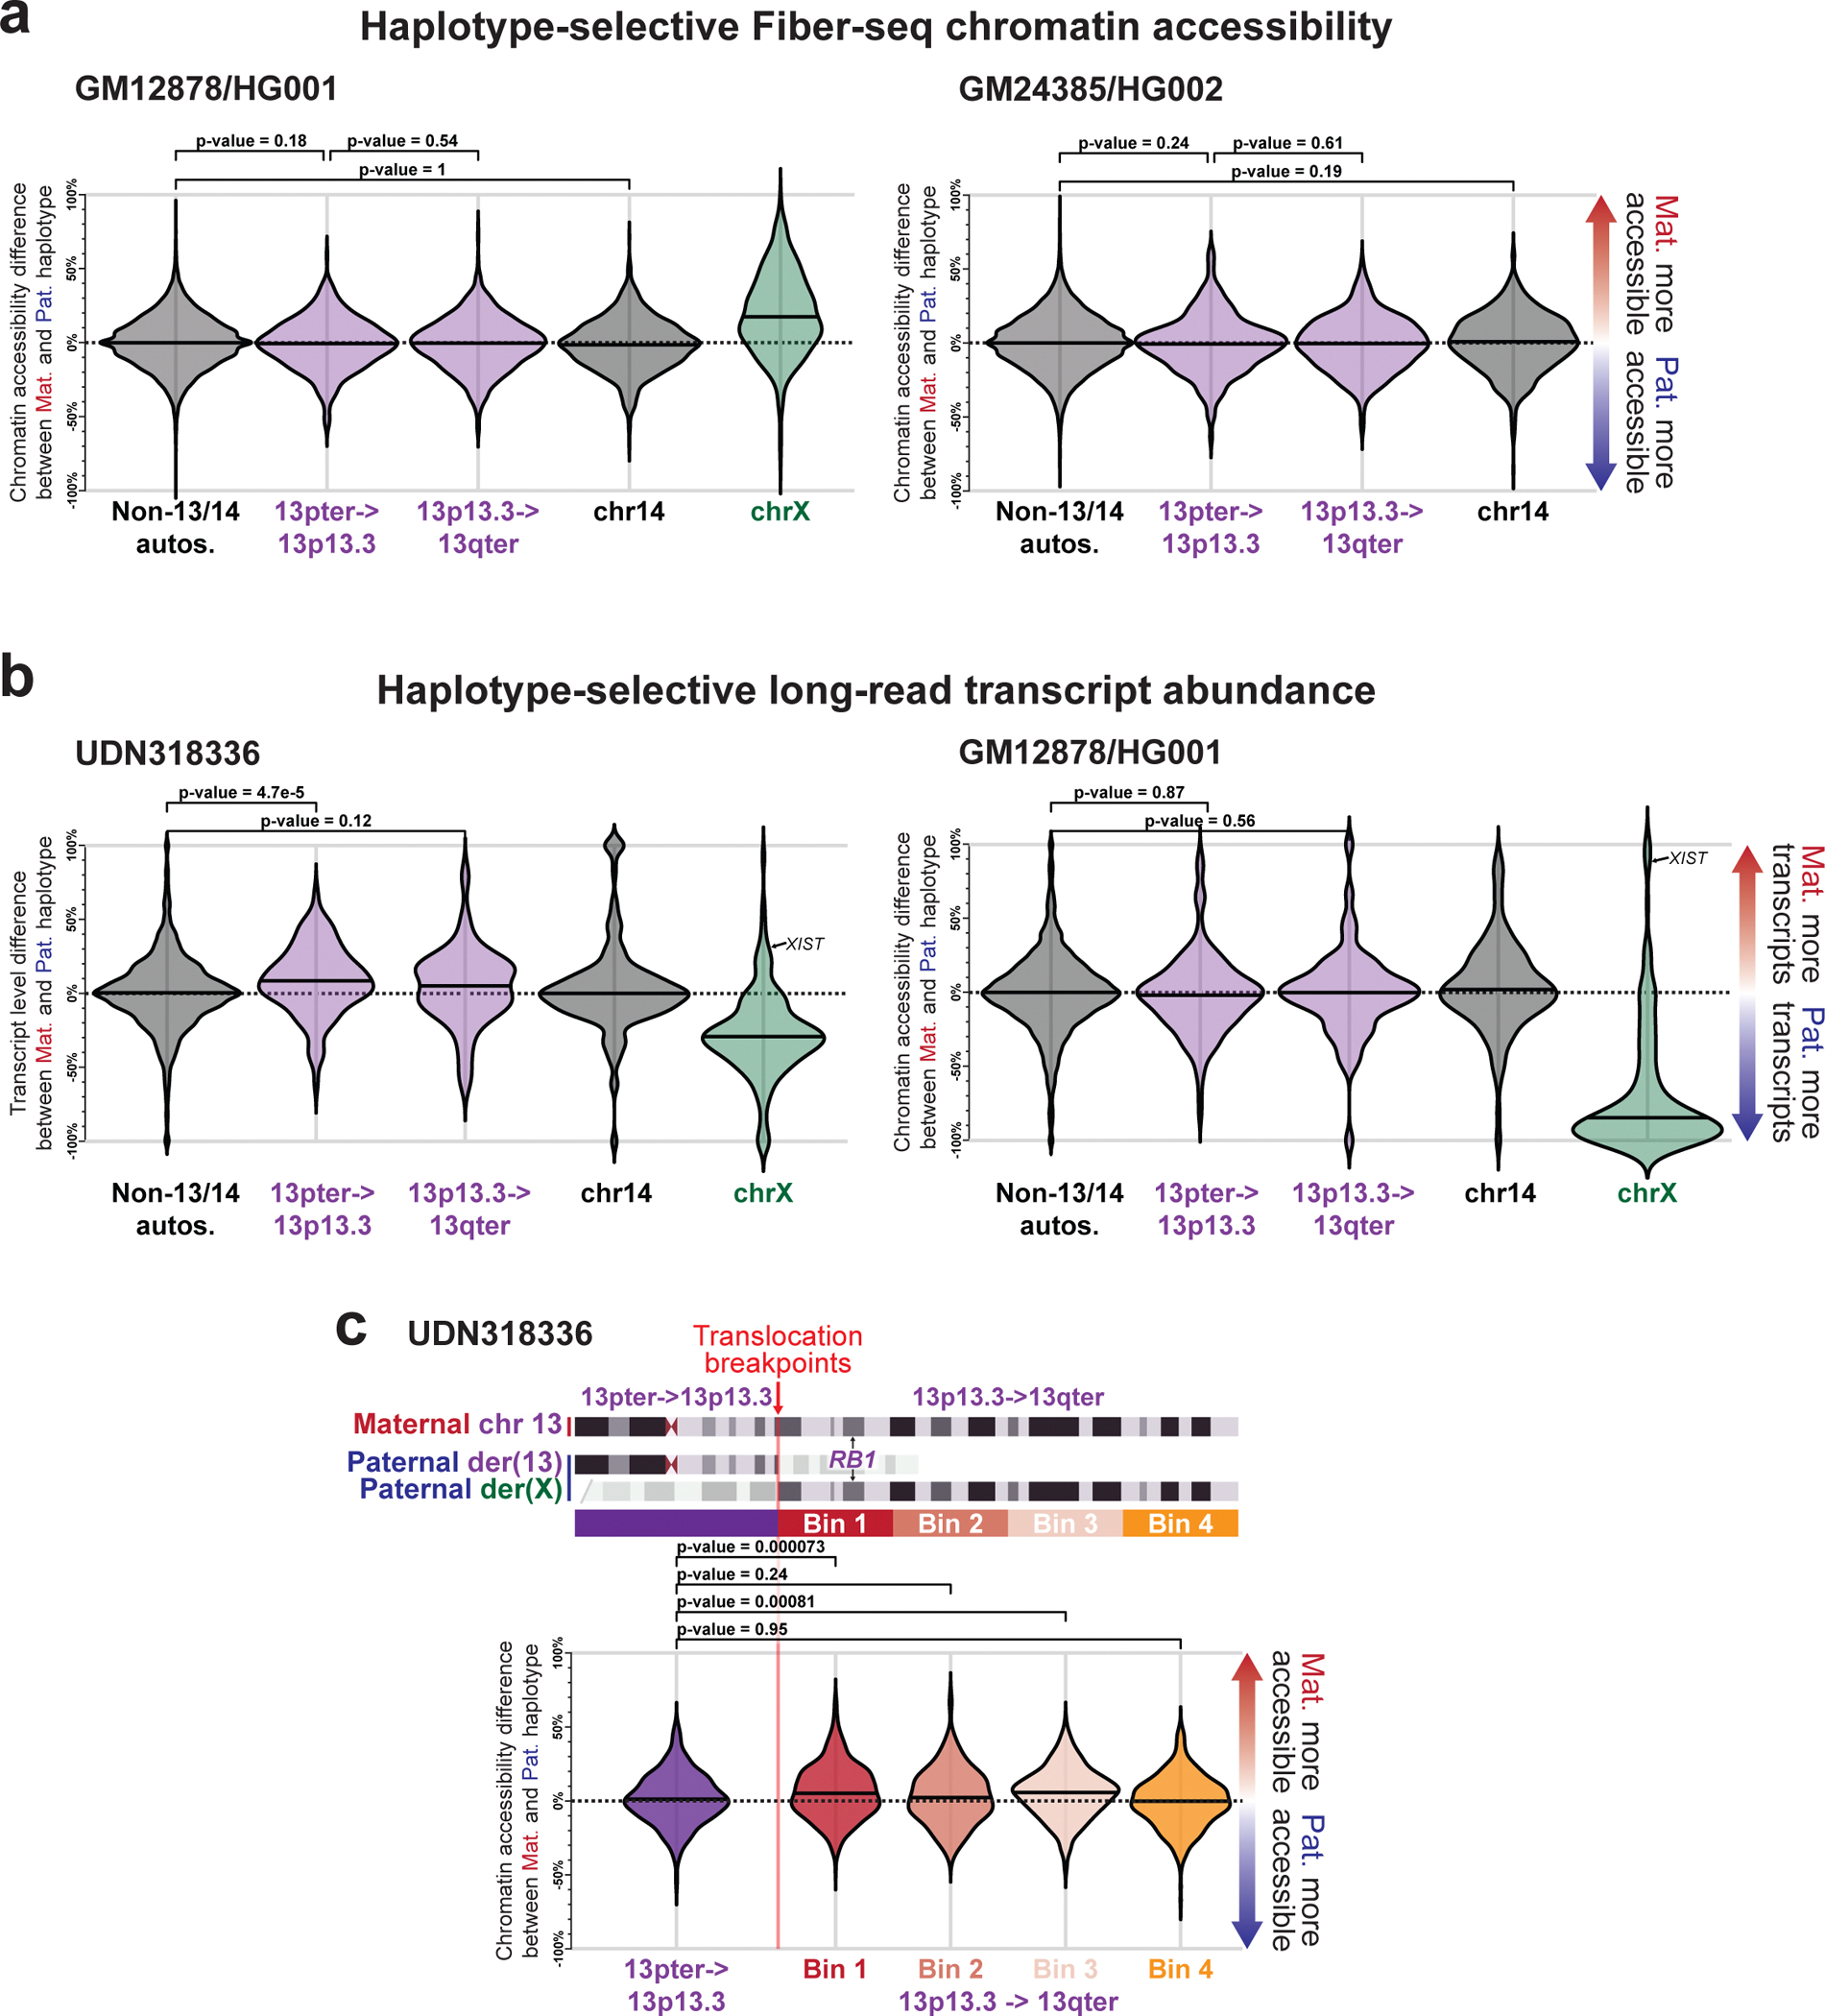
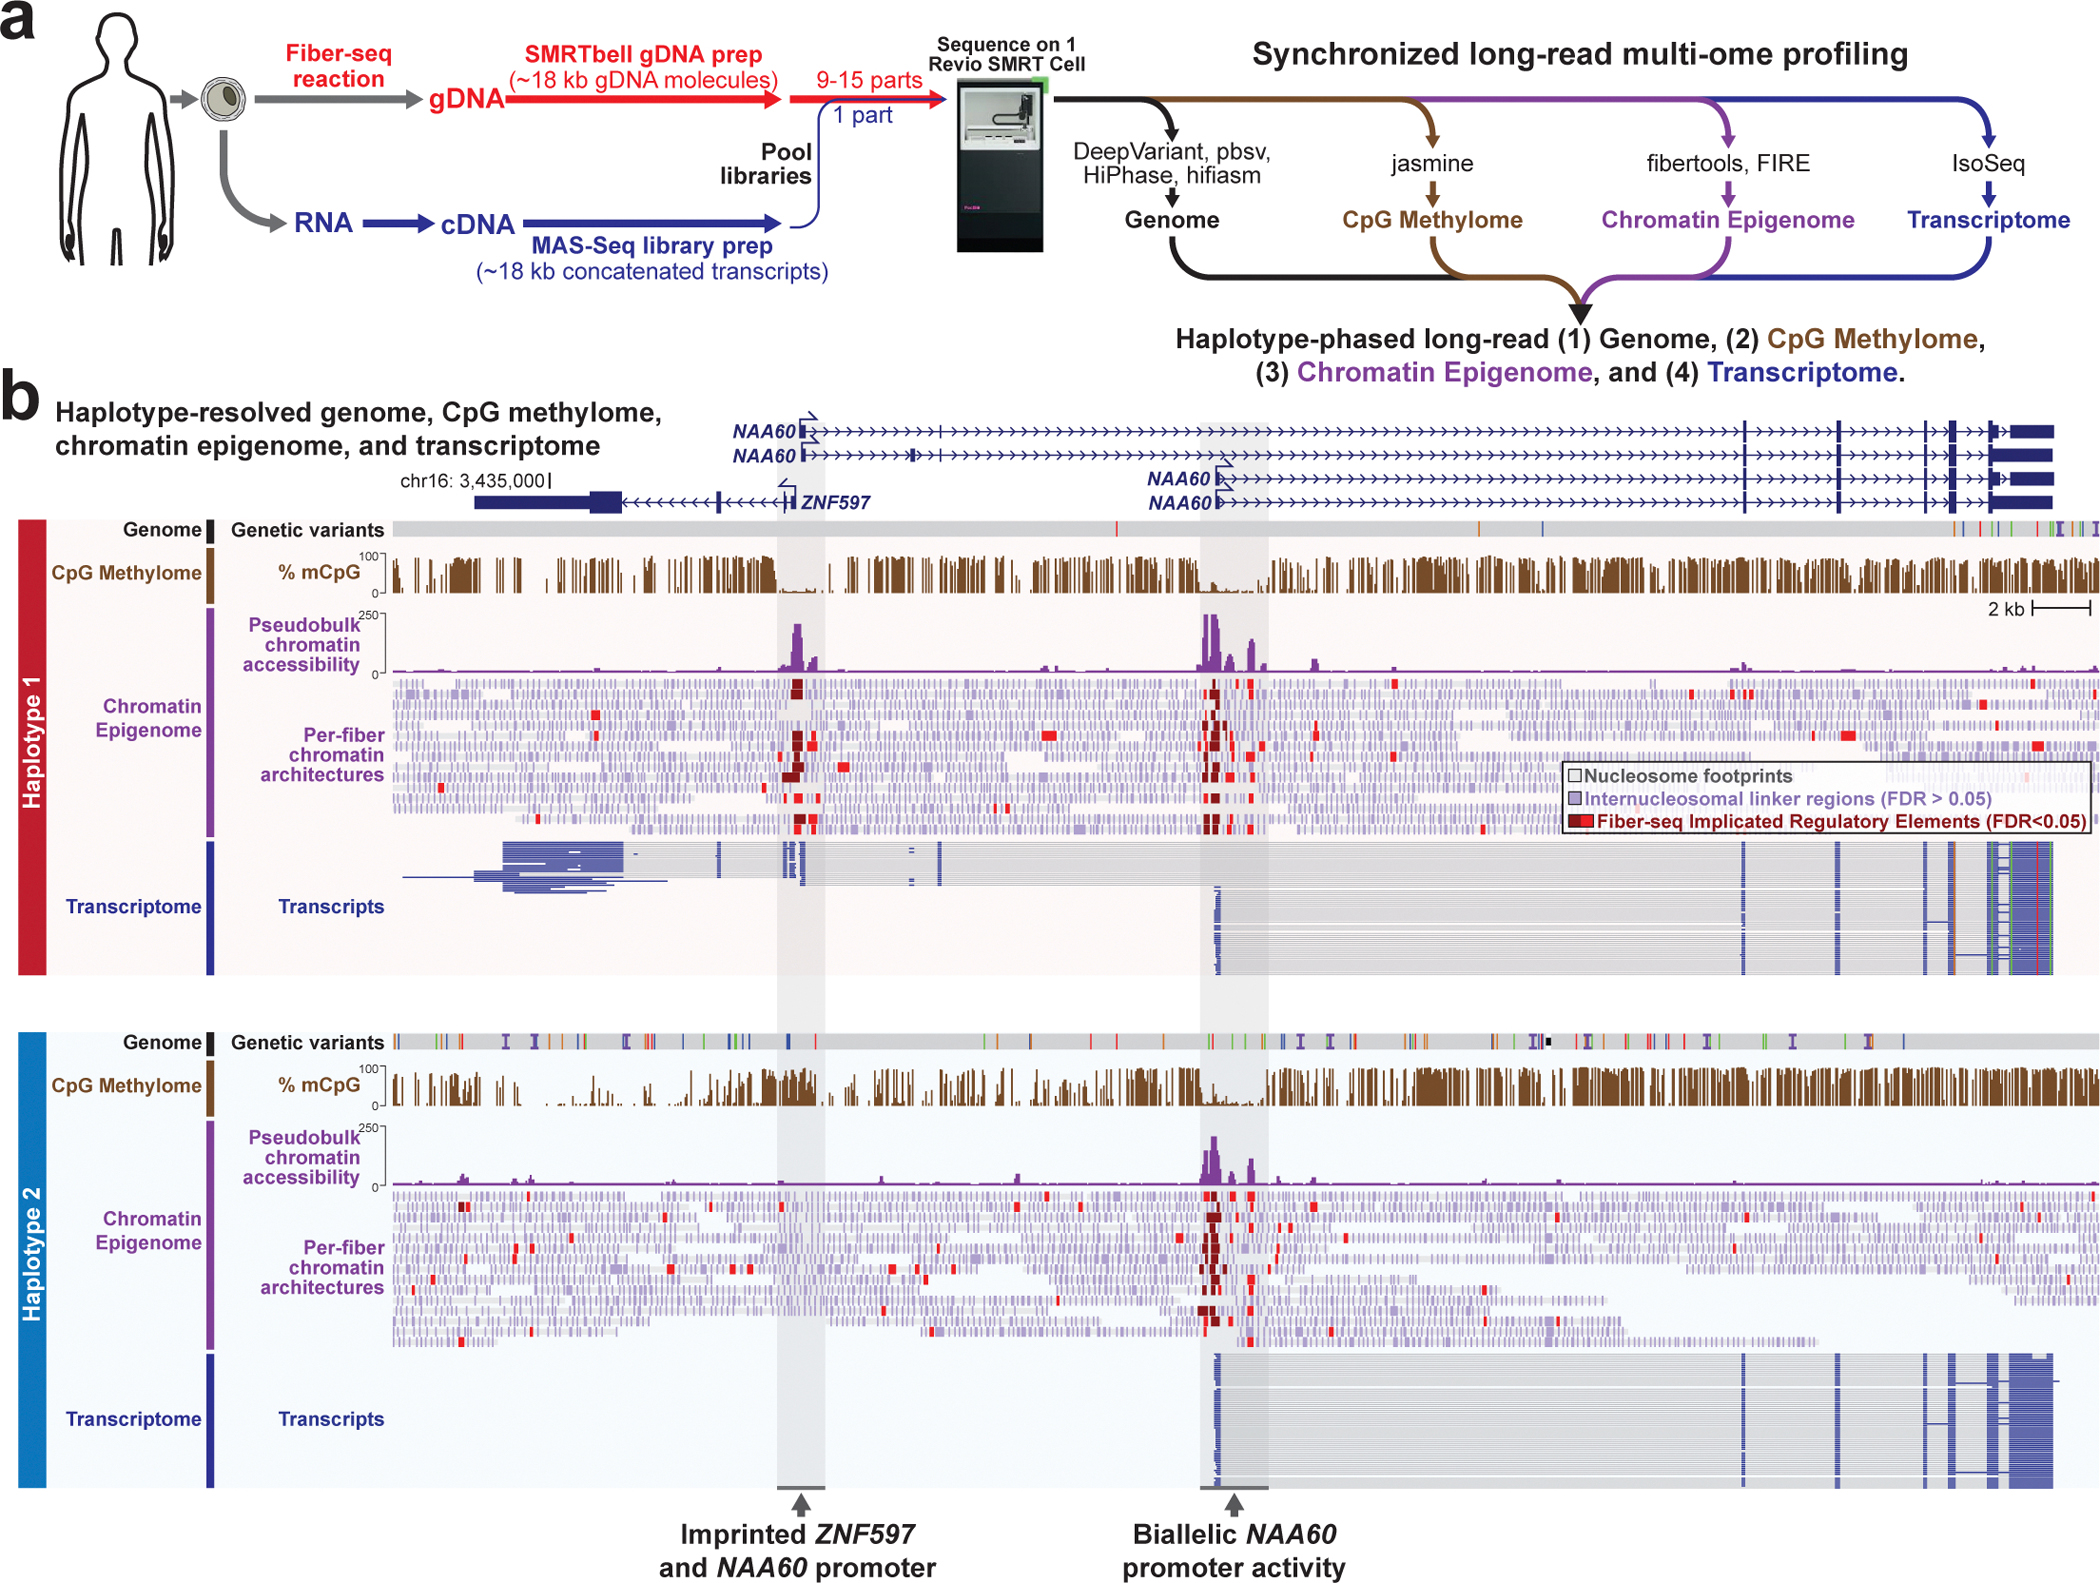
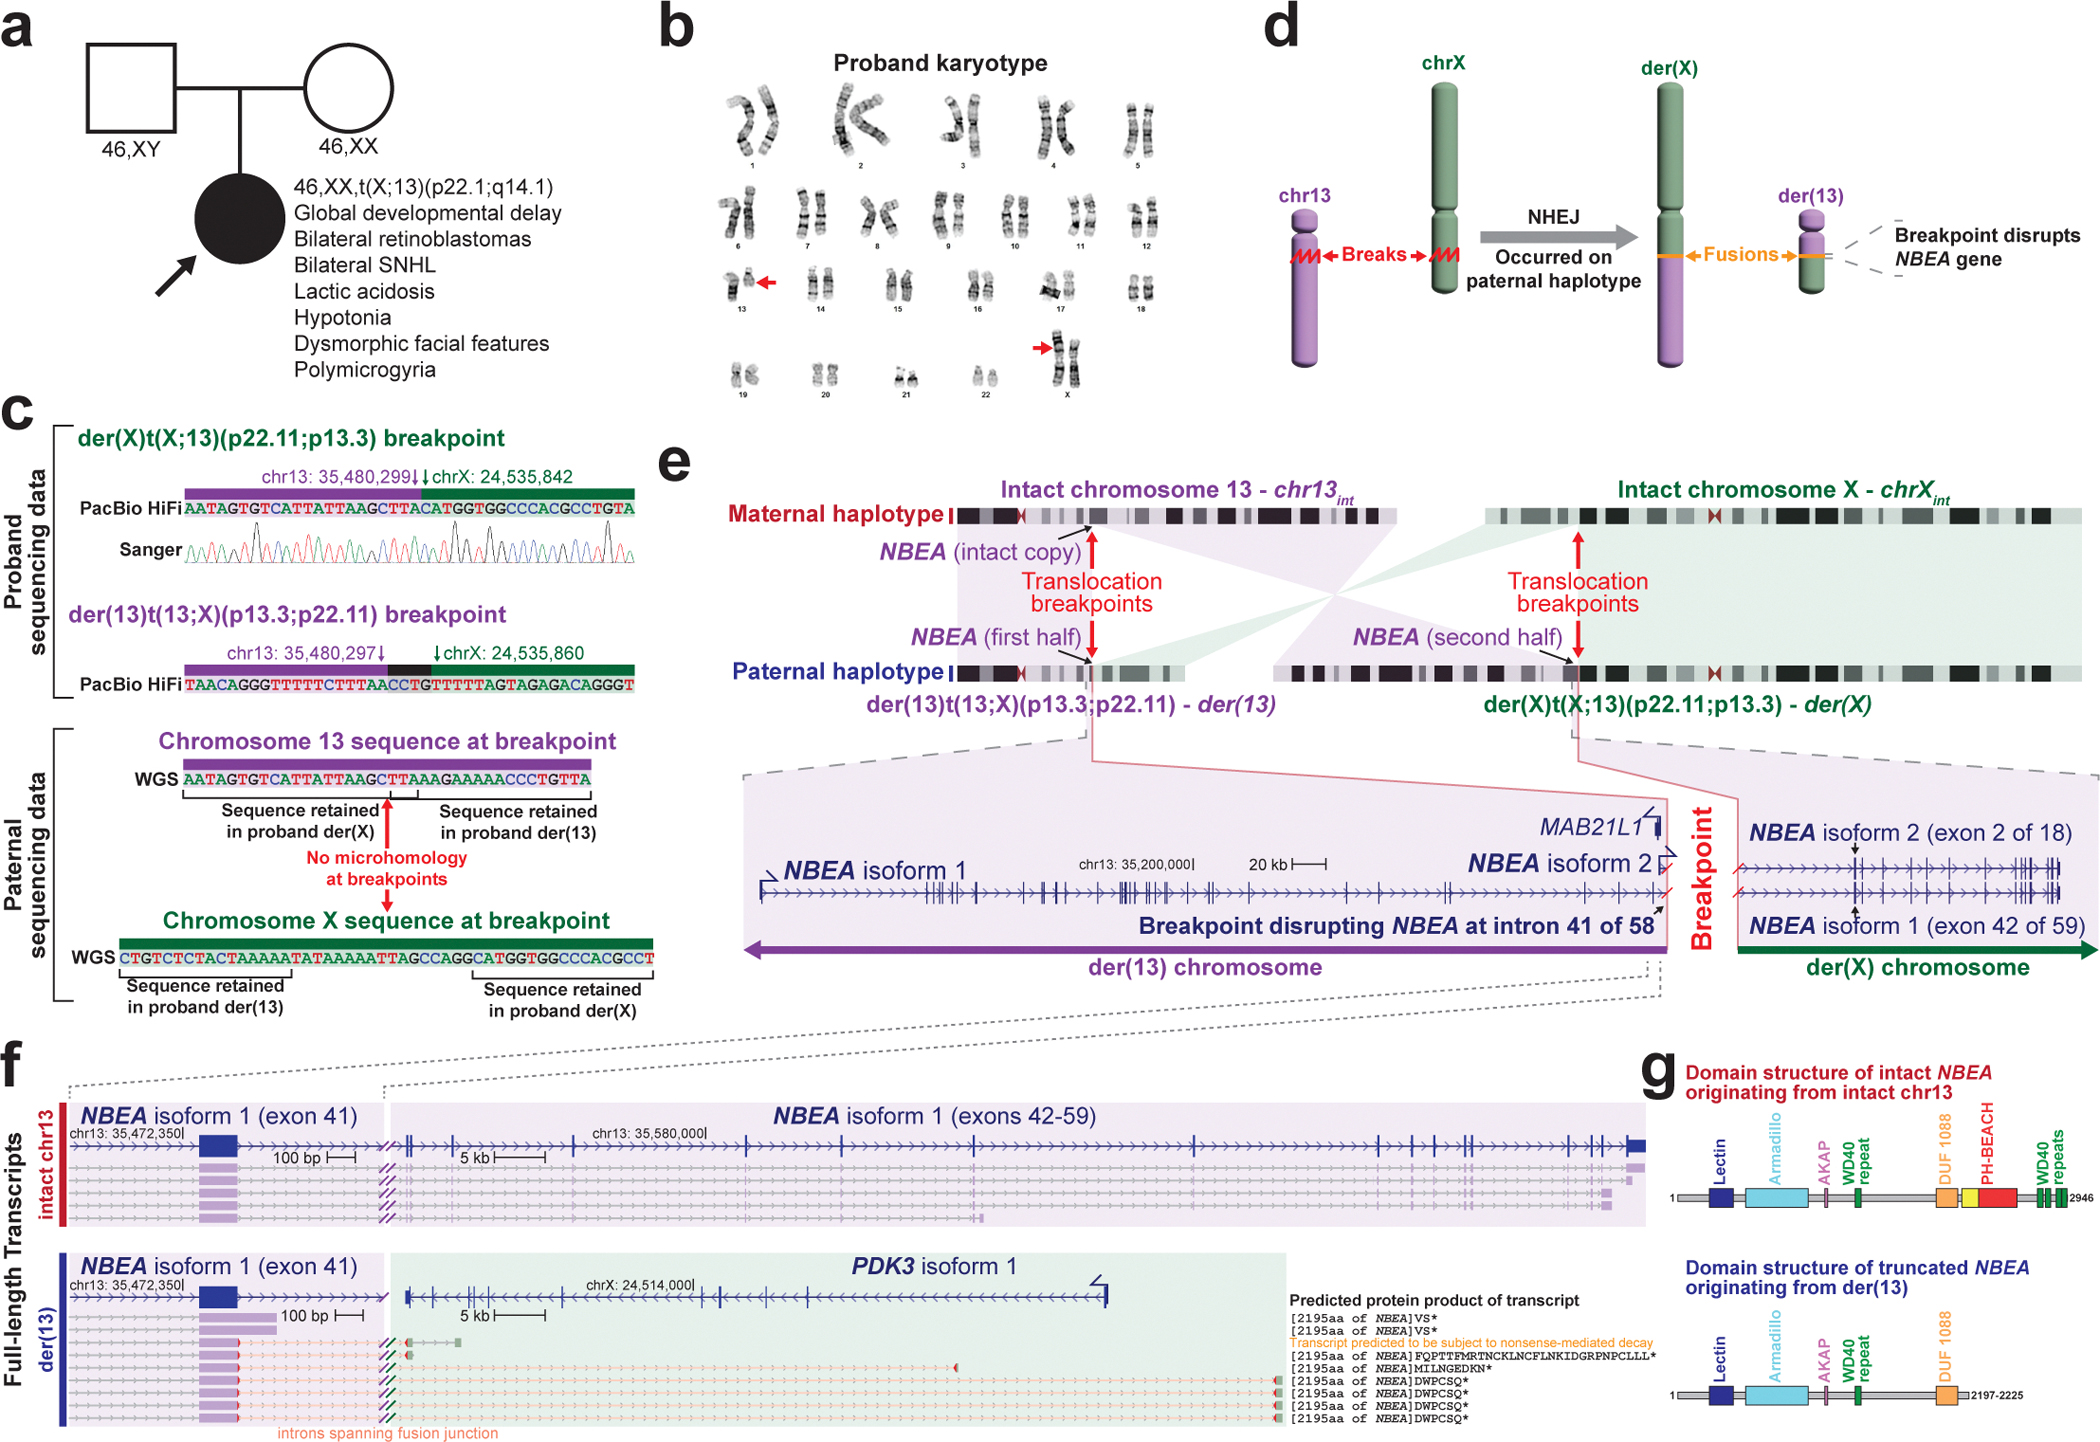
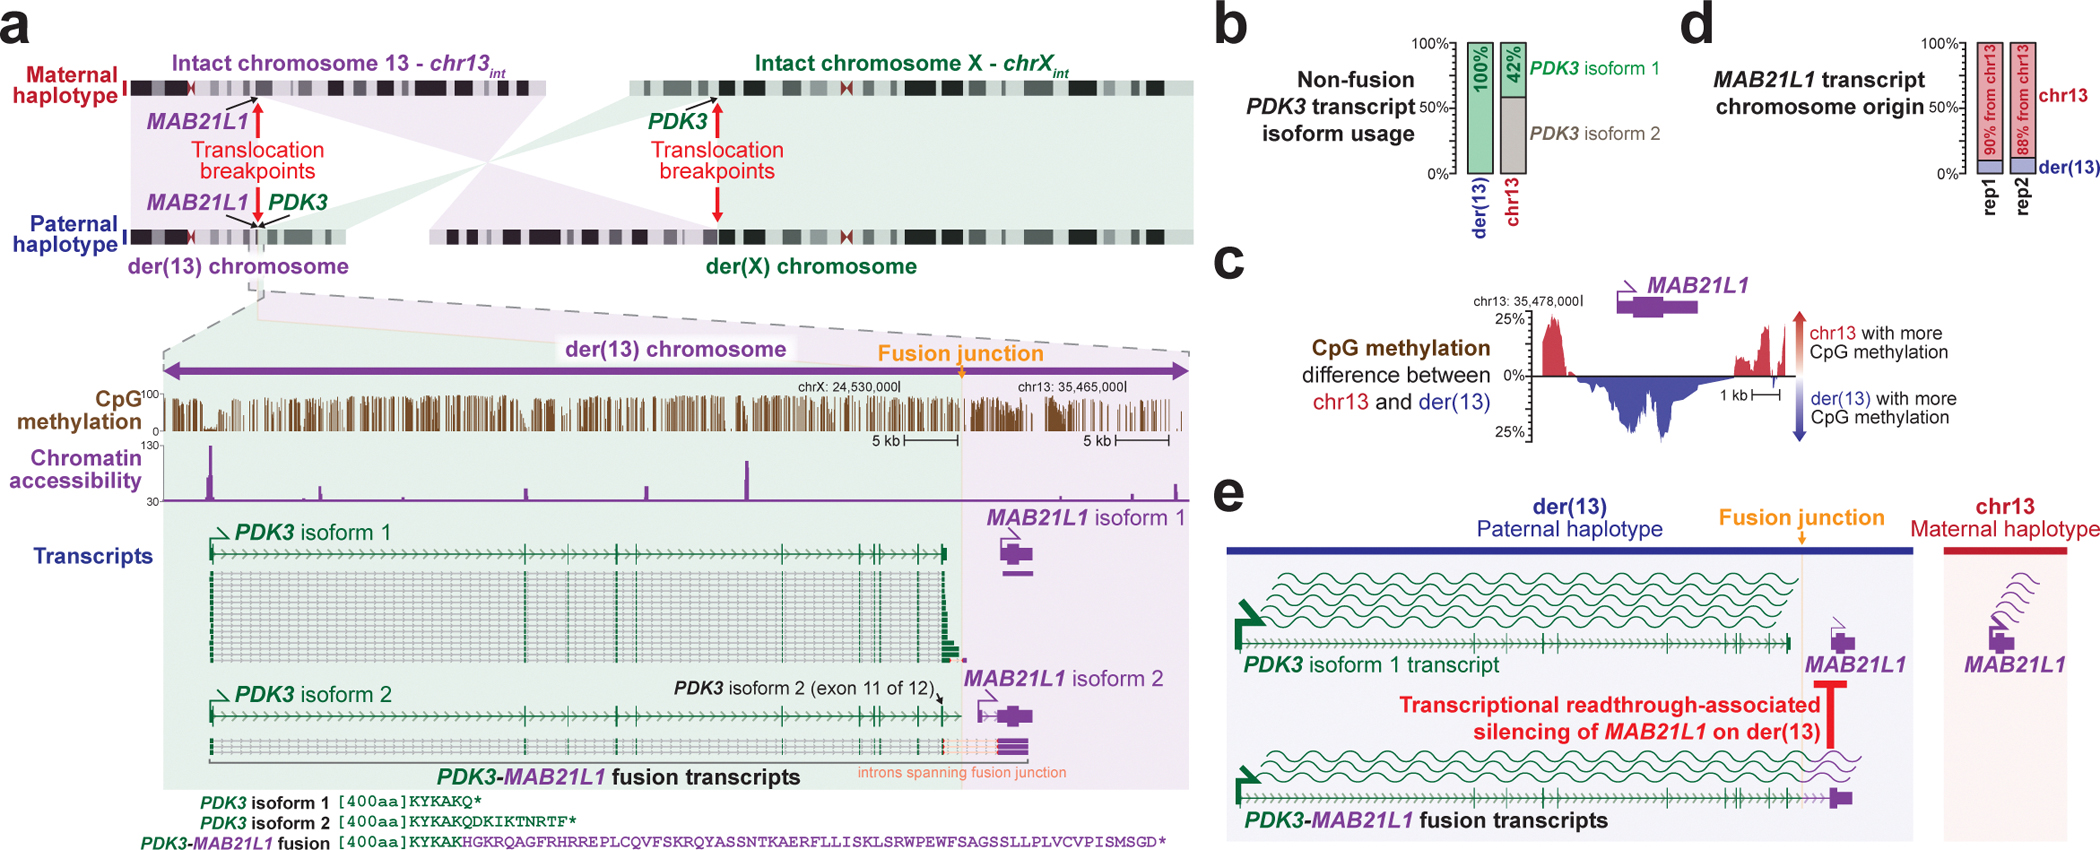
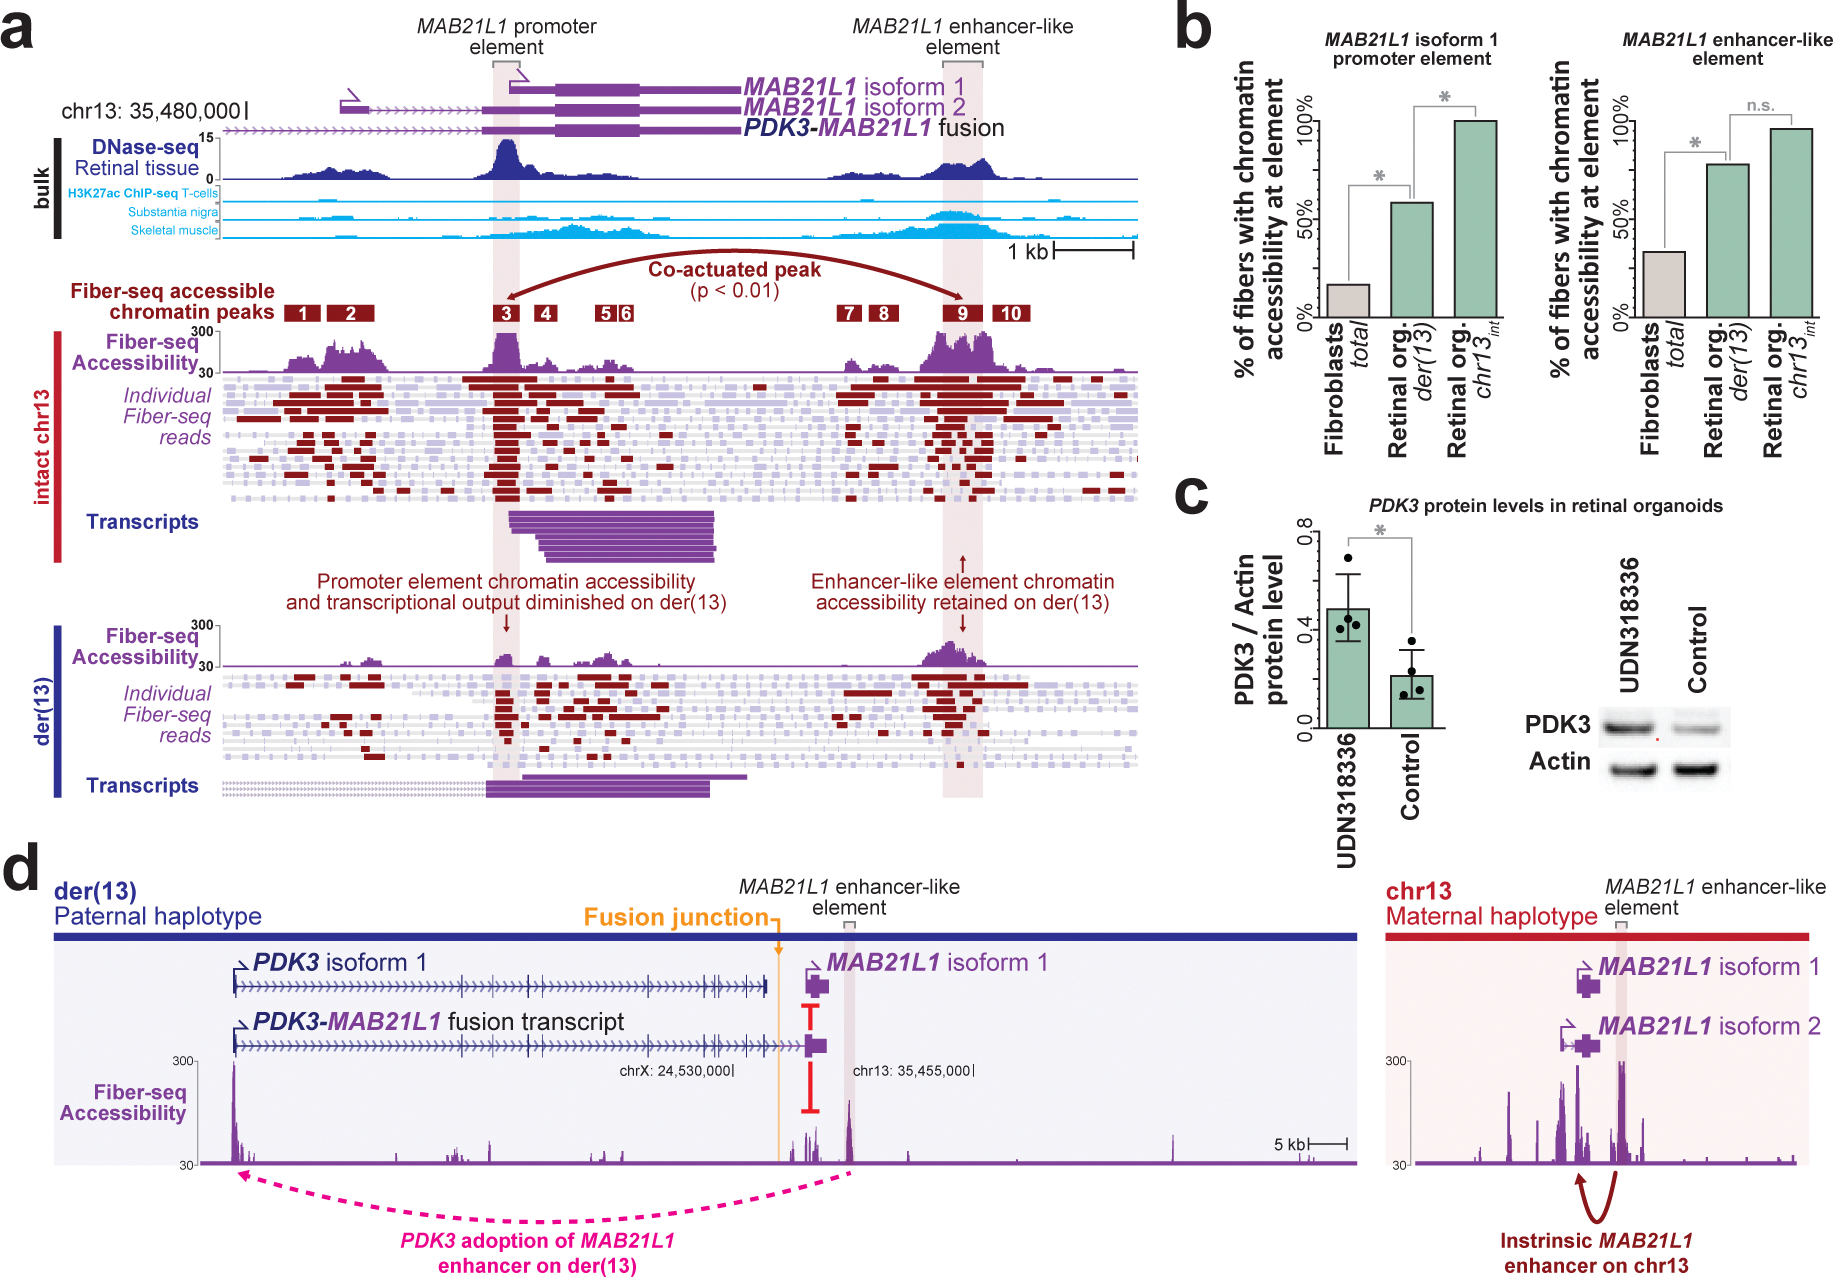
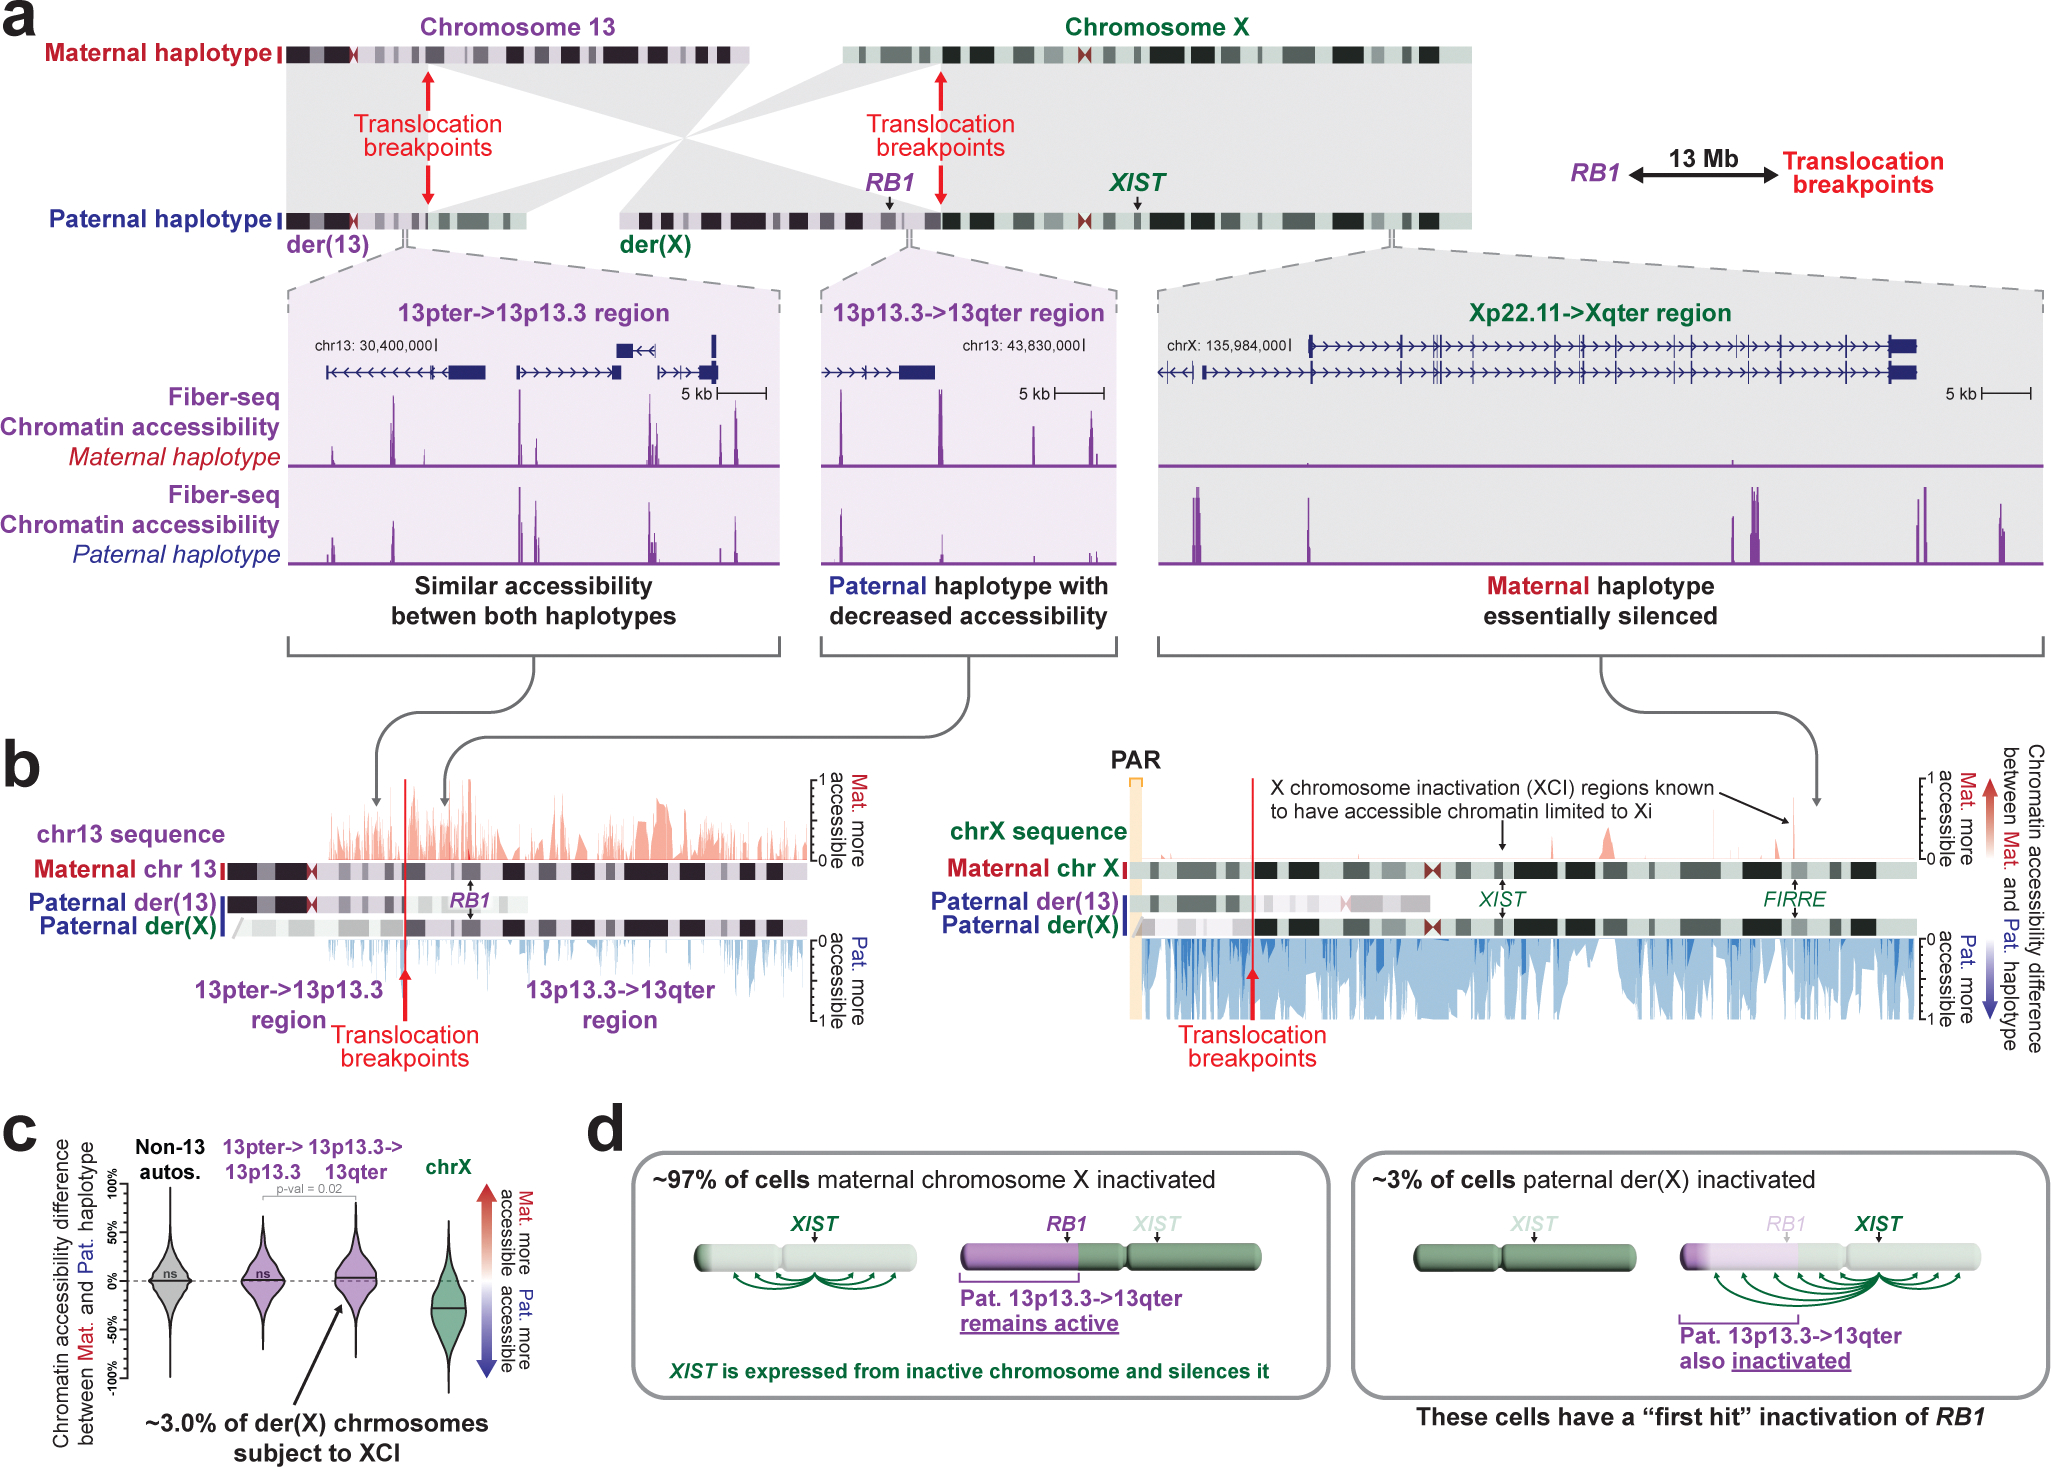
Resolving the molecular basis of a Mendelian condition remains challenging owing to the diverse mechanisms by which genetic variants cause disease. To address this, we developed a synchronized long-read genome, methylome, epigenome and transcriptome sequencing approach, which enables accurate single-nucleotide, insertion-deletion and structural variant calling and diploid de novo genome assembly. This permits the simultaneous elucidation of haplotype-resolved CpG methylation, chromatin accessibility and full-length transcript information in a single long-read sequencing run. Application of this approach to an Undiagnosed Diseases Network participant with a chromosome X;13-balanced translocation of uncertain significance revealed that this translocation disrupted the functioning of four separate genes (NBEA, PDK3, MAB21L1 and RB1) previously associated with single-gene Mendelian conditions. Notably, the function of each gene was disrupted via a distinct mechanism that required integration of the four 'omes' to resolve. These included fusion transcript formation, enhancer adoption, transcriptional readthrough silencing and inappropriate X-chromosome inactivation of autosomal genes. Overall, this highlights the utility of synchronized long-read multi-omic profiling for mechanistically resolving complex phenotypes.


Conflict of interest statement

Competing interests: J.K., J.G.U., C.T.S., A.M.W., M.K. and I.J.M. are full-time employees at PacBio, a company developing single-molecule sequencing technologies. A.B.S. is a co-inventor on a patent relating to the Fiber-seq method (US17/995,058). The remaining authors declare no competing interests.

Figures

Extended Data Fig. 1
Extended Data Fig. 1. IGV view of integrated long-read multi-ome data
IGV view showing an example genomic region for GM12878 (from top to bottom panels) the haplotype-resolved genome, CpG methylome, chromatin, and full-length transcript annotations.
Extended Data Fig. 2
Extended Data Fig. 2. Haplotype-specific chromatin architectures
Volcano plot showing the absolute difference in the % of chromatin fibers with chromatin accessibility for each peak genome-wide between the paternal and maternal haplotypes for GM12878, GM20129, HG02630, and GM24385. Peaks are divided into whether they are present on an autosome, or the X chromosome, with the exception of GM24385, which is 46,XY. P-value was calculated using a two-sided Fisher’s exact test without adjustment for multiple comparisons. Blue dash represents nominal significance line (p<0.05), red dash represents the Benjamini Hochberg FDR correction significance line (FDR<0.05). Peaks corresponding to known imprinted loci with nominally significant scores are denoted by red crosses.
Extended Data Fig. 3
Extended Data Fig. 3. Identification of haplotype-specific chromatin architectures within HLA locus
a, View of single-molecule haplotype-resolved genetic information, CpG methylation information, and chromatin accessibility information for a heterozygous single-nucleotide variant (SNP) identified for GM12878 within the HLA locus. Note that all information is derived from the same sequencing reads. Denoted below is the location of a predicted CTCF binding element, and immediately above it are two fibers that demonstrate single-molecule protein occupancy at this site. b, Quantification of CpG methylation surrounding this SNP (top), as well as the % of fibers with a FIRE element overlapping that SNP (bottom), by haplotype. The box bounds the interquartile range (IQR) divided by the median, and the whiskers extend to the minima and maxima of the data. * top, p-value=0.00077 (one-sided paired t-test without adjustment for multiple comparisons, n=8). * bottom, p-value=0.00061 (one-sided Fisher’s exact test without adjustment for multiple comparisons).
Extended Data Fig. 4
Extended Data Fig. 4. Haplotype-specific chromatin accessibility of NBEA promoter and transcript NMD
a, Per-molecule chromatin accessibility of the NBEA promoter along both the der(13) and intact chr13 chromosomes within patient derived fibroblasts. Chromatin accessibility measured using Fiber-seq. b, Schematic for resolving whether the fusion transcripts are being subjected to nonsense-mediated decay (NMD). Specifically, long-read transcript sequencing was performed on samples before and after treatment with the NMD inhibitor cycloheximide. The libraries were sequenced to similar depths, and the total number of transcripts corresponding to the NBEA-chrX fusion transcripts were quantified in both samples. c, Same as b, but for the PDK3-MAB21L1 fusion transcript.
Extended Data Fig. 5
Extended Data Fig. 5. PDK3 protein levels in patient cells
a, Western blot of phospho-PDH and PDH in HEK293 cells, as well as HEK293 cells containing a viral expression vector for the intact PDK3 protein, or the PDK3-MAB21L1 fusion protein. b, Western blot of PDK3 in HEK293 cells, as well as HEK293 cells containing a viral expression vector for the intact PDK3 protein, or the PDK3-MAB21L1 fusion protein. c, Western blot of PDK3 and actin protein levels in patient derived fibroblasts, as well as control age matched fibroblast cultures and retinal organoids. All experiments in the figure were performed once.
Extended Data Fig. 6
Extended Data Fig. 6. Cell-selective expression of MAB21L1
a, (top) Barplot showing the bulk tissue RNA expression of MAB21L1 (ENSG00000180660) from various GTEx samples are displayed by www.proteinatlas.org. (bottom) Bulk expression of NBEA, MAB21L1, and PDK3 during retinal organoid differentiation as a function of the age of the organoid. TPM - transcripts per million. b, Volcano plot showing the absolute difference in the % of chromatin fibers with chromatin accessibility for each peak genome-wide between the paternal and maternal haplotypes for the retinal organoid Fiber-seq data from UDN318336. The MAB21L1 regulatory elements that are disrupted on der(13) are highlighted in red. Blue dash represents the nominal significance line (p<0.05; two-sided Fisher’s exact test without adjustment for multiple comparisons).
Extended Data Fig. 7
Extended Data Fig. 7. 3C Chromatin interactions between PDK3 promoter and MAB21L1 enhancer
Results from chromatin confirmation capture (3C) experiment using induced pluripotent stem cells (iPSCs) and retinal organoids from UDN318336. For the iPSC 3C experiment, displayed is the relative enrichment of different regions of the PDK3 gene for interactions with the MAB21L1 enhancer. For the retinal organoid 3C experiment, as a limited amount of 3C library was obtained displayed are the qualitative results of qPCR for each of the tested interactions.
Extended Data Fig. 8
Extended Data Fig. 8. PDK3 protein levels in patient retinal organoids and PHD activity in iPSCs
a, Western blot images showing quantification of PDK3, phospho-PDH, PDH, and beta-actin levels in patient-derived retinal organoids, as well as age matched retinal organoids from a separate unaffected and unrelated individual. Data from two separate protein extractions are displayed. Quantification of phospho-PDH to PDH level is shown at bottom. b, Pyruvate dehydrogenase activity assay on iPSCs from UND318336, as well as control iPSCs. Data are presented as mean values +/− SEM and results are from three replicates (n=3). N.s. not significant (p-value = 0.11), unpaired two-sided t-test.
Extended Data Fig. 9
Extended Data Fig. 9. Comparison with prior chromosome X;13 translocations
Ideogram showing the translocation breakpoints and derivative chromosomes for this case, as well as a previously published case who similarly had bilateral retinoblastomas. The translocation breakpoints for the previously published case are estimated based on the karyotype.
Extended Data Fig. 10
Extended Data Fig. 10. Allelic imbalance differences along chr13
a, Swarm plot showing the overall haplotype imbalance in chromatin accessibility along autosomes (except for chromosomes 13 and 14), chromosome X, chromosome 14, and two portions of chromosome 13 within GM12878 and GM24385 cells. P-value calculated using a one-sided Mann-Whitney U-test without adjustments for multiple comparisons. b, Swarm plot showing the overall haplotype imbalance in transcript production along autosomes (except for chromosomes 13 and 14), chromosome X, chromosome 14, and two portions of chromosome 13 within UDN318336 and GM12878 cells. P-value calculated using a one-sided Mann-Whitney U-test without adjustments for multiple comparisons. c, Swarm plot showing the haplotype imbalance in chromatin accessibility at different regions of chromosome 13 in fibroblasts from UDN318336. P-value calculated using a one-sided Mann-Whitney U-test without adjustments for multiple comparisons.
Figure 1 |
Figure 1 |. Synchronized long-read genome, methylome, epigenome and transcriptome sequencing
a, Schematic describing the experimental and computational workflow for synchronized multi-ome profiling. Specifically, cells are subjected to a Fiber-seq reaction followed by genomic DNA extraction and SMRTbell library preparation, and in parallel cells are subjected to an RNA extraction followed by complementary DNA (cDNA) synthesis and MAS-Seq library preparation. The two libraries are then mixed together and sequenced simultaneously using a single sequencing run, enabling the simultaneous detection of the genome, CpG methylome, chromatin epigenome, and transcriptome from the sample. b, Example genomic region showing the haplotype-resolved genome, CpG methylome, chromatin epigenome, and transcriptome from GM12878 cells at a known imprinted locus.
Figure 2 |
Figure 2 |. Long-read multi-ome for resolving the genetic basis of an unsolved Mendelian condition
a, Pedigree for the proband, as well as the clinical features of the proband and the results of her karyotype and that of her parents. b, Image of the proband’s karyotype with the der(13) and der(X) chromosomes marked by red arrows. c, Sequence of the breakpoints on der(X) and der(13), as well as the sequence of this same region in chromosomes 13 and X in her father. Sanger trace showing validation of the der(X) breakpoint junction. d, Schematic showing the breakpoint and fusion event that occurred selectively on the paternal haplotype. e, (top) Idiogram showing the intact chromosomes 13 and X, as well as the derivative chromosomes 13 and X in the proband. Translocation breakpoints, and the location of the gene NBEA are highlighted. (bottom) Gene model for both NBEA isoforms that differ in their transcriptional start site, showing the portion of NBEA that is located on der(13) versus der(X). f, Individual NBEA transcript reads from the intact chr13 and der(13) showing fusion transcripts along der(13), as well as the predicted protein product of each transcript and whether it is predicted to result in NMD. g, NBEA protein domains from NBEA transcripts arising from the intact chr13 or der(13).
Figure 3 |
Figure 3 |. der(13) results in a PDK3-MAB21L1 fusion transcript and MAB21L1 silencing
a, (top) Ideogram showing the intact chromosomes 13 and X, as well as the derivative chromosomes 13 and X in the proband. Translocation breakpoints, and the location of the genes PDK3 and MAB21L1 are highlighted. (bottom) CpG methylation, chromatin accessibility, and full-length transcript data selectively on the der(13) haplotype are displayed, highlighting the formation of a fusion transcript between PDK3 and MAB21L1. b, Relative abundance of non-fusion PDK3 transcripts arising from chr13int and der(13). c, CpG methylation differences at the MAB21L1 promoter between chr13int and der(13) demonstrating selective hyper-CpG methylation of the MAB21L1 promoter along der(13). d, Allelic imbalance of full-length MAB21L1 transcripts between chr13int and der(13) in two long-read transcript sequencing replicates from patient fibroblasts demonstrating silencing of MAB21L1 along der(13). e, Schematic for transcriptional readthrough silencing of the MAB21L1 gene selectively along der(13).
Figure 4 |
Figure 4 |. Placement of a MAB21L1 enhancer-like element adjacent to PDK3 along der(13)
a, MAB21L1 locus showing bulk DNase-seq and H3K27ac ChIP-seq (top), as well as haplotype-resolved Fiber-seq chromatin accessibility and full-length cDNA transcripts from patient-derived retinal organoids (bottom). Single chromatin accessibility peak pair with significant single-molecule co-actuated chromatin accessibility is shown, exposing a downstream enhancer-like element for MAB21L1 isoform 1 promoter. ChIP-seq track ranges are all from 0 to 10 fold change over control. b, Chromatin accessibility of the MAB21L1 isoform 1 promoter, as well as the downstream enhancer-like element in patient-derived fibroblasts and retinal organoids (left), as well as their haplotype-specific accessibility in patient-derived retinal organoids (right). * p-values in order 0.0447, 0.0067, and 0.0088 (one-sided Fisher’s exact test without adjustment for multiple comparisons). c, Bar plot and western blot showing PDK3 and beta-actin protein levels within patient-derived retinal organoids, as well as age-matched control retinal organoids. Data are presented as mean values +/− SEM. * p-value 0.0183 (Unpaired two-sided t-test; n = 4) d, MAB21L1 locus along the der(13) and chr13int chromosomes showing the placement of a strong MAB21L1 enhancer-like element in proximity to the PDK3 promoter selectively along the der(13) haplotype.
Figure 5 |
Figure 5 |. Inappropriate X chromosome inactivation of the RB1 locus along der(X)
a, (top) Idiogram showing the intact chromosomes 13 and X, as well as the derivative chromosomes 13 and X in the proband. Translocation breakpoints, and the location of the genes RB1 and XIST are highlighted. (bottom) Haplotype-resolved chromatin accessibility is displayed for loci across the der(13) and der(X) chromosomes. b, Difference in chromatin accessibility between the maternal and paternal haplotype across loci along chromosome 13 (left) and chromosome X (right). Regions with more red than blue signal have more chromatin accessibility along chr13int versus der(13) or chrXint versus der(X). c, Swarm plot showing the overall haplotype imbalance in chromatin accessibility along autosomes (except for chromosome 13), chromosome X, and two portions of chromosome 13. Specifically, the 13pter->13p13.3 region is present along chr13int and der(13), whereas the 13p13.3->13qter region is present along chr13int and der(X). P-value (0.02) was calculated using a one-sided Mann-Whitney U-test without adjustments for multiple comparisons. d, Model showing inappropriate XCI of the autosomal region along der(X) that contains the RB1 locus as the first hit for the development of bilateral retinoblastomas in this patient.

Update of

Similar articles

Cited by

References

    1. Nurk S et al. The complete sequence of a human genome. Science 376, 44–53 (2022). - PMC - PubMed
    1. Merker JD et al. Long-read genome sequencing identifies causal structural variation in a Mendelian disease. Genet Med 20, 159–163 (2018). - PMC - PubMed
    1. Hiatt SM et al. Long-read genome sequencing for the molecular diagnosis of neurodevelopmental disorders. HGG Adv 2, (2021). - PMC - PubMed
    1. Cohen ASA et al. Genomic answers for children: Dynamic analyses of >1000 pediatric rare disease genomes. Genet Med 24, 1336–1348 (2022). - PubMed
    1. Aganezov S et al. A complete reference genome improves analysis of human genetic variation. Science (1979) 376, (2022). - PMC - PubMed

Methods-only references

    1. Tresenrider A et al. Single-cell sequencing of individual retinal organoids reveals determinants of cell fate heterogeneity. bioRxiv (2023) doi:10.1101/2023.05.31.543087. - DOI - PMC - PubMed
    1. Dubocanin D et al. Single-molecule architecture and heterogeneity of human telomeric DNA and chromatin. bioRxiv 2022.05.09.491186 (2022) doi:10.1101/2022.05.09.491186. - DOI
    1. Poplin R et al. A universal SNP and small-indel variant caller using deep neural networks. Nat Biotechnol 36, 983 (2018). - PubMed
    1. Cheng H, Concepcion GT, Feng X, Zhang H & Li H Haplotype-resolved de novo assembly using phased assembly graphs with hifiasm. Nature Methods 2021 18:2 18, 170–175 (2021). - PMC - PubMed
    1. Akalin A et al. methylKit: a comprehensive R package for the analysis of genome-wide DNA methylation profiles. Genome Biol 13, (2012). - PMC - PubMed

LinkOut - more resources