Review
. 2025 Jun;20(6):1678-1699.
doi: 10.1038/s41596-024-01118-4. Epub 2025 Jan 29.

A multimodal imaging pipeline to decipher cell-specific metabolic functions and tissue microenvironment dynamics

Affiliations
Review

A multimodal imaging pipeline to decipher cell-specific metabolic functions and tissue microenvironment dynamics

Sharavan Vishaan Venkateswaran et al. Nat Protoc. 2025 Jun.

Abstract

Tissue microenvironments are extremely complex and heterogeneous. It is challenging to study metabolic interaction between the different cell types in a tissue with the techniques that are currently available. Here we describe a multimodal imaging pipeline that allows cell type identification and nanoscale tracing of stable isotope-labeled compounds. This pipeline extends upon the principles of correlative light, electron and ion microscopy, by combining confocal microscopy reporter or probe-based fluorescence, electron microscopy, stable isotope labeling and nanoscale secondary ion mass spectrometry. We apply this method to murine models of hepatocellular and mammary gland carcinomas to study uptake of glucose derived carbon (13C) and glutamine derived nitrogen (15N) by tumor-associated immune cells. In vivo labeling with fluorescent-tagged antibodies (B220, CD3, CD8a, CD68) in tandem with confocal microscopy allows for the identification of specific cell types (B cells, T cells and macrophages) in the tumor microenvironment. Subsequent image correlation with electron microscopy offers the contrast and resolution to image membranes and organelles. Nanoscale secondary ion mass spectrometry tracks the enrichment of stable isotopes within these intracellular compartments. The whole protocol described here would take ~6 weeks to perform from start to finish. Our pipeline caters to a broad spectrum of applications as it can easily be adapted to trace the uptake and utilization of any stable isotope-labeled nutrient, drug or a probe by defined cellular populations in any tissue in situ.


Conflict of interest statement

Competing interests: The authors declare no competing interests.

Figures

Figure 1
Figure 1. Using correlative fluorescence microscopy, EM and NanoSIMS analysis to evaluate glucose and glutamine catabolism in specific cells of bi-clonal mammary gland tumours.
(A) Schematic of inducible and traceable mouse model of heterogeneity in breast cancer and experimental workflow used by Kreuzaler et al. (B) Representative panel of region of interest in the bi-clonal tumour with red clones, green clones and macrophages (CD68) identified with confocal fluorescence image analysis (IF). (C) SEM and correlative NanoSIMS nitrogen/carbon isotope ratio images of region of interest with tumour cells and a macrophage (yellow ROI). Isotope ratio images are displayed as a hue saturation intensity (HSI) transformation. The blue hue represents the natural abundance ratios which are 0.37% and 1.1% respectively, while pink hue represents a value of twice the natural ratio in the 12C15N/12C14N and 13C14N/12C14N HSI image. Figure adapted from Kreuzaler et al.
Figure 2
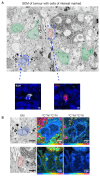
Figure 2. Using correlative fluorescence microscopy, EM and NanoSIMS analysis to evaluate glucose and glutamine catabolism in specific cells of MYC-induced liver tumours.
(A) SEM images with cells of interest (B cells – blue ROI, T cells – red ROI, tumour cells – green ROI) – top panel. B and T cells are identified by confocal fluorescence analysis using fluorescently labled anti-B220 and anti-CD8a antibodies, respectively – bottom panel. (B) Correlative NanoSIMS isotope ratio images (12C15N/12C14N, middle panel, and 13C14N/12C14N, right panel) of the B (blue ROI) and T (red ROI) cells from A. Isotope ratio images are displayed as a hue saturation intensity (HSI) transformation. The blue hue represents the natural abundance ratios which are 0.37% and 1.1% respectively.
Figure 3
Figure 3. Flow diagram showing the steps of the multimodal imaging pipeline (Created with BioRender.com).
Figure 4
Figure 4. Correlating SEM images for NanoSIMS acquisition.
(A) SEM image acquired at high pixel resolution enabling easy digital zooming for fine detail of tissue structure. (B) Corresponding optical image obtained using NanoSIMS CCD camera showing microtomed thin sections and structure within.
Figure 5
Figure 5. Example of ROI selection for quantitative analysis.
(A) SEM image showing a B-cell (blue ROI). (B) 12C14N NanoSIMS image showing ROIs defined in nucleus of the B-cell (green ROIs) and cytoplasm (red ROIs). Similar ROIs are shown for a cancer cell in the top right of the image. (C) Corresponding nitrogen isotope ratio image. 12C15N/12C14N Isotope ratio images displayed as an HIS transformation. The blue hue represents the natural abundance ratio which is 0.37%.
Figure 6
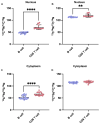
Figure 6. Enrichment of stable isotopes within the intracellular compartments of B cells and CD8 T cells.
(A) Comparison of 12C15N/12C14N isotope ratio of ROIs from the nucleus of B cells and CD8 T cells (n=15 ROIs). (B) 13C14N/12C14N isotope ratio of ROIs from the nucleus of B cells and CD8 T cells (n=15 ROIs). (C) 12C15N/12C14N isotope ratio of ROIs from the cytoplasm and (D) 13C14N/12C14N isotope ratio of ROIs from the cytoplasm of B cells and CD8 T cells (n=20 ROIs). Statistical significance was assessed by unpaired t-test (mean +/- SD,**p<0.01, ****p<0.0001).

Similar articles

  • Comparing Raman and NanoSIMS for heavy water labeling of single cells.
    Schaible GA, Cliff JB, Crandall JA, Bougoure JJ, Mathuri MN, Sessions AL, Atwood J, Hatzenpichler R. Schaible GA, et al. Microbiol Spectr. 2025 Jul;13(7):e0165924. doi: 10.1128/spectrum.01659-24. Epub 2025 May 30. Microbiol Spectr. 2025. PMID: 40445204 Free PMC article.
  • Variation within and between digital pathology and light microscopy for the diagnosis of histopathology slides: blinded crossover comparison study.
    Snead DR, Azam AS, Thirlwall J, Kimani P, Hiller L, Bickers A, Boyd C, Boyle D, Clark D, Ellis I, Gopalakrishnan K, Ilyas M, Kelly P, Loughrey M, Neil D, Rakha E, Roberts IS, Sah S, Soares M, Tsang Y, Salto-Tellez M, Higgins H, Howe D, Takyi A, Chen Y, Ignatowicz A, Madan J, Nwankwo H, Partridge G, Dunn J. Snead DR, et al. Health Technol Assess. 2025 Jul;29(30):1-75. doi: 10.3310/SPLK4325. Health Technol Assess. 2025. PMID: 40654002 Free PMC article.
  • Leveraging a foundation model zoo for cell similarity search in oncological microscopy across devices.
    Kalweit G, Klett A, Silvestrini P, Rahnfeld J, Naouar M, Vogt Y, Infante D, Berger R, Duque-Afonso J, Hartmann TN, Follo M, Bodurova-Spassova E, Lübbert M, Mertelsmann R, Boedecker J, Ullrich E, Kalweit M. Kalweit G, et al. Front Oncol. 2025 Jun 18;15:1480384. doi: 10.3389/fonc.2025.1480384. eCollection 2025. Front Oncol. 2025. PMID: 40606969 Free PMC article.
  • The effect of sample site and collection procedure on identification of SARS-CoV-2 infection.
    Davenport C, Arevalo-Rodriguez I, Mateos-Haro M, Berhane S, Dinnes J, Spijker R, Buitrago-Garcia D, Ciapponi A, Takwoingi Y, Deeks JJ, Emperador D, Leeflang MMG, Van den Bruel A; Cochrane COVID-19 Diagnostic Test Accuracy Group. Davenport C, et al. Cochrane Database Syst Rev. 2024 Dec 16;12(12):CD014780. doi: 10.1002/14651858.CD014780. Cochrane Database Syst Rev. 2024. PMID: 39679851 Free PMC article.
  • Management of urinary stones by experts in stone disease (ESD 2025).
    Papatsoris A, Geavlete B, Radavoi GD, Alameedee M, Almusafer M, Ather MH, Budia A, Cumpanas AA, Kiremi MC, Dellis A, Elhowairis M, Galán-Llopis JA, Geavlete P, Guimerà Garcia J, Isern B, Jinga V, Lopez JM, Mainez JA, Mitsogiannis I, Mora Christian J, Moussa M, Multescu R, Oguz Acar Y, Petkova K, Piñero A, Popov E, Ramos Cebrian M, Rascu S, Siener R, Sountoulides P, Stamatelou K, Syed J, Trinchieri A. Papatsoris A, et al. Arch Ital Urol Androl. 2025 Jun 30;97(2):14085. doi: 10.4081/aiua.2025.14085. Epub 2025 Jun 30. Arch Ital Urol Androl. 2025. PMID: 40583613 Review.

Cited by

References

    1. Kreuzaler P, et al. Vitamin B5 supports MYC oncogenic metabolism and tumor progression in breast cancer. Nat Metab. 2023;5:1870–1886. doi: 10.1038/s42255-023-00915-7. - DOI - PMC - PubMed
    1. Maclachlan C, Sahlender DA, Hayashi S, Molnár Z, Knott G. Block Face Scanning Electron Microscopy of Fluorescently Labeled Axons Without Using Near Infra-Red Branding. Front Neuroanat. 2018;12 doi: 10.3389/fnana.2018.00088. - DOI - PMC - PubMed
    1. Fearns A, Greenwood DJ, Rodgers A, Jiang H, Gutierrez MG. Correlative light electron ion microscopy reveals in vivo localisation of bedaquiline in Mycobacterium tuberculosis–infected lungs. PLoS Biol. 2020;18:e3000879. doi: 10.1371/journal.pbio.3000879. - DOI - PMC - PubMed
    1. de Boer P, Hoogenboom JP, Giepmans BNG. Correlated light and electron microscopy: ultrastructure lights up! Nat Methods. 2015;12:503–513. - PubMed
    1. Arlauckas SP, et al. In vivo imaging reveals a tumor-associated macrophage–mediated resistance pathway in anti–PD-1 therapy. Sci Transl Med. 2017;9 doi: 10.1126/scitranslmed.aal3604. - DOI - PMC - PubMed

Publication types

LinkOut - more resources