. 2025 Feb;638(8050):449-458.
doi: 10.1038/s41586-024-08471-0. Epub 2025 Jan 29.

Bat genomes illuminate adaptations to viral tolerance and disease resistance

Affiliations

Bat genomes illuminate adaptations to viral tolerance and disease resistance

Ariadna E Morales et al. Nature. 2025 Feb.

Abstract

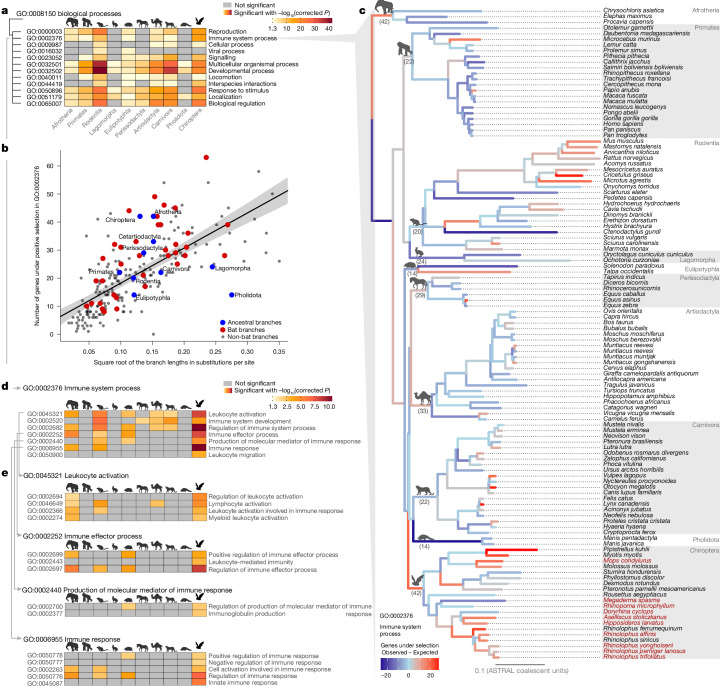
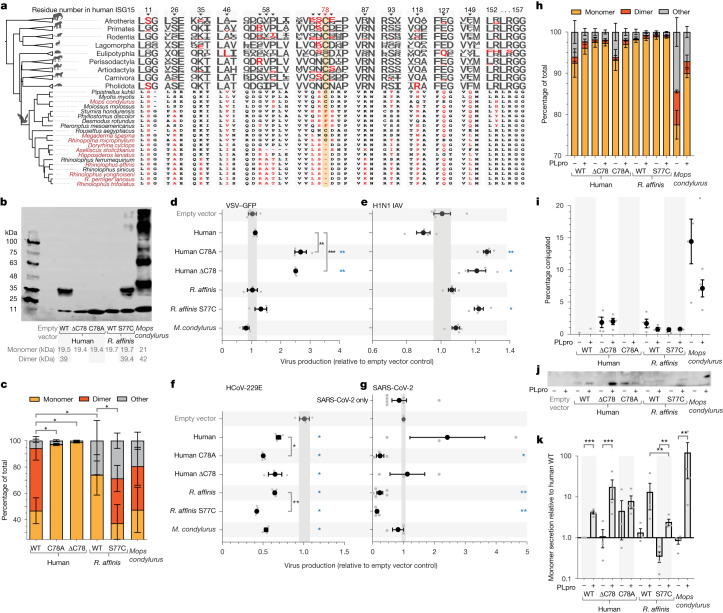
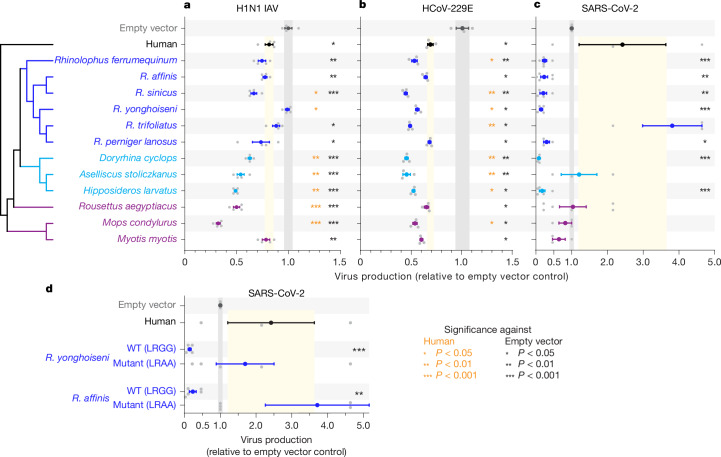
Zoonoses are infectious diseases transmitted from animals to humans. Bats have been suggested to harbour more zoonotic viruses than any other mammalian order1. Infections in bats are largely asymptomatic2,3, indicating limited tissue-damaging inflammation and immunopathology. To investigate the genomic basis of disease resistance, the Bat1K project generated reference-quality genomes of ten bat species, including potential viral reservoirs. Here we describe a systematic analysis covering 115 mammalian genomes that revealed that signatures of selection in immune genes are more prevalent in bats than in other mammalian orders. We found an excess of immune gene adaptations in the ancestral chiropteran branch and in many descending bat lineages, highlighting viral entry and detection factors, and regulators of antiviral and inflammatory responses. ISG15, which is an antiviral gene contributing to hyperinflammation during COVID-19 (refs. 4,5), exhibits key residue changes in rhinolophid and hipposiderid bats. Cellular infection experiments show species-specific antiviral differences and an essential role of protein conjugation in antiviral function of bat ISG15, separate from its role in secretion and inflammation in humans. Furthermore, in contrast to humans, ISG15 in most rhinolophid and hipposiderid bats has strong anti-SARS-CoV-2 activity. Our work reveals molecular mechanisms that contribute to viral tolerance and disease resistance in bats.


Conflict of interest statement

Competing interests: The authors declare no competing interests.

Figures

Fig. 1
Fig. 1. High-quality chromosome-level genome assemblies of ten bat species.
a,b, Percentage of viruses from the family Coronaviridae detected in rodents (left) and bats (right) (a) and in different bat families (b). Pie size is proportional to the number of viral sequences (seqs). Pies n < 50 not shown (Emballonuridae n = 12). c,d, Assembly contiguity visualized as N(x) graphs showing contig (c) or scaffold (d) size for which x% of the assembly consists of contigs or scaffolds of at least that size. New bat assemblies (solid coloured lines) are sorted by contig N50 in the inset legend. e, Status of 18,430 ancestral placental mammalian genes per assembly inferred by TOGA. An excess of genes with missing sequences (grey) indicates lower assembly completeness; an excess of genes with inactivating mutations (premature stop codons, frameshifts, splice-site disruptions and exon or gene deletions; orange) indicates lower base accuracy. f, Phylogenetic placement of newly sequenced species. The timetree was reconstructed for 50 bat species covering 12 families using exon-by-exon alignments of 16,860 orthologous genes. New Bat1K genomes are in orange text. Mya, million years ago. The rodent silhouette was obtained from PhyloPic (phylopic.org). Mus musculus, created by Daniel Jaron under a CC0 1.0 Universal Public Domain licence. The bat silhouette was vectorized by A.E.M.
Fig. 2
Fig. 2. Selection of immune-related genes is most prevalent in bats.
a, Functional enrichments of genes under positive selection in mammalian orders (columns). All high-level GO biological processes were tested (rows), but only terms significantly enriched in at least one order are shown. Coloured cells indicate significant enrichments after multiple test corrections. b, Linear regression model showing a significant correlation between the number of genes positively selected on a branch and the square root of the branch length. The grey shaded area indicates the 95% confidence interval. c, Per-branch signal of immune selection for the 115-mammal phylogeny. Branches are colour-coded according to the difference between the observed and expected number of positively selected ‘immune system process’ genes, calculated from the regression model. New Bat1K genomes are shown in red text. Observed numbers for ancestral branches of mammalian orders are in parentheses. d,e, Enrichments of direct child terms of GO ‘immune system process’ (d) and child terms thereof (e). All animal silhouettes apart from the bat were obtained from PhyloPic (phylopic.org). WT, wild type; C78A, Cys78 to Ala mutation; ΔC78, Cys78 deletion; S77C, Ser77 to Cys mutation. Mus musculus, by Daniel Jaron under a CC0 1.0 Universal Public Domain licence; Gorilla gorilla gorilla by T. Michael Keesey (after Colin M. L. Burnett) under a CC0 1.0 Universal Public Domain licence; Leporidae, by Sarah Werning under a CC BY 3.0 licence; Erinaceus europaeus by Roberto Díaz Sibaja under a CC BY 3.0 licence; Equus ferus przewalskii, by Mercedes Yrayzoz (vectorized by T. Michael Keesey) under a CC BY 3.0 licence; Camelus dromedarius, by Steven Traver under a CC0 1.0 Universal Public Domain licence; Panthera pardus, by Margot Michaud under a CC0 1.0 Universal Public Domain licence; Manis culionensis, by Steven Traver under a CC0 1.0 Universal Public Domain licence. The bat silhouette was vectorized by A.E.M., the Afrotheria (Thai Elephant) silhouette was obtained from OpenClipArt (https://openclipart.org/) under a CC0 1.0 Universal Public Domain licence.
Fig. 3
Fig. 3. Altered dimerization and antiviral capacity of Cys78-mutated ISG15.
a, Alignment of functionally important ISG15 residues. The sequence logos show the protein conservation of mammalian orders. b, Representative western blot of HEK293-subclone-ΔISG15 cells overexpressing Myc-tagged wild-type or mutated ISG15. Lysates were treated with 1,6-bis(maleimido)hexane (BMH) to cross-link disulfide bonds. c, Quantification of ISG15 western blots. Two-tailed t-tests test for differences in dimer formation; n = 4. dg, Viral output, measured by TCID50 (f and g) or a TCID50 surrogate (Crystal Violet absorbance at 450 nm; d and e) in a HEK293-subclone (d), Vero-E6 (e), stable ANPEP-expressing HEK293 cells (f) and stable ACE2-expressing A549 cells (g) that express ISG15 constructs. d, VSV–GFP infection (multiplicity of infection (MOI) of 0.1 for 24 h); n = 3. e, H1N1 PR8 IAV infection (MOI of 0.1 for 48 h); n = 4. f, HCoV-229E infection (MOI of 0.1 for 72 h); n = 3. g, SARS-CoV-2 infection (MOI of 0.1 for 48 h); n ≥ 3 for ISG15, n = 7 for SARS-CoV-2 control. h, Quantification of western blots (Extended Data Fig. 10e) of ISG15-transfected HEK293-subclone-ΔISG15 cells, co-transfected with SARS-CoV-2 PLpro (NSPC3C/L); n = 4. i, Quantification of ISG15 conjugated in cells after PLpro cleavage (matched to h). Decrease in conjugation with PLpro indicates de-ISGylation; n = 4. j, ISG15 released into the supernatant after PLpro cleavage (matched to h). In supernatants, ISG15 is not detected before infection; n = 4. k, Quantification of western blots for ISG15 cleavage and release into the supernatant (example in j), on a logarithmic scale; n = 4. Data are presented as mean (solid oval) and standard error of the mean (s.e.m.) (bars), showing individual data points of biological replicates as grey circles (cg,h,i and k). All quantifications are from independent experiments. Significant differences to vector control (blue asterisks) or wild-type ISG15 (black asterisks) were determined by two-tailed t-tests (*P < 0.05, **P < 0.01, ***P < 0.001). Uncropped images, P values and all data are in Supplementary Data and Supplementary Tables 10, 11, 15, 16 and 18–21. WT, wild type; C78A, Cys78 to Ala mutation; ΔC78, Cys78 deletion; S77C, Ser77 to Cys mutation. All animal silhouettes apart from the bat were obtained from PhyloPic (phylopic.org). Mus musculus, by Daniel Jaron under a CC0 1.0 Universal Public Domain licence; Gorilla gorilla gorilla by T. Michael Keesey (after Colin M. L. Burnett) under a CC0 1.0 Universal Public Domain licence; Leporidae, by Sarah Werning under a CC BY 3.0 licence; Erinaceus europaeus by Roberto Díaz Sibaja under a CC BY 3.0 licence; Equus ferus przewalskii, by Mercedes Yrayzoz (vectorized by T. Michael Keesey) under a CC BY 3.0 licence; Camelus dromedarius, by Steven Traver under a CC0 1.0 Universal Public Domain licence; Panthera pardus, by Margot Michaud under a CC0 1.0 Universal Public Domain licence; Manis culionensis, by Steven Traver under a CC0 1.0 Universal Public Domain licence. The bat silhouette was vectorized by A.E.M., the Afrotheria (Thai Elephant) silhouette was obtained from OpenClipArt (https://openclipart.org/) under a CC0 1.0 Universal Public Domain licence.
Fig. 4
Fig. 4. Species-specific ISG15 conjugation and antiviral function.
ac, Viral output, expressed relative to the empty vector (IRES–mCherry) control, in A549 (a), stable ANPEP-expressing HEK293 (b) and stable ACE2-expressing A549 (c) cells that express ISG15 constructs. a, H1N1 PR8 IAV infection (as per Fig. 3e). A549 cell supernatants titrated on Vero-E6 cells by plaque assays; n = 4. b, HCoV-229E infection (as per Fig. 3f). Viral output was measured by TCID50 in Huh7 cells; n = 3. c, SARS-CoV-2 infection (as per Fig. 3g). Viral output from A549 cells was measured by TCID50 in Vero76 cells; n ≥ 4 for ISG15, n = 7 for SARS-CoV-2 control. d, As c except using wild-type (WT) and LRGG>LRAA ISG15 mutants that remove the ISG15 conjugation motif; n ≥ 5 for LRGG mutations, n = 7 for SARS-CoV-2 control. Graphs represent mean and s.e.m. with individual data points in grey; n refers to independent biological replicates. Significant differences to vector control (black asterisks) or human ISG15 (orange asterisks) were determined by two-tailed t-tests (*P < 0.05, **P < 0.01, ***P < 0.001). All data are given in Supplementary Tables 22–25.
Extended Data Fig. 1
Extended Data Fig. 1. Genome assembly quality and impact on selection screens.
a, PacBio HiFi sequencing improves genome assembly contiguity. UCSC genome browser screenshot showing a 700 kb locus of the human chr20 and genome alignments to six rhinolophid bats (boxes in the alignment net represent aligning sequence and connecting lines deletions or unaligning sequence). The region highlighted in grey does not align between human and Rhinolophus ferrumequinum, because the R. ferrumequinum PacBio CLR-based assembly has a large 421,369 bp assembly gap in this locus. As a result, several genes contained in this locus are missing from this assembly, which contributes to the slightly higher number of missing genes for R. ferrumequinum vs. other rhinolophid bats (Fig. 1e). Consistent with PacBio HiFi-based assemblies often having higher contig N50 and N90 values (Fig. 1c), the other four HiFi-based rhinolophid assemblies have a contiguous sequence in this locus without an assembly gap. Rhinolophus sinicus, which was assembled from Illumina short reads, has 24 smaller assembly gaps with sizes 15–1058 bp in this locus. b-f, Lower assembly quality leads to missed signals of gene selection. To explore the effect of assembly quality on results from genome-wide selection screens, we replaced the high-quality Bat1K assembly (HLrhiFer5) of the Greater horseshoe bat (Rhinolophus ferrumequinum) with a previous short read based assembly (rhiFer1) of the same species that has a higher degree of incompleteness and fragmentation (panel b-d). We kept all other 114 mammalian species and tested if the genes under selection in the R. ferrumequinum branch with the HLrhiFer5 assembly are also under selection when using the rhiFer1 assembly. Similarly, we replaced the Bat1K assembly (HLrouAeg4) of the Egyptian rousette (Rousettus aegyptiacus) with a previous assembly (Raegyp2.0) that used long and short read data but has a smaller contig N50 and an excess of inactivating mutations (indicative of a higher base error rate; see Supplementary Fig. 3). We identified 272 vs. 133 genes under positive selection in HLrhiFer5 vs. rhiFer1, and 299 vs. 194 genes under positive selection in HLrouAeg4 vs. Raegyp2.0, indicating that lower assembly quality hampers the identification of selected genes. To illustrate this, the panels show UCSC genome browser screenshots of five immune-related genes, where we detected positive selection in the Bat1K but not the previous assembly. The first three examples (b-d) show cases where the previous assembly does not cover the gene on a single scaffold and exons are missing because of assembly gaps. The last two examples (e-f) show how assembly problems other than assembly gaps hamper selection screens. b, LAT2 (linker for activation of T cells family member 2), a regulator of T cell activation, is split across two different scaffolds in rhiFer1, as shown by the two alignment chains between human (hg38 assembly) and R. ferrumequinum rhiFer1. Importantly, while other methods can capture only one of these gene fragments at best, TOGA recognizes both alignment chains as orthologous and joins both gene fragments, resulting in a more complete codon alignment. Nevertheless, coding exon 8 (blue highlight) is missing in rhiFer1, thus this exon is missing in the codon alignment. In HLrhiFer5, all exons align to a single scaffold. c, PPP6C (protein phosphatase 6 catalytic subunit), a factor that regulates STING phosphorylation and activation, is split across two scaffolds (alignment chains) in rhiFer1. While TOGA recognizes the red chain as an orthologous fragment of PPP6C, the inset shows that coding exon 1 overlaps an assembly gap in rhiFer1 (but not HLrhiFer5), thus this exon will be missed in the codon alignment. d, The gene locus of FOXP3 (forkhead box P3), a master regulator involved in regulatory T-cell development and function, is split across several scaffolds in rhiFer1. Although the entire coding region is present on a single scaffold (brown chain), the last coding exon overlaps an assembly gap in rhiFer1 and thus will be missed in the codon alignment. e, CD48 (CD48 antigen), a cell surface factor involved in adhesion and activation of adaptive immune cells, lacks an aligning exon 1 in the Raegyp2.0 assembly. Compared to the HLrouAeg4 assembly, Raegyp2.0 lacks ~22,800 bp of sequence and this sequence is also present in other Pteropodid assemblies. This indicates that this ‘deletion’ is likely an assembly error in Raegyp2.0. f, MX1 (MX dynamin like GTPase 1), an interferon-induced antiviral gene, has two orthologous alignment chains that cover the gene. While this apparent ‘duplication’ is likely due to incomplete haplotype purging in Raegyp2.0, it leads TOGA to classify MX1 as a 1:2 ortholog in this assembly and since our screen only considers 1:1 orthologs, this gene is missed in a screen including Raegyp2.0.
Extended Data Fig. 2
Extended Data Fig. 2. Robustness of immune-related enrichments in bats.
a, Heatmaps show enrichments for genes under positive selection for the child terms of high-level GO Biological Processes that are shown in Fig. 2a. Child terms of “immune system process” are shown in Fig. 2d. Enrichment tests for genes under selection in the different mammalian groups (columns) were performed in gProfiler. Only child terms with a significant enrichment in at least one mammalian order are shown. Cells with color indicate a significant enrichment after correcting for multiple testing. Supplementary Table 7 provides the full gProfiler output, including all significant p-values for all groups. b-c, Enrichments of genes under positive selection in four subsampled datasets. To explore whether functional enrichments of positively selected genes in mammalian clades are driven by individual species rather than being representative for the clade Chiroptera, we ran four additional for positive selection by subsampling 65 species from all 115 mammals, as explained in the Methods. In subsample 1–3 (s1-s3), we randomly selected ten of the 20 species in each clade that is represented by 20 species in the full dataset (Chiroptera, Primates, Rodentia, Artiodactyla, Carnivora). Subsample 4 (s4) includes all species left out in subsample 1 from the 20-species clades. Clades with less than 20 species were not subsampled. b, For each mammalian order, bar plots visualize the statistical significance (-log10 corrected p-value) of enrichments for GO:0002376 “Immune System Process” in the four subsamples and in comparison to the full dataset (fifth bar). Importantly, the chiropteran enrichments for “immune system process” are robustly observed across the subsamples, and no other mammalian group exhibits an enrichment as significant as in Chiroptera. c, Enrichments for child terms of “Immune System Process” in four subsampled datasets. Heatmaps at the top summarize enrichments with colored cells representing significant enrichments after correcting for multiple testing. Bar charts shown below visualize the statistical significance as in panel b. Genes positively selected in Chiroptera robustly show a strong enrichment in “Immune Response” and “Regulation of Immune System Process”, where the enrichments are more significant than in any other mammalian group. All animal silhouettes apart from the bat were obtained from PhyloPic (phylopic.org). Mus musculus, by Daniel Jaron under a CC0 1.0 Universal Public Domain licence; Gorilla gorilla gorilla by T. Michael Keesey (after Colin M. L. Burnett) under a CC0 1.0 Universal Public Domain licence; Leporidae, by Sarah Werning under a CC BY 3.0 licence; Erinaceus europaeus by Roberto Díaz Sibaja under a CC BY 3.0 licence; Equus ferus przewalskii, by Mercedes Yrayzoz (vectorized by T. Michael Keesey) under a CC BY 3.0 licence; Camelus dromedarius, by Steven Traver under a CC0 1.0 Universal Public Domain licence; Panthera pardus, by Margot Michaud under a CC0 1.0 Universal Public Domain licence; Manis culionensis, by Steven Traver under a CC0 1.0 Universal Public Domain licence. The bat silhouette was vectorized by A.E.M., the Afrotheria (Thai Elephant) silhouette was obtained from OpenClipArt (https://openclipart.org/) under a CC0 1.0 Universal Public Domain licence.
Extended Data Fig. 3
Extended Data Fig. 3. Correlation between branch length and number of genes under positive selection.
a, Distribution of the number of immune system genes that are under selection in a given number of branches, considering all 228 branches in the 115-species tree. b-e, Dispersion plots show a correlation between different measures of branch lengths and the number of “immune system process” (GO:0002376) genes under positive selection. For branch lengths, we considered b, millions of years taken from our time-calibrated phylogeny inferred using treePL and fossil calibrations (Supplementary Table 4); c, number of substitutions per neutral site estimated from 4D sites using phyloFit; d, number of substitutions per site estimated from coding regions using IQTREE; e, transformed branch lengths as the square-root of the number of substitutions per site estimated from coding regions using IQTREE. These tests robustly show that branch length is significantly correlated with the number of selected immune genes. This likely reflects a higher incidence for episodic positive selection to occur over longer evolutionary time periods and increased power to detect it on longer branches, consistent with previous simulations on few taxa. Akaike’s information criterion (AIC) indicates that the model in (E) fits the data best (Supplementary Table 9). f-i, Model selection with one or two slopes and/or intercepts. To determine whether the number of immune genes under selection is higher in bats than in other mammals, we introduced a categorical variable, corresponding to taxonomy (bats and non-bats) and fit a series of negative binomial regressions where two intercepts and two slopes would be allowed in the models. f, negative binomial, two-intercept model of square-root transformed millions of years from a time-calibrated phylogeny inferred using treePL and fossil calibrations (Supplementary Table 4). g, negative binomial, two-intercept and two slope model of square-root transformed millions of years from a time-calibrated phylogeny inferred using treePL and fossil calibrations (Supplementary Table 4). h, negative binomial, two-intercept model of number of substitutions per neutral site estimated from 4D sites using phyloFit. i, negative binomial, two-intercept model of number of substitution per site estimated from coding regions using IQTREE. The best-fit model shown in panel e has two intercepts corresponding to bats and non-bats, but a single slope. These results robustly show that bats have a higher number of immune-related genes under positive selection. While we applied the regression model specifically to immune-related genes, this approach could be a generally-applicable strategy to reveal lineages (branches) having an excess of selection on genes belonging to particular functional categories.
Extended Data Fig. 4
Extended Data Fig. 4. Positive selection in SARS-CoV-2-related pathways and per-branch signal of selection for all and immune response genes.
a, Genes under positive selection in SARS-CoV-2 related pathways. Absolute number of genes under positive selection in different mammalian orders (defined as at least one branch having a significant p-value) that are involved in pathways with relevance for SARS-CoV-2 and COVID-19. Pathway data was taken from WikiPathways (https://www.wikipathways.org/pathways/WP5039.html, https://www.wikipathways.org/pathways/WP5115.html), Reactome (https://www.reactome.org/content/detail/R-HSA-9679191), and KEGG pathways (https://www.genome.jp/pathway/hsa05171), last accessed on July 20th, 2022. Chiroptera consistently have the highest number of selected genes in these gene sets. We list all mammalian orders here for completeness, but it should be noted that five orders (Primates, Rodentia, Artiodactyla, Chiroptera, Carnivora) are represented by 20 species and thus have more branches than other orders. b-c, Per-branch signal of selection for all genes and genes annotated as “Immune Response” (GO:0006955) on the phylogeny for 115 mammals. Branches are color-coded based on the difference between the observed and expected number of selected genes in the gene set. The color scale indicates negative residual values (less genes under selection than expected) in blue and positive residual values (more genes than expected) in red per branch. Expected numbers were calculated from the regression models shown in Supplementary Tables 8-9. Ancestral branches for mammalian orders are indicated with icons. New Bat1K genomes are in red font. b, Considering all genes included in our screen without selecting a functional category shows no excess of selected genes in bats and on the ancestral Chiroptera branch. c, Considering genes annotated with the GO term “Immune Response” shows that the ancestral Chiroptera branch has the highest excess of selected “Immune Response” genes, substantiating the results for “Immune System Process” (Fig. 2c). All animal silhouettes apart from the bat were obtained from PhyloPic (phylopic.org). Mus musculus, by Daniel Jaron under a CC0 1.0 Universal Public Domain licence; Gorilla gorilla gorilla by T. Michael Keesey (after Colin M. L. Burnett) under a CC0 1.0 Universal Public Domain licence; Leporidae, by Sarah Werning under a CC BY 3.0 licence; Erinaceus europaeus by Roberto Díaz Sibaja under a CC BY 3.0 licence; Equus ferus przewalskii, by Mercedes Yrayzoz (vectorized by T. Michael Keesey) under a CC BY 3.0 licence; Camelus dromedarius, by Steven Traver under a CC0 1.0 Universal Public Domain licence; Panthera pardus, by Margot Michaud under a CC0 1.0 Universal Public Domain licence; Manis culionensis, by Steven Traver under a CC0 1.0 Universal Public Domain licence. The bat silhouette was vectorized by A.E.M., the Afrotheria (Thai Elephant) silhouette was obtained from OpenClipArt (https://openclipart.org/) under a CC0 1.0 Universal Public Domain licence.
Extended Data Fig. 5
Extended Data Fig. 5. Immune-related genes under positive selection in bats.
a, Biological processes involved in immune responses triggered by viral infections. b-f, Schematic showing how ISG15 and genes selected in bats are involved in viral entry into cells and detecting viral patterns (b), regulating antiviral and inflammatory responses (c-d), B cell signaling (e), and activation of the complement system (f). Genes positively-selected in the ancestral branches of Chiroptera (white font), Rhinolophidae–Hipposideridae (yellow font), or Rhinolophidae (orange font) have a blue background. Genes highlighted in panels b-d are described in the main text. e, Inflammation triggers the release of chemokines that direct the migration of leukocytes to sites of infection. GO ‘leukocyte migration’ (GO:0050900, Pcor = 0.0016) is only enriched for genes selected in bats. We identified selection in two CC chemokine receptors, CCR2 (repeatedly selected in Chiroptera, Rhinolophidae–Hipposideridae and Rhinolophidae) and CCR5 (selected in Rhinolophidae–Hipposideridae) that promote the infiltration of pro-inflammatory cells,. Importantly, CCR2 and CCR5 are located in a major risk locus for severe COVID-19 that contains SNPs linked to increased CCR2/5 expression. Consistent with CCR2/5 mediated hyperinflammation, CCR2/CCR5 receptor antagonists can reduce cytokine storms in patients with severe COVID-19 (ref. ). The GO term ‘lymphocyte activation’ (GO:0046649, Pcor = 2.46 × 105) has the most significant enrichment for genes under selection in bats, which includes two key factors for B cell signaling, CD79A (selected in Rhinolophidae–Hipposideridae) and BTK (described in the main text). CD79A is the signal transduction subunit of the B cell antigen receptor that upon phosphorylation mediates BTK phosphorylation,. Activated BTK promotes B cell receptor mediated survival of B cells. f, The complement system helps to phagocytose or lyse pathogens, stimulates adaptive immunity and inflammation, but excessive complement activation can lead to hyperinflammation and thrombosis during COVID-19. GO ‘Regulation of immune effector process’ (GO:0002697, Pcor = 1.55 × 108; Fig. 2e), ‘Complement system’ (WikiPathways WP2806, Pcor = 8.92 × 108) and ‘Complement and coagulation cascades’ (KEGG:04610, Pcor = 0.0003; Supplementary Table 7) have the most significant enrichment for genes selected in bats. We detected two complement components, C7 and C1S (both under selection in Rhinolophidae–Hipposideridae). C1S encodes a serine protease involved in early activation of the classical pathway. C7 is a component of the membrane attack complex that forms membrane-disrupting pores and, when endocytosed, activates noncanonical NF-κB signaling and inflammasome assembly. Pictograms of cellular elements were custom-drawn.
Extended Data Fig. 6
Extended Data Fig. 6. Conformations of putative dimers of ISG15 for human, Doryrhina cyclops, and Rhinolophus sinicus.
We used structural modeling to explore whether the Cys78 deletion affects homodimer formation of bat ISG15. We hypothesize two alternative outcomes. A stable homodimer will not be formed if we delete Cys78 due to the removal of the disulfide bond. Alternatively, stable homodimers might still form if the dimeric interface is maintained by compensating sets of non-covalent interactions (e.g., hydrogen bonds, hydrophobic interactions). To test these hypotheses, we initially performed 3D structural modeling using AlphaFold2 and compared the putative ISG15 homodimers of human and four bats lacking Cys78 (Supplementary Fig. 16). However, the AlphaFold models showed discrepancies between the dimeric interface confidence scores generated and previous experimental studies for human ISG15,, as well as predicted variations in stability between the bat species (Supplementary Fig. 16); therefore we evaluated the stability of predicted dimers by molecular dynamics simulations shown in this figure. We conducted three replicate simulations of 1 μs for human ISG15 and for ISG15 of one representative rhinolophid and hipposiderid bat (total duration 3 μs, about 550,000 CPU hours for each species) (Supplementary Figs. 17-18 show the simulation boxes and equilibration phase). a-c, Conformations of putative dimers of human (a), Doryrhina cyclops (b), and Rhinolophus sinicus (c) ISG15. The dimer that was estimated with AlphaFold is circled, whereas the other dimers are major conformations, observed during molecular dynamics simulations (see Methods). Helices are shown in cyan, whereas β-strands in red. The percentages correspond to the proportion of each conformation across the simulations. The figure was rendered with UCSF ChimeraX v.1.2. a, Both major conformations are very similar to the AlphaFold predicted conformation. Importantly, while the monomers slightly rotate around the disulfide bond, the Cys78-mediated disulfide bond is sufficient to maintain a dimeric interface with a highly similar conformation, indicative of a stable dimer (see also Supplementary Videos 1–3). The molecular dynamics simulation results of human ISG15 are consistent with experimental studies, and serve as a positive control as the disulfide bond cannot be broken in the simulation. b, If a stable dimer would exist, we would expect to observe a single dominant structural conformation, or several conformations that are highly similar, as observed for human ISG15. In contrast, for D. cyclops ISG15, the lack of the disulfide bond appears to result in an unstable dimer that adopts a range of conformations, showing remarkable differences in the spatial arrangement of the monomers (see also Supplementary Videos 4–6). c, As for D. cyclops ISG15, the lack of the Cys78-mediated disulfide bond appears to consistently result in an unstable dimer that adopts two major conformations that differ considerably in the spatial arrangement of the monomers, both from each other and from the starting AlphaFold structure (see also Supplementary Videos 7–9). This result was observed both at physiological (top) and at salt concentrations as low as required to neutralize the system (middle) for a comparable simulation time of up to 0.5 μs, indicating that different salt concentrations consistently result in unstable dimers. Comparing low salt conditions for a simulation time of 0.5 vs. 1 μs (middle vs. bottom), we found even larger structural differences between the major conformations, which is consistent with the expectation that as the simulation time increases, unstable dimers would increasingly deviate from the initial structure. Overall, these tests also indicate that our results are robust to variation in the salt concentration used in the simulations.
Extended Data Fig. 7
Extended Data Fig. 7. Snapshots of the dimeric ISG15 interface during molecular dynamics simulations performed with a low salt concentration.
a, Rhinolophus sinicus ISG15; b, Doryrhina cyclops ISG15. While the three simulations initially exhibit highly similar dimeric interfaces, because the starting point is the same AlphaFold-predicted dimer after energy minimization and equilibration, the interfaces increasingly deviate from each other as simulation time increases, indicative of an unstable dimer. See also Supplementary Videos 4–9. The figure was rendered with PyMOL v. 2.5.0.
Extended Data Fig. 8
Extended Data Fig. 8. ISG15 effects on VSV cellular entry and replication, and cell viability.
To examine how human and various Cys78-lacking bat ISG15 constructs affect VSV entry and replication and cell viability, we synthesized in addition to Rhinolophus affinis ISG15 from five additional rhinolophid (R. perniger lanosus, R. yonghoiseni, R. sinicus, R. trifoliatus, R. ferrumequinum) and three hipposiderid bats (Aselliscus stoliczkanus, H. larvatus, Doryrhina cyclops). a, Viral entry, quantified as the percentage of VSV-GFP positive cells. HEK293 cells were transiently transfected with ISG15 constructs and infected with VSV-GFP. GFP-positive cells after 16 h infection with an MOI of 0.01 were measured by FACS, examining mCherry (or transfected) cells only. The percentage of GFP-positive cells is shown for three separate experiments (n > 10,000 cells each). Data is presented as mean (solid oval) and standard deviation (bars) with individual data points for the three biological replicates displayed as grey circles. Grey and light yellow backgrounds indicate empty vector and human, respectively. All ISG15 proteins reduce viral entry, with the exception of R. trifoliatus where the effect is not significant compared to the empty vector. Notably, viral entry differs substantially between ISG15 of different rhinolophid and hipposiderid bats. For example, ISG15 of R. yonghoiseni / R. trifoliatus / R. perniger lanosus (comprising a phylogenetic clade) had a significantly reduced ability to block viral entry compared to human ISG15. Because ISG15 of all rhinolophid and hipposiderid bats lacks Cys78 (Fig. 3a), this indicates that other amino acid mutations apart from the shared Cys78 deletion alter ISG15 function. P-values and raw data are in Supplementary Table 12. b, Viral replication, measured by GFP intensity during early infection stages. Viral load for the data shown in Fig. 3d, measured by mean fluorescence intensity (VSV-GFP) in HEK293 cells transiently transfected with ISG15 (IRES-mcherry) constructs, relative to the control vector (no ISG15). Data are presented as mean (solid oval) and standard deviation (bars) with individual data points of three biological replicates shown as grey circles. P-values and raw data are in Supplementary Table 13. c, ISG15 of some bats affects growth of uninfected HEK293 cells. Since we observed large differences between initial infection, intracellular viral load and final viral release into the supernatant, we additionally examined cell viability in the presence of ISG15. The panel shows FACS measurements of Ki-67, a cellular marker for proliferation, in HEK293 cells that were stably transfected with the various ISG15 constructs. Measurements were taken at 16 h post-infection and are normalized to the 0 h timepoint and the vector control. Thus, values > 1 indicate an increase in cell growth compared to the vector control. Three biological replicates are indicated by grey dots and black bars show standard error per treatment. P-values and raw data are in Supplementary Table 14. For uninfected cells (light blue bars), expression of human ISG15 and ISG15 of A. stoliczkanus, R. ferrumequinum and R. sinicus leads to a significant decrease in cell growth, compared to the vector control. In contrast, expression of ISG15 of the six other bats (D. cyclops, H. larvatus, R. affinis, R. yonghoiseni, R. trifoliatus, and R. perniger lanosus) results in a significantly increased growth of uninfected cells, showing that ISG15 of some bats positively affects cell growth in the absence of viral infection. Furthermore, ISG15 of six bats induces a significantly higher cell growth compared to human ISG15, while A. stoliczkanus ISG15 induces a significantly lower cell growth. For cells infected with GFP-VSV (red bars), none of the differences are significant when comparing bat to human ISG15. Human ISG15 was, however, still significantly different between infected and uninfected (p = 0.0017). Unlike human, several bats show large decreases in proliferation between uninfected and infected cells, indicating different dynamics inside the cell during virus replication. Furthermore, the basal increase in proliferation may have a substantial consequence on later virus production by allowing cells to continue producing higher amounts of virus prior to cell death, or by altering the basal immune state, possibly explaining a reduced effect of human or bat wildtype ISG15 in blocking VSV production. a-c, Significant differences to the vector control or to human ISG15 were determined with a two-tailed t-test and is indicated with * P < 0.05, ** P < 0.01, *** P < 0.001. New Bat1K genomes are indicated in bold font.
Extended Data Fig. 9
Extended Data Fig. 9. Effect of ISG15 Cys mutants on ISG expression and NFκB / IFN signaling.
a, ISG15 Cys mutants do not alter ISG expression during H1N1 PR8 Influenza A virus (IAV) infection or ISG15 supernatant treatment in epithelial cells. To investigate why mutating or deleting Cys78 from human ISG15 and restoring Cys78 in R. affinis ISG15 significantly increased IAV production, we tested whether the ISG15 Cys mutants but not wildtype ISG15 impacted IRF3 activation (known to be modulated by ISG15), IFN production, and induction of key antiviral interferon-stimulated genes (MX1 and IFIT1). IAV was infected at an MOI of 0.1 for 48 h after transfection with wildtype ISG15 constructs and ISG15 Cys78 mutants (indicated on right). The representative western blot shows that IAV infection causes some IRF3 activation and only minimal MX1 or IFIT1 protein induction in Vero-E6 cells when transfected with an empty vector or most ISG15 constructs. While R. affinis S77C induced more MX1 and IFIT1, this did not alter IAV production (Fig. 3e), indicating minimal effect on the final production of infectious IAV particles. This is consistent with VeroE6 cells having limited IFN signal amplification, and shows that while ISG15 modulates IFN signaling and some ISG-induction in Vero-E6 cells, other effects of ISG15 on viral production are more relevant. Importantly, there is no impact of Cys-removal from human ISG15 on MX1 or IFIT1 in infected cells, indicating that the observed pro-viral outcome of ISG15 Cys mutants is likely not due to downregulating interferon-stimulated gene expression. A representative western blot image is shown from three independent experiments. b, Extracellular ISG15 does not enhance NFκB and IFN signaling in A549 cells. Wildtype and Cys-mutant ISG15 showed limited anti-IAV activity. To rule out a reliance on extracellular cytokine enhancement from ISG15, we measured the effect of extracellular wildtype or mutant ISG15 on NFκB and IFN signaling. As this process requires the ISG15 receptor, LFA-1, which is not expressed in VeroE6 cells, we used A549 cells that are IFNɣ-competent and express a low-level of LFA-1. ISG15-containing supernatants from IAV-infected VeroE6 cells were UV-treated with 10000 gy of UV-C to deactivate IAV. A549 cells were then treated with these supernatants overnight. We then measured A549-cell lysates for TNFα and IL-6 to assess NFκB-signaling, and IFIT1, IFITM3, and endogenous ISG15 to assess IFN signaling. We observed no obvious induction of these pathways in these cells between wildtype and Cys-mutant ISG15, indicating the pro-viral effect of ISG15 mutants is likely not caused by impairing ISG15’s cytokine enhancement function in these cells. A representative western blot image is shown from three independent experiments.
Extended Data Fig. 10
Extended Data Fig. 10. ISG15 conjugation/secretion with PLpro or during HCoV-229E infection.
a, HEK293-CD13-myc ISG15 stable cells were infected with HCoV-229E at an MOI of 0.01 for 72 h prior to collection of cell lysates (lysates) and supernatant (S/N) prior to western blot with anti-myc Ab (as above) to detect transfected ISG15. The level of ISG15 in the supernatant was normalized to cell lysates and loading control (GAPDH), and was expressed relative to the most abundant protein in the supernatant (Mops condylurus). Only ISG15 of Mops condylurus was significantly secreted into the supernatant and secretion further increased during HCoV-229E infection. Mean and standard error of the mean are displayed, including individual points (black) for n = 3 independent experiments. Significance was tested with a two-tailed t-test comparing infection to ISG15 alone. Raw data are provided in Supplementary Table 17. b, An example western blot image (as per panel a) showing high and low exposure of ISG15 supernatant (S/N), HCoV-229E N protein, GAPDH and ISG15 bands in the HEK293-subclone-ΔISG15 cell lysate with protein ladders. Lanes are as indicated. c, Example western blot image with low and high contrast showing ISG15 conjugation (α-myc) after transfection with ISG15’s and HCoV-229E infection (−/+). Arrows indicate bands not seen in the empty vector control (conjugated proteins). d, Western blot of E1 ligase (UBE1L), E2 ligase (UBE2L6) and E3 ligase (HERC5) expression, together with GAPDH in the same samples shown in panel c, indicating sufficient expression of ISGylation machinery in the HEK293-subclone-ΔISG15 cell line. e, HEK293-subclone-ΔISG15 cells were transfected with ISG15 constructs as indicated and with/without NSP3C/L (SARS-CoV-2 PLpro). As per panel c, arrows indicate ISGylation bands, or ISG15 dimer/monomer. The amount of ISG15 present was calculated, normalized to GAPDH and quantified from three western blots. One of the three western blots is shown as an example. f, Representative western blot for the amount of ISG15 present in the supernatant (matched to e). g, ISGylation machinery expression, as per panel d, for NSP3C samples used in panel e and f and Fig. 3. Western blots in panels b-g are matched to the quantification in Fig. 3h–k.
Extended Data Fig. 11
Extended Data Fig. 11. Models of SARS-CoV-2 PLpro in complexes with ISG15 of bats and human.
a, Predicted Aligned Error (PAE) plots obtained with Alphafold2-Multimer in ColabFold. Alphafold2 modeled SARS-CoV-2 (wildtype, Wuhan-1) PLpro chain (amino acids 819–2763 of ORF1ab) monomer in complex with a monomer of ISG15 of the five indicated species. The PAE plots represent the error in the position of each amino acid. The crystal structure of PLpro in complex with ISG15 revealed it exists as a pentamer of five units of PLpro with five monomeric ISG15 units in a large complex. This AlphaFold2 model represents the native monomer:monomer structure as folded in Alphafold2-Multimer (Mmseqs2 v 1.5.5) via ColabFold, due to computational limits. See also Supplementary Videos 10–19. b, Snapshots from Supplementary Videos 10–19 showing PLpro in a complex with ISG15 of bats and human. Images on the left show a whole protein view of the complex (as per panel a). The middle images show a zoom view of the active site and the right images display the flexible C-terminal tail of ISG15 adjacent to the PLpro binding groove with contacts visualized in green (Supplementary Videos 10–19 show the details). pLDDT scores and number of contacts for each of the five species are 64.84: 422, 65.77: 156, 66.04: 761, 60.44: 354, 65.79: 126, respectively. ISG15 is colored by pLDDT values. PLpro in white. The linear C-terminal tail of human ISG15 resembles that of R. trifoliatus ISG15, loading directly into the PLpro catalytic site, with additional contact sites in R. trifoliatus that seem to stabilize the interaction.

References

    1. Olival, K. J. et al. Host and viral traits predict zoonotic spillover from mammals. Nature546, 646–650 (2017). - PMC - PubMed
    1. Schlottau, K. et al. SARS-CoV-2 in fruit bats, ferrets, pigs, and chickens: an experimental transmission study. Lancet Microbe1, e218–e225 (2020). - PMC - PubMed
    1. Guito, J. C. et al. Asymptomatic infection of Marburg virus reservoir bats is explained by a strategy of immunoprotective disease tolerance. Curr. Biol.31, 257–270 (2021). - PubMed
    1. Perng, Y.-C. & Lenschow, D. J. ISG15 in antiviral immunity and beyond. Nat. Rev. Microbiol.16, 423–439 (2018). - PMC - PubMed
    1. Munnur, D. et al. Altered ISGylation drives aberrant macrophage-dependent immune responses during SARS-CoV-2 infection. Nat. Immunol.22, 1416–1427 (2021). - PubMed

MeSH terms

LinkOut - more resources