. 2025 Mar;639(8054):503-511.
doi: 10.1038/s41586-024-08463-0. Epub 2025 Jan 29.

Engineered heart muscle allografts for heart repair in primates and humans

Ahmad-Fawad Jebran #  1   2 Tim Seidler #  2   3   4 Malte Tiburcy #  2   5 Maria Daskalaki  2   6 Ingo Kutschka  1   2 Buntaro Fujita  7   8 Stephan Ensminger  7   8 Felix Bremmer  2   9 Amir Moussavi  2   10 Huaxiao Yang  11   12 Xulei Qin  11   12 Sophie Mißbach  2   6   13 Charis Drummer  2   6 Hassina Baraki  1   2 Susann Boretius  2   10 Christopher Hasenauer  14 Tobias Nette  14 Johannes Kowallick  2   14 Christian O Ritter  2   14 Joachim Lotz  2   14 Michael Didié  2   3 Mathias Mietsch  2   13 Tim Meyer  2   5 George Kensah  1   2 Dennis Krüger  15 Md Sadman Sakib  15 Lalit Kaurani  15 Andre Fischer  2   15   16   17 Ralf Dressel  2   18 Ignacio Rodriguez-Polo  2   6 Michael Stauske  2   6 Sebastian Diecke  19   20 Kerstin Maetz-Rensing  21 Eva Gruber-Dujardin  21 Martina Bleyer  21 Beatrix Petersen  2   22 Christian Roos  22 Liye Zhang  22 Lutz Walter  2   22 Silke Kaulfuß  23 Gökhan Yigit  2   23 Bernd Wollnik  2   17   23 Elif Levent  2   5 Berit Roshani  24 Christiane Stahl-Henning  24 Philipp Ströbel  9 Tobias Legler  2   25 Joachim Riggert  2   25 Kristian Hellenkamp  3 Jens-Uwe Voigt  26 Gerd Hasenfuß  2   3 Rabea Hinkel  2   13 Joseph C Wu  11   12 Rüdiger Behr  2   6 Wolfram-Hubertus Zimmermann  27   28   29   30   31
Affiliations

Engineered heart muscle allografts for heart repair in primates and humans

Ahmad-Fawad Jebran et al. Nature. 2025 Mar.

Abstract

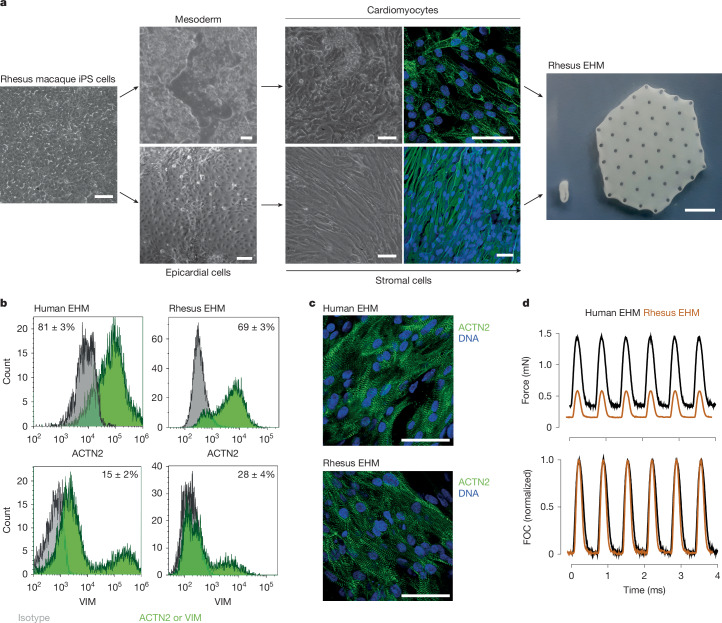
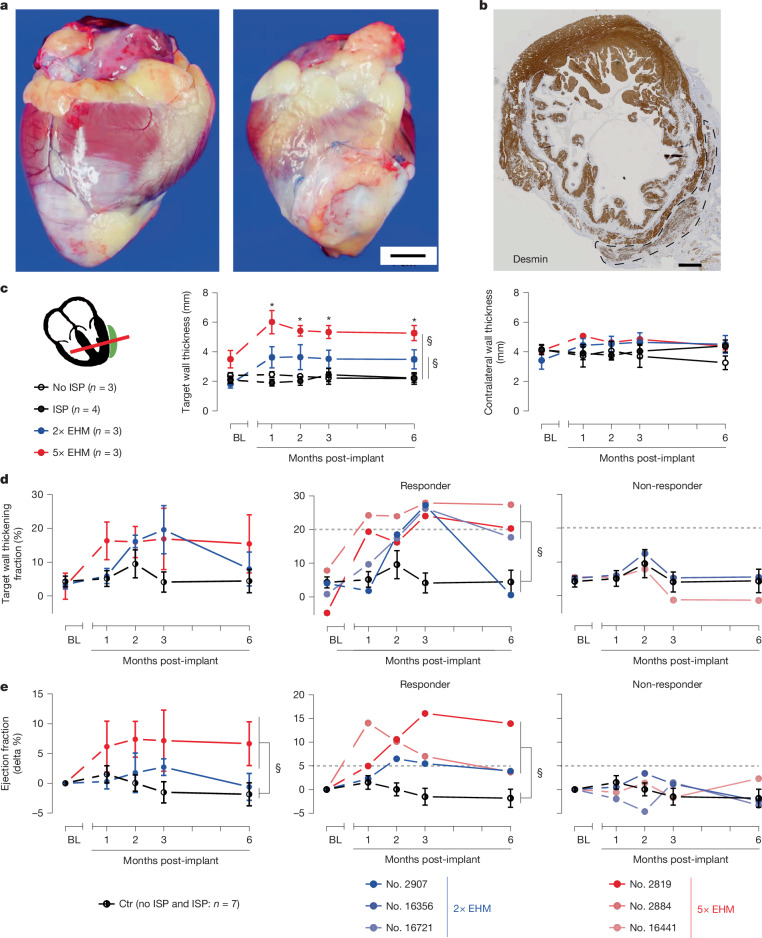
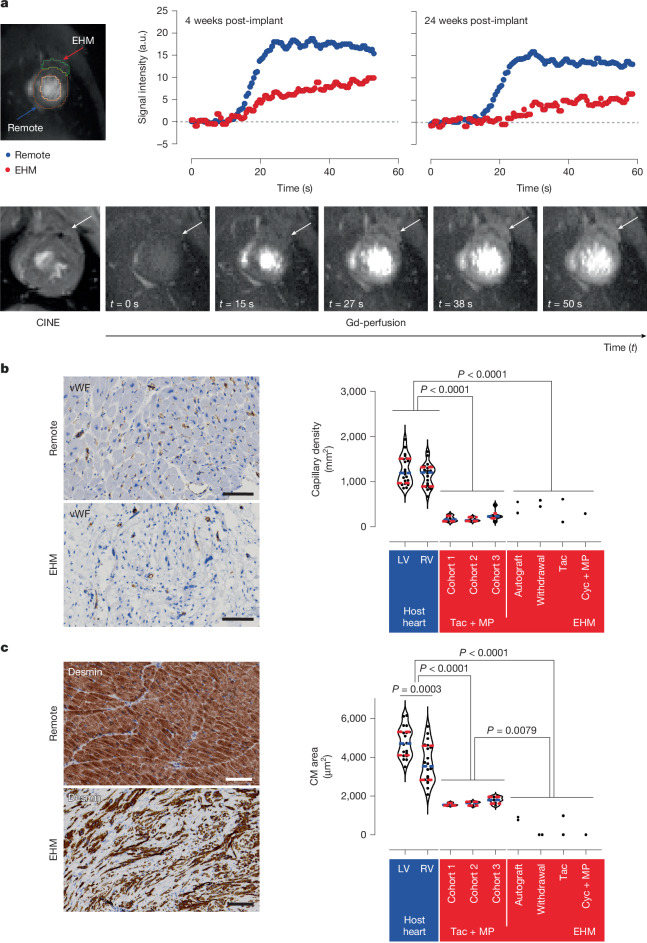
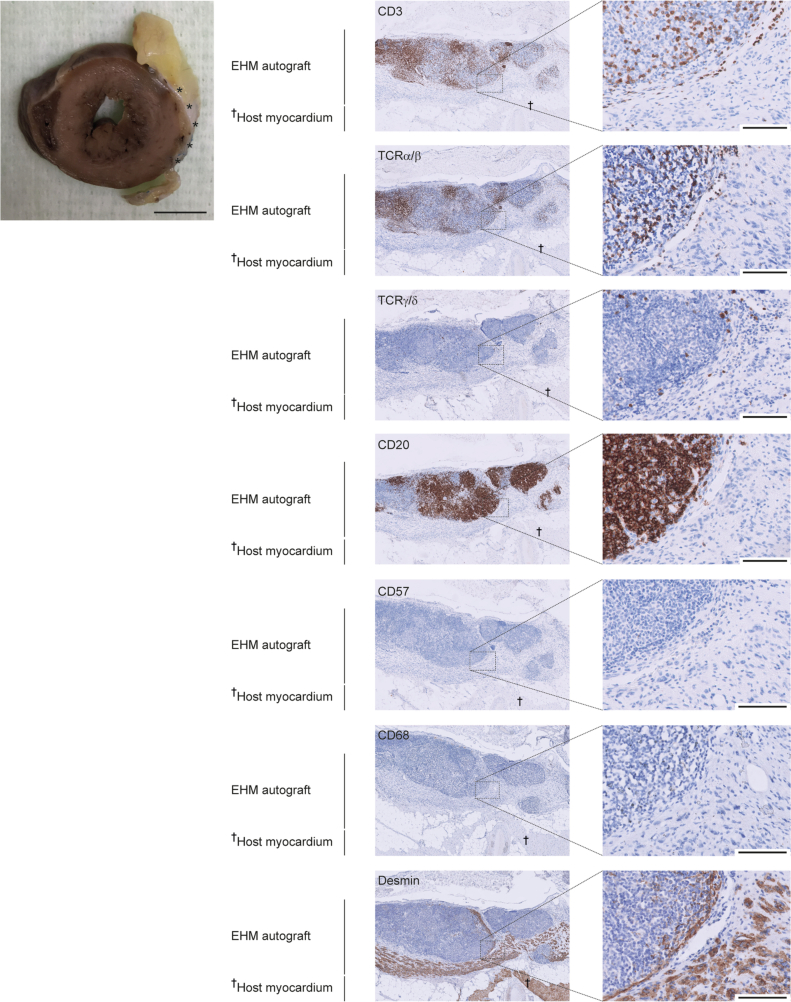
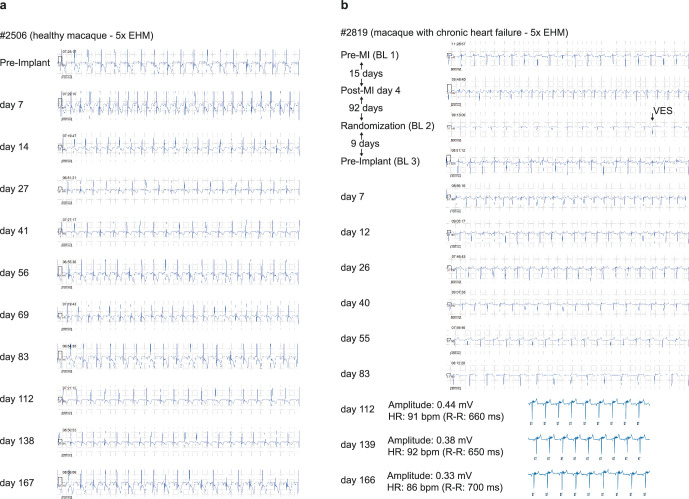
Cardiomyocytes can be implanted to remuscularize the failing heart1-7. Challenges include sufficient cardiomyocyte retention for a sustainable therapeutic impact without intolerable side effects, such as arrhythmia and tumour growth. We investigated the hypothesis that epicardial engineered heart muscle (EHM) allografts from induced pluripotent stem cell-derived cardiomyocytes and stromal cells structurally and functionally remuscularize the chronically failing heart without limiting side effects in rhesus macaques. After confirmation of in vitro and in vivo (nude rat model) equivalence of the newly developed rhesus macaque EHM model with a previously established Good Manufacturing Practice-compatible human EHM formulation8, long-term retention (up to 6 months) and dose-dependent enhancement of the target heart wall by EHM grafts constructed from 40 to 200 million cardiomyocytes/stromal cells were demonstrated in macaques with and without myocardial infarction-induced heart failure. In the heart failure model, evidence for EHM allograft-enhanced target heart wall contractility and ejection fraction, which are measures for local and global heart support, was obtained. Histopathological and gadolinium-based perfusion magnetic resonance imaging analyses confirmed cell retention and functional vascularization. Arrhythmia and tumour growth were not observed. The obtained feasibility, safety and efficacy data provided the pivotal underpinnings for the approval of a first-in-human clinical trial on tissue-engineered heart repair. Our clinical data confirmed remuscularization by EHM implantation in a patient with advanced heart failure.


Conflict of interest statement

Competing interests: W.-H.Z. is the founder, equity holder and advisor of Repairon GmbH. M.T. is advisor of Repairon GmbH. Repairon is working towards market authorization of EHM as advanced therapy medicinal product for applications in heart failure. Repairon had no influence on the design, conduct and interpretation of the study. The other authors declare no competing interests.

Figures

Fig. 1
Fig. 1. Rhesus macaque EHM formulation and characterization.
a, Illustration of the CM and StC differentiation process starting from undifferentiated rhesus macaque iPS cells (left, bright field image; middle upper, bright field images 10 days (left) and 22 days (right) after mesoderm induction with immunofluorescence staining for sarcomeric actinin (ACTN2 in green; nuclei in blue); middle bottom, bright field images 20 days after mesoderm and subsequent epicardial induction (left) as well as after additional 20 days (right) of epithelial-to-mesenchymal transition induction and expansion with immunofluorescence staining for vimentin (VIM in green; nuclei in blue). Subsequent to their directed differentiation, CMs and StCs were embedded in bovine collagen type I hydrogels, cast into custom-made moulds and cultured for 28 days to obtain EHM (right) in a ring format (450-µl reconstitution volume) for quality control by contractility measurements and in a patch format (8-ml reconstitution volume) for implantation in rhesus macaques (refer to Supplementary Video 1). A similar protocol was used for human EHM formulations. b, Cellular composition of human (n = 18) and rhesus (n = 4) EHM assessed by flow cytometry for ACTN2+ (CMs) and VIM+/ACTN2 (StCs); refer also to snRNA-seq and additional flow cytometry data in Extended Data Fig. 1. Data are presented as mean ± s.e.m. c, Representative whole-mount stainings for ACTN2 (green) and nuclei (blue) in human (n = 1) and rhesus macaque (n = 3) EHM for comparison. d, Contractile function measured under isometric conditions and electrical field stimulation at 1.5 Hz; for details, refer to Supplementary Table 2). Scale bars, 1 cm (a (rightmost image), 50 µm (a (all other scale bars), c). Source Data
Fig. 2
Fig. 2. Histopathology and allosensitization.
a,b, Haematoxylin and eosin (H&E) and desmin (brown with haematoxylin-stained nuclei) stains highlighting the host left ventricle (LV)/graft (EHM) interface in rhesus macaque no. 2520 (with allograft) (a) and no. 2483 (with autograft) (b). c, Quantification of the EHM graft area. df, CM (desmin+) engrafted area (inset: representative CM with regularly registered Z bands in brown (sarcomeric actinin (ACTN2)) (d), ratio of CM/EHM graft area (e) and area covered by inflammatory cells (leukocytes) (f). g, Desmin (brown) with haematoxylin-stained nuclei highlighting the largest osteochondral differentiation observed in the study (in rhesus macaque no. 2506; cohort 2 allograft). h, Quantification of cartilage/bone structures; note that in cohort 3, target tacrolimus trough levels were increased from approximately 10 ng ml−1 (cohorts 1 and 2) to approximately 20 ng ml−1 (details in Supplementary Data 1), and metabolic CM selection was extended to reduce potential osteochondral cell impurities (refer to Extended Data Fig. 1a (ii) versus (iii)). Bar graphs (n = 1, 2, 4, 1, 3, 2, 1, 3 and 3 animals from left to right): autograft data are in blue; allograft data obtained under immune suppression with tacrolimus and methylprednisolone are in red; additional experimental groups in white; s.e.m. included in groups with three or more biological replicates. Immune suppression protocols are summarized below the bar graphs. (X) indicates withdrawal of immune suppression after 3 months to induce allograft rejection. i–l, Detection of DSAs in serum from EHM-implanted macaques directed against iPS cell-derived CMs or StCs (marked with †) from the individual EHM preparations at the indicated time points. Cells were left unstimulated (i,k) or stimulated with interferon-γ (IFNγ) to enhance major histocompatibility complex (MHC) I expression (j,l). Mean fluorescence intensity (MFI) (i,j) and the proportion of stained cells in percentage of total cell number determined by flow cytometry (k,l) (details in Supplementary Data 2). Scale bars, 200 µm (a,b,g) and 50 µm (d). Source Data
Fig. 3
Fig. 3. EHM allografts enhance local and global heart function by remuscularization in a chronic heart failure model.
a, Representative images of a rhesus macaque heart without (no. 2750) and with (no. 16356; 2× EHM) EHM graft 6 months after implantation; total times on study were 367 (no. 2750) and 341 (no. 16356) days, respectively; this included follow-up after randomization into the immune suppression (ISP) control (no. 2750) and 2× EHM (no. 16356) groups for 173 and 167 days, respectively. b, CM retention 6 months after epicardial implantation of a 5× EHM (no. 2819; refer to Fig. 2 for a summary of the histopathological findings). ce, MRI data: EHM dose-dependent thickening of the target heart wall with no effect on the contralateral heart wall (both parameters recorded in diastole) (c); target heart wall thickening fraction (local function; d) and ejection fraction (global function; e); aggregated values and data separated into responders and non-responders (cutoffs 20% in d and +5% in e indicated by striped lines; refer to Supplementary Table 5 for a summary of obtained MRI data). All MRI data in cohort 3 were analysed in long-axis two-chamber or four-chamber views to properly identify the mid-anteriorly to apically implanted EHM. Data are presented as mean ± s.e.m. Exact P values were calculated by two-way repeated measures analysis of variance with Greenhouse–Geisser correction and Dunnett’s multiple comparison testing. *From left to right: 0.0148, 0.0349, 0.0143 and 0.0150 versus BL; §Ctr versus 2× EHM: 0.0464 and Ctr versus 5× EHM: 0.0002 (c); Ctr versus responder: 0.0106 (d); Ctr versus 5× EHM: 0.0345 and Ctr versus responder: 0.0065 (e). Ctr: no ISP and ISP combined; n = 7. Scale bars, 10 mm (a), 2 mm (b). Source Data
Fig. 4
Fig. 4. Evidence for EHM allograft vascularization and perfusion.
a, Gadolinium (Gd)-based perfusion MRI data obtained in 5× EHM-implanted rhesus macaque (no. 2819) with evidence for functional vascularization of EHM grafts in a heart failure model at the indicated time points. Left, the regions of interest, from which the Gd signal was reported, are encircled and distinguished as EHM and remote myocardium. The lower magnetic resonance images depict a CINE and the respective Gd-based perfusion images recorded at the indicated time points 4 weeks after EHM (marked by arrows) implantation. b, Histopathological analysis of vascularization in EHM and remote myocardium after immunohistochemistry staining for von Willebrand factor (vWF) (brown; experimental animal no. 2819). c, Histopathological analysis of CM size in EHM and remote myocardium after immunohistochemistry staining for desmin (brown; experimental animal no. 2819). Violin plots in b and c with data points from all EHM-implanted animals (cohorts 1–3) at the respective study end points, that is, 3 and 6 months after EHM implantation (n = 20). Medians are indicated by striped blue lines; quartiles (25% and 75%) are indicated by striped red lines. Cohorts 1–3, animals under tacrolimus and methylprednisolone (Tac + MP); Cyc + MP, animal with cyclosporin and methylprednisolone; RV, right ventricle; Tac, animals with tacrolimus only; Withdrawal, animals with withdrawal of tacrolimus and methylprednisolone 3 months after EHM implantation. Exact P values obtained by one-way analysis of variance with Tukey’s multiple comparison testing are presented in b,c; exact P value unpaired two-tailed Student’s t-test for left ventricle versus right ventricle comparison is presented in c. Scale bars, 100 µm. Source Data
Fig. 5
Fig. 5. Remuscularization of the human heart.
a, Explanted heart obtained 3 months after EHM implantation from a successfully heart transplanted BioVAT-HF patient (ID: 27016). EHMs were macroscopically visible as epicardial grafts (encircled) and are marked with asterisks in the cross-section (right). Inset, schematic of two arrays of overlapping single-layer EHM grafts applied in the patient. b,c, Overview and higher-power magnifications (b) of a cross-section with immunohistochemical labelling of desmin (brown; nuclei in blue (haematoxylin)); note the extension of the CM across the epicardial surface (asterisks) and the registered sarcomere patterning along the epicardial surface, which is similarly visible in haematoxylin and eosin (H&E) stains (c). d, Summary of the evaluation of CM length (end to end), breadth (cross-section at the nucleus level) and CM area (length × breadth). Violin plots with dots representing data from individual CMs in EHM (n = 62) and host myocardium (n = 33); medians indicated by striped blue lines and quartiles (25% and 75%) indicated by striped red lines. Exact P values obtained by unpaired two-tailed Student’s t-test are presented. e, Immunohistochemical and immunofluorescence labelling of CD31+ endothelial cells with a quantification of capillary density in the EHM graft as well as the adjacent and remote recipient myocardium. Dots represent fields of view analysed for CD31-positive capillaries. Violin plots with dots representing the capillary density (n = 3 per group) in EHM graft as well as adjacent (proximity) and remote host myocardium; medians indicated by a striped blue line and quartiles (25% and 75%) indicated by striped red lines. Exact P value (same for EHM versus proximity and EHM versus remote) obtained by one-way analysis of variance with Tukey’s multiple comparison testing is presented. Scale bars, 5 cm (a, left and inset) and 1 cm (a, right), 2 mm (b, top), 200 µm (b, middle) and 20 µm (b, bottom), 20 µm (c,e). Source Data
Extended Data Fig. 1
Extended Data Fig. 1. Overview of differentiation protocols with single nucleus RNA-sequencing and flow cytometry data confirming cell purity in cardiomyocyte and stromal cell differentiations from human and rhesus iPSC as well as EHM thereof.
a, Cardiomyocyte differentiations: (i) human cGMP-protocol used in BioVAT-HF clinical trial (ClinTrial.gov registration: NCT04396899) for comparison, (ii) rhesus macaque protocol used in Cohorts 1 and 2; circle highlights identified osteochondral cells (7 of 3,874), and (iii) rhesus macaque protocol used in Cohort 3. Additional flow cytometry data (mean ± s.e.m.) from (i) n = 23, (ii) n = 10, and (iii) n = 7 differentiations. b, Stromal cell differentiations: (i) human cGMP-protocol used in BioVAT-HF for comparison and (ii) rhesus macaque protocol used in Cohorts 1–3. Additional flow cytometry data (mean ± s.e.m.) from (i) n = 3 and (ii) n = 2 differentiations. c, Cell composition of EHM used for implantation in the BioVAT-HF clinical trial (i) and Cohort 3 of the rhesus macaque study (ii). Flow cytometry data are displayed in Fig. 1b. MI: mesoderm induction; CS: cardiac specification; R: recovery; S: selection. Illustrations created using BioRender (https://biorender.com). Source Data
Extended Data Fig. 2
Extended Data Fig. 2. Rat feasibility study.
a, Schematic of the rat feasibility study protocol. b, Overview of graft-host interface 28 days after implantation of viable (i) and lethally irradiated (ii) rhesus EHM 4 days after ischemia/reperfusion (I/R) injury with immunofluorescent labelling of cardiac troponin T (cTnT), primate mitochondria to distinguish rhesus (graft) from rat (host) cells, and nuclei. c, Immunofluorescence staining for pluripotency markers (i) NANOG, (ii) OCT4, and (iii) SOX2 with co-labelling of cardiomyocytes (cTnT), rhesus mitochondria (graft), and nuclei did not identify residual stem cells in the EHM grafts. Arrows highlight engrafted cardiomyocytes (co-labelling for cTnT and rhesus mitochondria). Micrographs in bc display representative data from 7 animals implanted with vital and 8 animals implanted with irradiated EHM. Bars: 100 µm. d, Summary of echocardiography data obtained 14 and 28 days after EHM implantation compared to baseline (BL) data obtained before I/R. Display of mean ± s.e.m. from n = 7 and n = 8 rats implanted with vital and irradiated EHM, respectively. EF: ejection fraction, FS: fractional shortening, E’/A’: diastolic function, LVEDV: left ventricular end-diastolic volume, LVESV: left ventricular end-systolic volume, SV: stroke volume. Exact P values versus BL calculated by 2-way ANOVA (repeated measures) with Greenhouse-Geisser correction and Dunnett’s multiple comparison testing are presented. Illustration in a created using BioRender (https://biorender.com). Source Data
Extended Data Fig. 3
Extended Data Fig. 3. EHM assembly.
a, EHM assembly tools at the point-of-care included standard surgical instruments as well as custom-made 3D-printed (i) shovel, (ii) fork and (iii) assembly device for EHM handling and positioning on a (iv) TachoSil™ membrane. b, Removal of EHM with holder from a transport container. c, Lift-off of EHM from holder with 3D printed fork. d, EHM on fork (left) and freely floating (right) after removal from an EHM holder (middle). e, 2x EHM stack in assembly device. f, 2x EHM sutured to a TachoSil™ membrane before hand-over to the cardiothoracic surgeon for implantation (Extended Data Fig. 4b).
Extended Data Fig. 4
Extended Data Fig. 4. EHM allografts augment target heart wall thickness in a dose-dependent manner.
a, Schematic of the rhesus macaque study protocols for Cohorts 1–3. b, From left to right: photographs of the EHM implantation procedure through a left lateral thoracotomy onto the beating heart of a healthy rhesus macaque (#2444); magnetic resonance image with 1x EHM graft highlighted by arrows 2 month after implantation (refer to Supplementary Video 2); heart explant with 1x EHM graft 3 months after implantation. c, Summary of MRI data (mean ± s.e.m. of target heart and contralateral heart wall thickness in diastole) to assess target heart wall augmentation by 1x and 5x EHM. After 2 baseline [BL] recordings, experimental animals were subjected to additional MRI studies 1, 2, 3, and 6 months after implantation. Refer to Supplementary Table 4 for a summary of the obtained MRI data. All MRI data in Cohorts 1 and 2 were analysed in short axis views with an optimal view of the basal to mid-anterolaterally implanted EHM. Left panels: summary of all obtained data; middle and right panels: individual group data from Cohorts 1 (1x EHM – 3-months follow-up) and 2 (5x EHM – 6-months follow-up), respectively. Exact P values were calculated using a mixed-effects model with Greenhouse-Geisser correction and Dunnett’s multiple comparison testing: * from left to right 1x EHM vs BL: 0.0172, 0.0405, 0.0154 and 5x EHM vs BL: 0.0041, 0.0066, 0.0106; § 1x vs 5x EHM: 0.0054. ISP: immunosuppression, Tacro: tacrolimus, MP: methylprednisolone, Cicl: cyclosporin. Illustration in a created using BioRender (https://biorender.com). Source Data
Extended Data Fig. 5
Extended Data Fig. 5. T-cell mediated autograft rejection.
Immunohistochemical staining for T cells (CD3, TCRα/β, TCRγ/δ), B cells (CD20), NK cells (CD57), and macrophages (CD68) with additional staining for cardiomyocytes (desmin) to determine the mode of EHM autograft rejection in experimental animal #2483 (Cohort 1). Macroscopic overview: cross section with rhesus autograft EHM marked with asterisks (from experimental animal #2483; refer to Supplementary Table 3 for details). Scale bars: 10 mm (macroscopic overviews); 100 µm (right panels).
Extended Data Fig. 6
Extended Data Fig. 6. Representative telemetry recordings before and after EHM implantation.
Data from experimental animals #2506 (a – Cohort 2) and #2819 (b – Cohort 3) implanted with 5x EHM under immune suppression with tacrolimus and methylprednisolone. A ventricular extrasystole (VES) at the day of randomization, i.e., 96 days after myocardial infarction (MI) and 9 days before EHM implantation is highlighted. Note that the traces recorded on days 112, 139, and 166 post EHM implantation (in #2819) are displayed in a different format due to a change in the telemetry software package.
Extended Data Fig. 7
Extended Data Fig. 7. Chronic heart failure induced by ischemia/reperfusion injury.
a, MRIs (top panels) pre- and 180 days post-myocardial infarction (MI) inflicted by ischaemia/reperfusion (I/R) injury as well as angiographies (bottom panels) demonstrating balloon occlusion (ischaemia; the guide-wire can be detected in occluded artery; arrow points at balloon marker) and reperfusion (after deflation of occluding balloon). b-f, Summary of MRI data (mean ± s.e.m.) obtained in n = 13 macaques at the indicated timepoints post-I/R injury to investigate: b, global heart function (ejection fraction [EF]); c, left ventricular dimensions in diastole (end-diastolic volume [EDV]); d, left ventricular dimensions in systole (end-systolic volume [ESV]); e, EHM target heart wall structure (anterior wall thickness in diastole [AWThd]); and f, EHM target heart wall function (anterior wall thickening fraction [AWThF]). Animals were subsequently randomized for inclusion in the Cohort 3 study groups (refer to Supplementary Table 5 for details). Exact P values versus baseline (pre-I/R injury) were calculated by a mixed-effects model with Greenhouse-Geisser correction and Dunnett’s multiple comparison testing: from left to right (b) <0.0001, 0.0016, <0.0001, 0.0001; (c) 0.0003, 0.0005, 0.0017, 0.0030; (d) <0.0001, 0.0003, 0.0001, 0.0001; (e) 0.0009, 0.0145, 0.0037, 0.0135; (f) <0.0001, <0.0001, <0.0001, <0.0001. Source Data
Extended Data Fig. 8
Extended Data Fig. 8. EHM graft identity and engrafted cardiomyocyte phenotype.
a,b, Rhesus macaque (#2819); c,d, BioVAT-HF patient (#27016) data. a, Microsatellite analyses performed in microdissected FFPE-samples obtained from remote host myocardium and desmin-positive EHM implant area (#2819 with riPSC43110-4 EHM allograft). Lengths of microsatellite markers are indicated in base pairs (bp). Light grey indicates host heart alleles; dark grey indicates iPSC/EHM implant alleles. c, Deep sequencing of a multigene panel containing 78 genes was performed in microdissected FFPE-samples obtained from remote host myocardium and desmin-positive EHM implant area of the patient’s heart explant (displayed in Fig. 5). Single nucleotide variants (SNVs) were detected compared to SNVs present in exome sequencing data of the iPSC master cell line (TC1133). SNVs that were detected in a homozygous wild-type state in the host heart samples were further analysed. Allele distribution of 7 distinct SNVs showed the presence of iPSC-derived alleles in biopsies of the patched area. Note that host cell infiltration (for example vascular cells) contribute to the expected mixed microsatellite and SNV patterns in the EHM implant area. b, Rhesus (#2819) and d, human allograft cardiomyocyte phenotype characterized by immunohistochemistry for slow skeletal (fetal) troponin I (TNNI1) and cardiac (adult) troponin I (TNNI3), ventricular (MYL2) and immature/atrial (MYL4) myosin light chain as well as N-cadherin (CHD2) and connexin 43 (GJA1) as markers for intercalated disc and gap junction formation. Asterisks label host myocardium. Arrow point at putative connexin 43 positive gap junction. EHM allografts are highlighted with asterisks in the respective macroscopic overviews. Scale bars: 10 mm (macroscopic overviews); 100 µm (low power magnifications); 20 µm (high power magnifications of boxed regions).
Extended Data Fig. 9
Extended Data Fig. 9. Cohort 3 heart explants.
Hearts were explanted and photographed 6 months after randomization into the study groups: a, controls without immune suppression (no ISP); b, controls with immune suppression (ISP); c, NHP with 2x EHM implants (2x EHM); and d, NHP with 5x EHM implants (5x EHM).
Extended Data Fig. 10
Extended Data Fig. 10. BioVAT-HF patient information.
Summary of the presented BioVAT-HF patient diagnosis and co-morbidities, guideline-directed therapy, disease trajectory and BioVAT study participation until heart transplantation designated as end of study (EOS), echocardiography findings, human leukocyte antigen (HLA) information from patient and allograft as well as immune suppression regimen.
Extended Data Fig. 11
Extended Data Fig. 11. Immune cell infiltration in human allograft.
Immunohistochemical staining for T cells (CD3, TCRα/β, TCRγ/δ), B cells (CD20), NK cells (CD57), and macrophages (CD68) with additional staining for cardiomyocytes (desmin) to investigate immune cell infiltration in the human allograft at the timepoint of heart transplantation. Note that the heart is from a patient implanted with a mid-dose level EHM allograft (10x EHM; refer also to Fig. 5a, Extended Data Fig. 8d). Scale bars: 100 µm.
Extended Data Fig. 12
Extended Data Fig. 12. Sensing of mechanical stimuli.
a, Set-up for EHM culture under chronic (120 h) mechanical stimulation. Scale bar: 5 cm. b, Stepwise preloading (red traces) resulted in enhancement of contractile force (black traces) according to the Frank-Starling mechanism (positive force-length relationship). c, EHM respond to increasing preload on a beat-to-beat basis in spontaneously contracting EHM: (left) continuous recordings (2 min) of EHM contractions under cyclic mechanical stretch (200 µm stretch for 500 ms at a 1 Hz cycle), (right) superimposition of contractions (black) in relation to the 500 ms mechanical stimulus (red). d, e, Violin plots with individual data points showing the spontaneous beating frequency of two independent EHM recorded over 2 min intervals of every hour during the time course of 120 h in culture. Beating frequency was calculated based on the beat-to-beat time interval of individual contractions (58–117 per timepoint in d) and (48–90 per timepoint - e). Red and blue boxes depict the respectively indicated contraction traces recorded over the 2 min: in d mechanical conditioning resulted in conversion of arrhythmic contractility (red box) into a stable rhythm at ~0.8 Hz over time (blue boxes); in e mechanical conditioning resulted in a fast (after 1 h) adaptation of spontaneous beating from 0.49 ± 0.02 to 0.76 ± 0.01 Hz with subsequent reduction to 0.49 ± 0.01 Hz followed by an adaption to the mechanical stimulation by slowly increasing beating rate (0.61 ± 0.01 Hz at the end of the study). Grey striped bars in 0 h boxes indicate the starting points of the mechanical stimulation protocols. n.d.: not determined (data not recorded).

Similar articles

Cited by

References

    1. Laflamme, M. A. et al. Cardiomyocytes derived from human embryonic stem cells in pro-survival factors enhance function of infarcted rat hearts. Nat. Biotechnol.25, 1015–1024 (2007). - PubMed
    1. Soonpaa, M. H., Koh, G. Y., Klug, M. G. & Field, L. J. Formation of nascent intercalated disks between grafted fetal cardiomyocytes and host myocardium. Science264, 98–101 (1994). - PubMed
    1. Muller-Ehmsen, J. et al. Rebuilding a damaged heart: long-term survival of transplanted neonatal rat cardiomyocytes after myocardial infarction and effect on cardiac function. Circulation105, 1720–1726 (2002). - PubMed
    1. Chong, J. J. et al. Human embryonic-stem-cell-derived cardiomyocytes regenerate non-human primate hearts. Nature510, 273–277 (2014). - PMC - PubMed
    1. Liu, Y. W. et al. Human embryonic stem cell-derived cardiomyocytes restore function in infarcted hearts of non-human primates. Nat. Biotechnol.36, 597–605 (2018). - PMC - PubMed

MeSH terms