. 2025 Feb;638(8050):519-527.
doi: 10.1038/s41586-024-08475-w. Epub 2025 Jan 29.

C-terminal amides mark proteins for degradation via SCF-FBXO31

Affiliations

C-terminal amides mark proteins for degradation via SCF-FBXO31

Matthias F Muhar et al. Nature. 2025 Feb.

Abstract

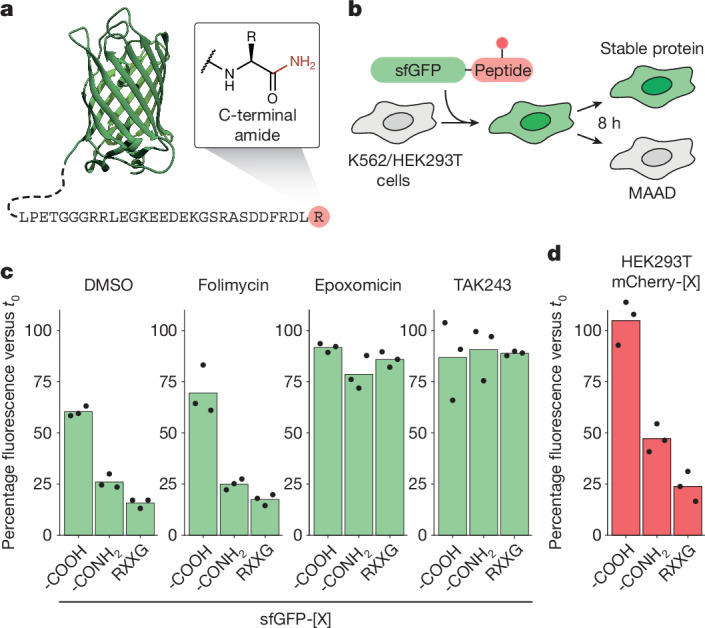
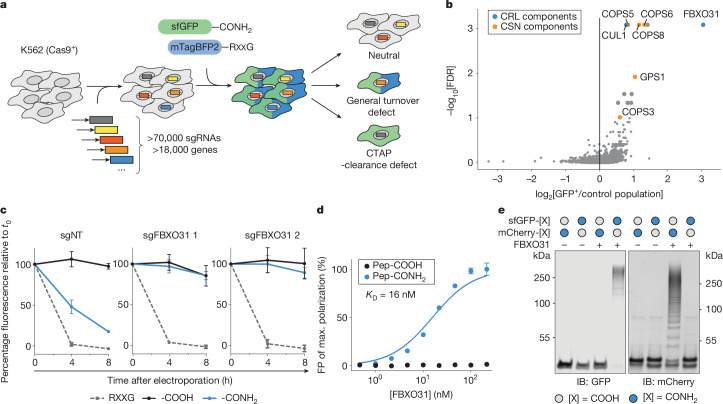
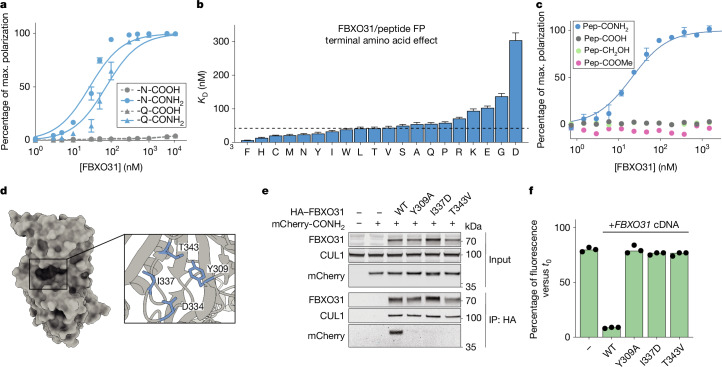
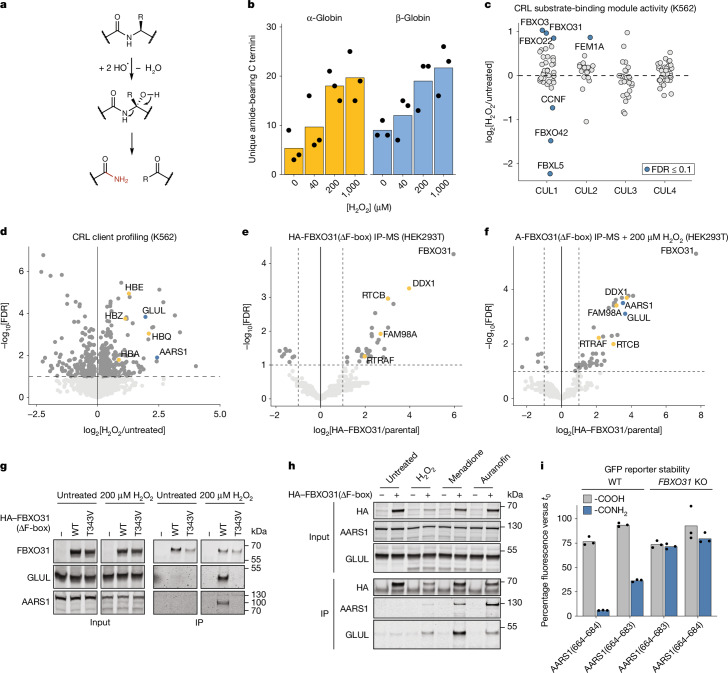
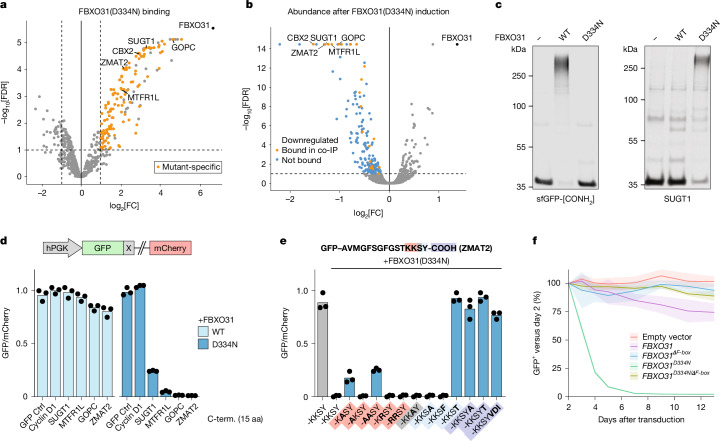
During normal cellular homeostasis, unfolded and mislocalized proteins are recognized and removed, preventing the build-up of toxic byproducts1. When protein homeostasis is perturbed during ageing, neurodegeneration or cellular stress, proteins can accumulate several forms of chemical damage through reactive metabolites2,3. Such modifications have been proposed to trigger the selective removal of chemically marked proteins3-6; however, identifying modifications that are sufficient to induce protein degradation has remained challenging. Here, using a semi-synthetic chemical biology approach coupled to cellular assays, we found that C-terminal amide-bearing proteins (CTAPs) are rapidly cleared from human cells. A CRISPR screen identified FBXO31 as a reader of C-terminal amides. FBXO31 is a substrate receptor for the SKP1-CUL1-F-box protein (SCF) ubiquitin ligase SCF-FBXO31, which ubiquitylates CTAPs for subsequent proteasomal degradation. A conserved binding pocket enables FBXO31 to bind to almost any C-terminal peptide bearing an amide while retaining exquisite selectivity over non-modified clients. This mechanism facilitates binding and turnover of endogenous CTAPs that are formed after oxidative stress. A dominant human mutation found in neurodevelopmental disorders reverses CTAP recognition, such that non-amidated neosubstrates are now degraded and FBXO31 becomes markedly toxic. We propose that CTAPs may represent the vanguard of a largely unexplored class of modified amino acid degrons that could provide a general strategy for selective yet broad surveillance of chemically damaged proteins.


Conflict of interest statement

Competing interests: M.F.M., J.F., R.H., J.W.B. and J.E.C. have filed patent applications related to MAAD discovery and mechanisms of FBXO31 substrate recognition performed in this study (WO/2024/115740, WO/2024/115746; both pending). J.W.B. and J.E.C. are founders of and M.F.M. and J.F. provide consultancy to Serac Biosciences. J.E.C. serves on the scientific advisory board of Mission Therapeutics. B.A.S. serves on the scientific advisory boards of Biotheryx and Proxygen. M.M. is an indirect investor of the Evosep company. The other authors declare no competing interests.

Figures

Fig. 1
Fig. 1. Proteins with C-terminal amides are selectively degraded by the ubiquitin proteasome system.
a, Schematic of an sfGFP-based semi-synthetic reporter protein carrying a C-terminal amide. b, Schematic of a fluorescent in-cell reporter assay to distinguish modified amino acid degrons (MAADs) from neutral modifications by electroporation of reporter proteins into human cell lines. c, The results of an in-cell reporter assay for the sfGFP conjugate shown in a with (-CONH2) or without (-COOH) a terminal amide. RXXG denotes an sfGFP variant containing a positive control degron motif (LPETGGGRRLEGKEEDEKGSRASDRFRGLR). K562 cells received mock treatment (DMSO), lysosomal inhibitor folimycin (100 nM), proteasome inhibitor epoxomicin (500 nM) or E1 ubiquitin ligase inhibitor TAK243 (1 µM) after sfGFP delivery. d, Reporter assay as in c in HEK293T cells using the same peptides conjugated to mCherry. For c and d, data are the mean of three independent experiments (n = 3), each represented by black dots. Source Data
Fig. 2
Fig. 2. CRISPR screen identifies SCF–FBXO31 as a CTAP-clearance factor.
a, Schematic of a genome-wide CRISPR screen to identify genes required for CTAP clearance. Model substrates were sfGFP–GGGKDLEGKGGSAGSGSAGGSKYPYDVPDYAKS-CONH2 (sfGFP–pep1-CONH2) and mTagBFP2–GGGRRLEGKEEDEKGSRASDRFRGLR-COOH (pep2–RXXG). b, Screening results showing the mean enrichment of sgRNAs targeting each gene in CTAP-clearance-deficient cells (sfGFP+mTagBFP2) compared with the control population (sfGFPmTagBFP2) on the abscissa. Ordinate values show the false-discovery-rate (FDR)-adjusted significance of enrichment across sgRNAs and duplicate screens. c, The time course of sfGFP degradation in CRISPRi-competent K562 cells expressing sgRNAs targeting FBXO31 and a non-targeting control (NT). sfGFP was conjugated to pep1 or the positive control degron RXXG as in b. Data are mean ± s.d. of n = 3 independent experiments. d, FP assay of fluorescently labelled peptide (pep2-short, KEEDEKGSRASDDFRDLR) with the indicated C termini. Data are mean ± s.d. of n = 3 parallel experiments. e, In vitro ubiquitylation assay using sfGFP–pep1 and mCherry–pep2 with the indicated C termini, recombinant FBXO31, remaining E3 complex members (SKP1, CUL1–NEDD8, RBX1), E1 (UBA1) and E2 (UBE2R1, UBE2D3) enzymes. Gel source data are provided in Supplementary Fig. 1. The blot is representative of two independent experiments. Source Data
Fig. 3
Fig. 3. FBXO31 broadly and selectively binds to CTAPs.
a, FP assay of pep3 with the indicated terminal amino acids and modifications with increasing FBXO31 concentrations. b, The KD of the interaction between FBXO31 and C-terminally amidated pep3 (KKYRYDVPDYSA[X]-CONH2) as in a for different amino acids in the terminal position. The dashed line indicates the median across all 20 amino acids. The underlying binding curves and individual FP measurements (n = 3 parallel experiments) are shown in Extended Data Fig. 3. c, FP assay of fluorescein-labelled peptide (KEEDEKGSRASDDFRDLR) with increasing concentrations of FBXO31 for the indicated C-terminal modifications. d, The crystal structure of FBXO31 from Protein Data Bank (PDB) 5VZT. Inset: magnification of FBXO31’s substrate-binding pocket. e, Co-immunoprecipitation and immunoblotting of a model CTAP (mCherry–pep2-CONH2) from FBXO31-knockout HEK293 cells expressing HA-tagged cDNAs of wild-type FBXO31 or the indicated mutants. The blot is representative of two independent experiments. f, Rescue of CTAP degradation in FBXO31-knockout HEK293 cells with the indicated FBXO31 mutant cDNAs from e for an independent model CTAP (GFP–GGGKYSESATPESKGGSKGF-CONH2). For ac, data are mean ± s.d. of n = 3 parallel experiments. For f, data are the mean of three independent experiments (n = 3), each shown as black dots. Gel source data are provided in Supplementary Fig. 1. Source Data
Fig. 4
Fig. 4. FBXO31 recognizes endogenous CTAPs formed under oxidative stress.
a, The proposed model of C-terminal amidation by PAM and hydroxyl radicals. b, Reconstitution of in vitro CTAP formation on purified human haemoglobin by hydrogen peroxide for 1 h at 37 °C. Amidated neo-C-termini (−0.984 Da) were identified by tryptic digest and MS/MS. c, Activity-based profiling of CRLs after oxidative challenge (2 h, 200 µM H2O2) of K562 cells. The y axis shows differential enrichment of substrate-binding modules by isolation of neddylated CRLs after treatment. d, Profiling of the CRL-bound proteome after oxidative damage as in c. Haemoglobin subunits present in K562 cells are indicated in yellow. e, IP–MS analysis of HA-tagged FBXO31(ΔF-box) expressed from cDNA in FBXO31-knockout HEK293T cells. The components of the tRNA ligase complex are highlighted in orange. f, IP–MS analysis as in e for HEK293T cells treated for 20 min with 200 µM H2O2. The components of the tRNA ligase complex are highlighted in orange. Clients AARS1 and GLUL are highlighted in blue. g, Validation of FBXO31 clients by co-IP of cells treated as in f. h, Co-IP analysis of FBXO31 and endogenous clients as in g for cells treated with H2O2 (20 min, 200 µM), menadione (2 h, 10 µM) or auranofin (2 h, 10 µM). i, Validation of degron activity for AARS1-derived CTAP-fragments. The indicated AARS1 residues were conjugated to sfGFP by sortylation and delivered to HEK293T cells followed by quantification of protein levels using flow cytometry. For b and i, data are the mean of three independent experiments (n = 3), each shown as black dots. Gel source data are provided in Supplementary Fig. 1. Blots in g and h are representative of two independent experiments. Source Data
Fig. 5
Fig. 5. The cerebral-palsy-associated mutation D334N shifts substrate selectivity of FBXO31.
a, Identification of FBXO31(D334N) neosubstrates by IP–MS analysis of HA-tagged FBXO31(ΔF-box,D334N) from FBXO31-knockout HEK293T cells. Proteins that do not co-IP with wild-type FBXO31 are highlighted in orange. b, Identification of proteome changes after acute induction of FBXO31(D334N) expression. FBXO31-knockout cells were stably transduced with ligand-inducible DD–FBXO31(D334N). The total protein abundance was measured by tandem-mass-tag MS after 12 h of protein induction (2 µM shield-1) and compared to shield-treated parental cells. Downregulated proteins (FDR < 0.1, log2[fold change] < 0) are highlighted. c, In vitro ubiquitylation of model CTAP or SUGT1 by wild-type or mutant FBXO31. The blot is representative of two independent experiments. d, Protein stability assay for FBXO31-knockout HEK293T cells expressing GFP with the indicated C termini (C-term.). Cells were transduced with vectors expressing wild-type FBXO31 or FBXO31(D334N) 2 days before measurement using flow cytometry. The y axis indicates the ratio of GFP fluorescence to the co-expressed control protein mCherry. aa, amino acids. e, Protein stability assay as in d for the ZMAT2 C terminus with the indicated mutations. f, Competitive proliferation assay measuring the impact of FBXO31 variant expression in FBXO31-KO HEK293T cells on cell fitness. The fraction of cells stably expressing GFP-linked cDNAs was measured over 12 days by flow cytometry. For d and e, data are the mean of three independent experiments (n = 3), each shown as black dots. For f, data are the mean ± s.d. of three independent experiments (n = 3). Gel source data are provided in Supplementary Fig. 1. Source Data
Extended Data Fig. 1
Extended Data Fig. 1. A screen for modified amino acid degrons (MAADs).
a, Schematic showing sfGFP bearing various PTMs tested for MAAD activity. Modified sequences are shown, and modified positions are highlighted. The modification on each amino acid is shown in red. Corresponding unmodified amino acids are indicated in brackets. b, Schematic showing modification of sfGFP with a C-terminal sortylation tag. “SortA 7 M” conjugates sfGFP and peptide containing an N-terminal GGG-motif. c, Exemplary SDS-PAGE analysis of sortase reaction showing sfGFP, crude reaction mixture and purified sfGFP-conjugate. Conjugate was purified by Ni-NTA to remove unreacted sfGFP, cleaved sortag and SortA 7 M, followed by ion exchange chromatography. The blot is representative of four parallel reactions. Similar results were obtained for all sortylation reactions throughout this study. d, Exemplary time-course experiment measuring sfGFP turnover in K562 cells. Cells received sfGFP carrying a C-terminal sortase tag (sfGFP-SGGLPETGGHHHHHHV) or its conjugated form carrying an RxxG degron motif (sfGFP-SGGLPETGGGRRLEGKEEDEKGSRASDRFRGLR). e, Results of a screen for MAAD activity. Pep1 MAAD reporters shown in a were used in an in-cell reporter assay as in d in K562 cells. Bars represent means of two independent experiments (n = 2), each shown as black dots. f, Validation of C-terminal amidation as a MAAD as in e in HEK293T cells using mTagBFP conjugated to amidated (-CONH2) or unmodified (-COOH) pep2 shown in a or the positive control degron (RxxG) as in d. Bars represent means of three independent experiments (n = 3), each shown as black dots. For gel source data, see Supplementary Fig. 1. Source Data
Extended Data Fig. 2
Extended Data Fig. 2. Inducible CRISPR screen identifies SCF/FBXO31 as a CTAP clearance factor.
a, Schematic of the vectors used to establish a doxycycline(dox)-inducible Cas9 expression system (iCas9) for CRISPR screening. b, Validation of inducible gene disruption in iCas9 cells using an sgRNA targeting cell surface marker CD55. Cells stably expressing sgCD55 were left untreated or on dox (500 ng/ml) for 9 days. Histogram shows CD55 surface expression measured by flow cytometry. c, Rendering of the COP9 signalosome complex from PDB:4D10 (top) and SCF/FBXO31 based on previously published structures (bottom, see Methods). Screening hits identified for CTAP clearance and NEDD8 are highlighted in blue or orange. d, CTAP degradation assay in FBXO31 knockout cells with or without stable transduction of indicated cDNA rescue constructs, as well as non-edited HEK293 cells (parental). e, Co-IP of HA-FBXO31 from FBXO31 knockout HEK293 cells electroporated with the model substrate mCherry-pep2 (mCherry-GGGRRLEGKEEDEKGSRASDDFRDLR) with indicated C-termini. Cells were co-treated with the neddylation inhibitor MLN4924 (2 µM) and 500 nM epoxomicin and harvested after 2 h to stabilize CRL complexes and to prevent protein degradation. HA-FBXO31 was stably expressed as cDNA. f, In vitro ubiquitylation time course of sfGFP-pep1 (sfGFP-GGGKDLEGKGGSAGSGSAGGSKYPYDVPDYAKS) with indicated C-termini incubated with SCF/FBXO31, E1 and E2 enzymes. For gel source data, see Supplementary Fig. 1. Blots shown in e and f are representative of three and two independent experiments respectively.
Extended Data Fig. 3
Extended Data Fig. 3. CTAP binding across terminal amino acid contexts by FBXO31.
Individual binding curves of pep3 (KKYRYDVPDYSA[X]-CONH2) with each of the 20 canonical proteinogenic amino acids in the C-terminal positions. Corresponding dissociation constants are summarized in Fig. 3b. Black dots represent individual measurements for three parallel experiments (n = 3). Source Data
Extended Data Fig. 4
Extended Data Fig. 4. A pooled in vitro interaction screen for CTAP binding preferences of FBXO31.
a, Schematic showing analysis of peptide libraries with variable C-terminal amino acids by FBXO31 pull-down and subsequent MS/MS analysis. Peptide libraries are prepared using isokinetic amino acid mixtures. b, Violin plot showing number and relative recovery of peptides bound by FBXO31 in vitro as in a for unmodified (-COOH) and amide-bearing (-CONH2) C-termini. Y-axis values depict total reporter ion intensities for identified peptides scaled to an isobarically labelled input library (see Methods). The median scaled intensity differs by 7.6-fold (p < 10-17, Wilcoxon rank-sum test). c, Heatmap of amino acid frequencies among FBXO31-bound peptides identified in a relative to input. d, Heatmaps showing absolute amino acid frequencies in the three terminal positions of 841 unique C-terminally amidated peptides co-precipitated with FBXO31. e, Heatmap as in d for all 3817 unique peptides identified in the input library. f, In-cell protein stability assay for sfGFP conjugated to top-scoring amide-bearing C-termini bound by FBXO31 in the pooled interaction screen. CRISPRi-competent HEK293T cells were transduced with non-targeting (NT) or FBXO31-targeting guides as indicated. g, In-cell protein stability assay as in f for a CRISPRi-competent clone of HEK293T expressing indicated sgRNAs. For f and g, bars represent the mean of three independent experiments (n = 3), each represented by black dots. Source Data
Extended Data Fig. 5
Extended Data Fig. 5. A conserved binding pocket enables amide-recognition by FBXO31.
a, Comparison of the negatively charged binding substrate pocket of FBXO31 with readers of unmodified C-terminal degrons. Electrostatic potential maps were rendered based on published structures with PDB accessions 5VZT (FBXO31), 6DO3 (KLHDC2), 7Y3A (TRIM7) and 6LEY (FEM1C). b, Protein sequence alignment of the FBXO31 substrate binding pocket from orthologues of indicated species. Conservation between the displayed sequences is expressed as Linvingston-Barton conservation score.
Extended Data Fig. 6
Extended Data Fig. 6. Evidence of CTAP formation in human tissue proteomes.
a, Schematic showing a CTAP stemming from alpha-amidating protein fragmentation and resulting peptides following tryptic digest for mass spectrometry. b, Re-analysis of public proteome data from indicated tissues showing the enrichment of C-terminal cleavage sites in amidated spectra. Peptides were divided into such with unchanged mass and C-terminally amidated ones (−0.984 Da) (see Methods). c, Complementary analysis to b quantifying degrees of C-terminal amidation among identified spectra. Peptides were divided into such with fully enzymatic termini (tryptic), non-enzymatic C-termini (neo-C-termini), non-enzymatic N-termini (neo-N-termini) and native protein C-termini. Insets show the enrichment of amidation among neo-C-termini compared to tryptic peptides. d, Number of unique amide-bearing neo-C-termini (CTAPs) in indicated tissues from tissue proteomes shown in b. e, Number of individual proteins showing CTAP-formation in b. Source Data
Extended Data Fig. 7
Extended Data Fig. 7. Oxidative protein damage is sufficient to trigger CTAP formation in vitro.
a, In vitro reconstitution of CTAP formation by oxidative protein cleavage. Purified human haemoglobin was exposed to indicated concentrations of hydrogen peroxide for 1 h at 37 °C. C-terminal amide-bearing neo-C-termini were detected by tryptic digest and MS/MS. b, MS/MS-based measurement of in vitro CTAP formation in haemoglobin as in a. To test specificity of the reported mass shifts in a, C-terminal mass shifts corresponding to different multiple of 0.984 were allowed. Mass shifts corresponding to CTAP-formation are highlighted in yellow. Bars represent total spectra identified in three independent experiments (n = 3). c, Comparison of CTAPs detected in public human proteomics data and following in vitro oxidative damage shown in a. Dots represent unique CTAP C-termini identified in each condition. Colours indicate proteases used during MS sample preparation. d, CTAP cleavage patterns of in vivo CTAPs identified in public proteomics data as in Extended Data Fig. 6. Heatmaps indicate the number of amino acids detected among peptides at the three residues preceding or following CTAP cleavage sites, as well as at the C-termini for all quantified peptides for reference. K and R in position -1 from the peptide C-terminus were omitted as they are by definition absent in neo-C-termini and form the overwhelming majority in tryptic peptides. e, In vitro reconstitution of CTAP formation for recombinant human tRNA-ligase complex incubated for 30 min at room temperature in presence or absence of hydrogen peroxide and copper as indicated. C-terminal amide-bearing neo-C-termini were detected by MS/MS as in a. f, CTAP formation as in e measured as percentage of total detected peptides. For a, e and f, bars represent the mean of three independent experiments (n = 3), each represented by black dots. Source Data
Extended Data Fig. 8
Extended Data Fig. 8. FBXO31-loss disproportionately affects mature neurons in vitro.
a, RNA-sequencing (RNA-seq) results showing lack of transcriptional responses to FBXO31 knockdown by CRISPRi in rapidly proliferating HEK293T cells. b, Schematic of the generation of embryonic stem cell-derived neural progenitor cells (NPC). Cells were engineered to express the CRISPRi effector by knock-in into the CLYBL locus. Gene-specific sgRNAs are subsequently delivered by lentiviral integration. c, Transcriptional responses to FBXO31 knockdown in NPCs measured by RNA-seq. d, Transcriptional response to FBXO31 knockdown in mature neurons after 24 days of differentiation. e,f, Published transcriptional signature of familial amyotrophic lateral sclerosis (ALS) driven by TARDBP(G298S) or PFN1(G118V) respectively as measured by RNA-seq of wild-type and mutant motor neurons. Genes regulated by FBXO31 knockdown in neurons in d are highlighted as indicated.
Extended Data Fig. 9
Extended Data Fig. 9. The D334N mutation disrupts CTAP recognition by FBXO31.
a, FP assay of for a peptide derived from the C-terminus of Cyclin D1 ([fluorescein]-KAATPTDVRDVDI) with (blue) or without C-terminal amide (black) in the presence of wild-type FBXO31/SKP1 (left) or its D334N mutant form. b, FP assays as a for a second peptide pair (pep2-short, KEEDEKGSRASDDFRDLR). c, Co-IP of indicated HA-tagged FBXO31 cDNAs in FBXO31 knockout HEK293 cells electroporated with a model substrate (mCherry-GGGRRLEGKEEDEKGSRASDDFRDLR). Cells were co-treated with 2 μM MLN4924 and 500 nM epoxomicin and harvested after 2 h. The blot is representative of two independent experiments. For a and b, data points represent mean ± SD (n = 3 parallel experiments). For gel source data, see Supplementary Fig. 1. Source Data
Extended Data Fig. 10
Extended Data Fig. 10. A C-terminal degron motif marks FBXO31(D334N) neosubstrates.
a, Comparison of proteome-wide responses to FBXO31 induction for wild-type or D334N mutant DD-3xFLAG-FBXO31 induced by 12 h of treatment with shield-1 measured by TMT-MS. Proteins are highlighted in blue if they are down-regulated only by mutant FBXO31 expression (FDR < 0.1) and in orange if they are also detected by FBXO31(D334N, ΔF-box) co-IP MS (FDR < 0.1). b, C-termini of bound and down-regulated proteins highlighted in a. Highlighted residues show a shared C-terminal motif. Inset on top shows a common C-terminal motif consisting of a basic residue (K/R) at position −3 and a hydrophobic residue (Φ) at position −1 from the C-terminus. c, Flow cytometry plot of the degron assay shown in Fig. 5d for FBXO31 knockout HEK293T cells expressing a GFP reporter with the indicated C-termini. Cells were additionally transduced with cDNAs encoding for FBXO31 wt (top) or FBXO31(D334N) (bottom) 2 days prior to acquisition. d, Schematic of the protein stability reporter vector used in c. e, Protein stability assay for the ZMAT2 C-terminal degron reporter and mutants thereof in FBXO31 knockout HEK293T cells. Cells additionally received wildtype FBXO31 cDNA as a control for neosubstrate recognition in Fig. 5e. Y-axis values indicate the ratio of GFP-fluorescence to the co-expressed control protein mCherry. f, Mutational mapping of the C-terminal neo-substrate degron in SUGT1 as in e. For e and f, bars represent means of independent experiments each shown as black dots (n = 3 for FBXO31(D334N) and non-transduced cells, n = 2 for FBXO31(WT)). Source Data

References

    1. Shao, S. & Hegde, R. S. Target selection during protein quality control. Trends Biochem. Sci41, 124–137 (2016). - PubMed
    1. Harmel, R. & Fiedler, D. Features and regulation of non-enzymatic post-translational modifications. Nat. Chem. Biol.14, 244–252 (2018). - PubMed
    1. Stadtman, E. R. Covalent modification reactions are marking steps in protein turnover. Biochemistry29, 6323–6331 (1990). - PubMed
    1. Gorisse, L. et al. Protein carbamylation is a hallmark of aging. Proc. Natl Acad. Sci. USA113, 1191–1196 (2016). - PMC - PubMed
    1. Hernebring, M. et al. Removal of damaged proteins during ES cell fate specification requires the proteasome activator PA28. Sci. Rep.3, 1381 (2013). - PMC - PubMed

LinkOut - more resources