. 2025 Jan 29;15(1):3674.
doi: 10.1038/s41598-025-87530-6.

Evaluation of the Digital Ventilated Cage® system for circadian phenotyping

Affiliations

Evaluation of the Digital Ventilated Cage® system for circadian phenotyping

Selma Tir et al. Sci Rep. .

Abstract

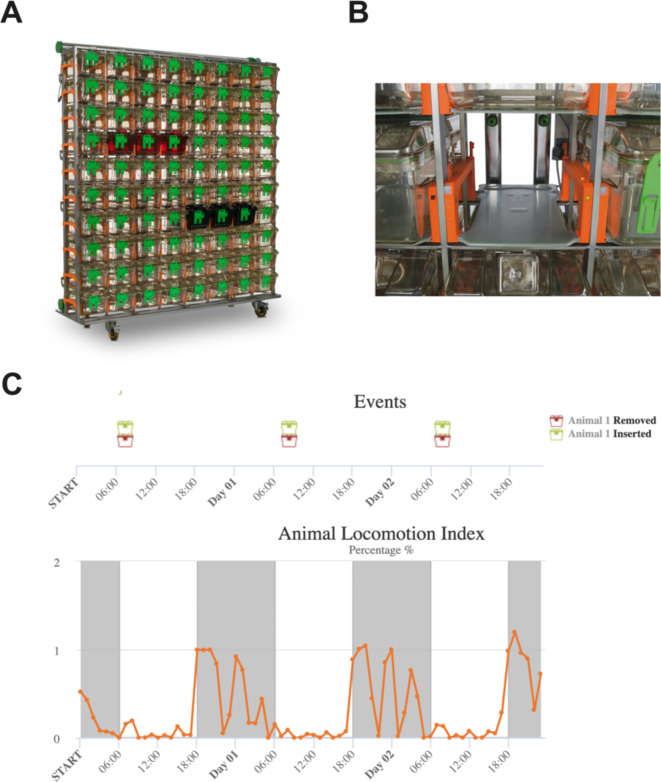
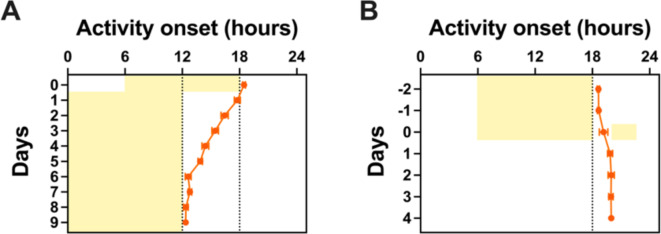
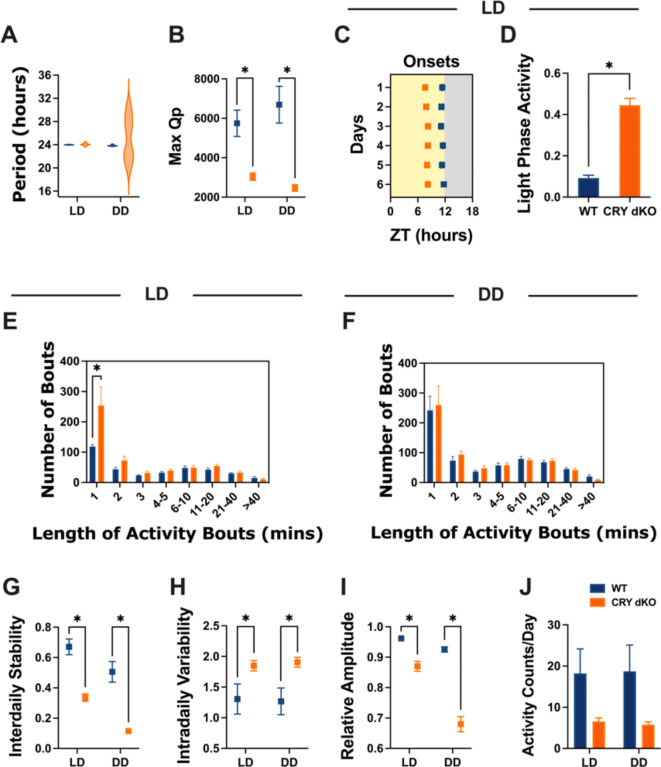
The study of circadian rhythms has been critically dependent upon analysing mouse home cage activity, typically employing wheel running activity under different lighting conditions. Here we assess a novel method, the Digital Ventilated Cage (DVC®, Tecniplast SpA, Italy), for circadian phenotyping. Based upon capacitive sensors mounted under black individually ventilated cages with inbuilt LED lighting, each cage becomes an independent light-controlled chamber. Home cage activity in C57BL/6J mice was recorded under a range of lighting conditions, along with circadian clock-deficient cryptochrome-deficient mice (Cry1-/-, Cry2-/- double knockout). C57BL/6J mice exhibited a 24 h period under light/dark conditions, with a free-running period of 23.5 h under constant dark, and period lengthening under constant light. Animals displayed expected phase shifting responses to jet-lag and nocturnal light pulses. Sex differences in circadian parameters and phase shifting responses were also observed. Cryptochrome-deficient mice showed subtle changes in activity under light/dark conditions and were arrhythmic under constant dark, as expected. Our results show the suitability of the DVC system for circadian behavioural screens, accurately detecting circadian period, circadian disruption, phase shifts and mice with clock defects. We provide an evaluation of the strengths and limitations of this method, highlighting how the use of the DVC for studying circadian rhythms depends upon the research requirements of the end user.

Keywords: Circadian disruption; Circadian phenotyping; Circadian screen; Home cage monitoring; Individually ventilated cage; Locomotor activity.


Conflict of interest statement

Declarations. Competing interests: The authors (ST and SNP) have attended meetings funded by Tecniplast. However, Tecniplast had no involvement in the study design, data interpretation, or conclusions drawn from the research findings. As such, the authors declare no conflict of interest regarding the use of the DVC system. Ethics statement: The animal study was reviewed and approved by the Clinical Medicine Animal Welfare and Ethical Review Body (AWERB), University of Oxford.

Figures

Fig. 1
Fig. 1
The DVC system and the Animal Locomotion Index. (A) DVC rack equipped with clear, red, and black cages. (B) Capacitive sensor board. (C) Animal locomotion index for one wildtype C57BL/6J mouse, binned by hour, visualized on the cloud-based DVC Analytics platform. Timings of cage insertion and extraction for daily checks are also shown. Dark shading indicates dark phases.
Fig. 2
Fig. 2
Measuring circadian rhythms with the DVC system. Representative double-plotted actogram of locomotor activity for a wildtype C57BL/6J mouse using the DVC system. The circadian screen included 1 week in 12:12 Light-Dark (LD), 10 days in LD following a 6-hour advance, 10 days in constant darkness (DD), 2 weeks in LD to re-entrainment, 10 days in DD following a LP at ZT14-16, and 10 days in constant light (LL). Yellow shading indicates light phases, while orange dots depict activity onsets.
Fig. 3
Fig. 3
Measures of circadian disruption for 12 wildtype C57BL/6J mice under 12:12 Light-Dark (LD), constant darkness (DD) and constant light (LL). (A) Chi-square periodogram analysis. (B) Maximum Qp values (Lighting, F(1.565, 17.22) = 4.507, P = 0.0340). (C) Distribution of the number and duration of activity bouts (Lighting x Bout length, F(14, 231) = 0.8822, P = 0.5789). (D) Period of activity rhythms (Lighting, F(1.121, 12.34) = 106.3, P < 0.0001). (E) Inter-daily Stability (Lighting, F(1.437, 15.81) = 16.71, P = 0.0003). (F) Intra-daily Variability (Lighting, F(1.598, 17.58) = 0.7966, P = 0.4404). (G) Relative Amplitude (Lighting, F(1.465, 16.12) = 4.942, P = 0.0295). Mean +/- SEM. Statistically significant multiple comparisons are indicated by an asterisk.
Fig. 4
Fig. 4
Phase shifting responses for 12 wildtype C57BL/6J mice. (A) Animals required about 6 days to re-entrain to the Light-Dark (LD) cycle following a 6-hour phase advance, as illustrated by the shift in activity onset. (B) Animals’ activity onsets were delayed by 1.3 h in constant darkness following exposure to a light pulse at ZT14-16 (Wilcoxon matched-pairs signed rank test, Day -1 vs. Day 4, z = -1.375, P = 0.0005). Mean +/- SEM.
Fig. 5
Fig. 5
Representative double-plotted actogram of locomotor activity for a (A) wildtype C57BL/6J (WT) and a (B) Cryptochrome-deficient (Cry1−/−, Cry2−/−, labelled CRY dKO) mouse using the DVC system. Animals were exposed to one week of 12:12 Light-Dark (LD) cycle and 10 days of constant darkness (DD). Yellow shading indicates light phases, while blue and orange lines depict activity onsets.
Fig. 6
Fig. 6
Measures of circadian disruption for 6 wildtype C57BL/6J (WT) and 6 Cryptochrome-deficient (CRY dKO) mice under 12:12 Light-Dark (LD) and constant darkness (DD). (A) Period of activity rhythms (Genotype, F(1, 10) = 0.6558, P = 0.4369). (B) Maximum Qp values (Genotype, F(1, 10) = 19.31, P = 0.0013). (C) Activity onsets in LD. (D) Proportion of light phase activity in LD. (E) Distribution of the number and duration of activity bouts in LD (Bout length x Genotype, F(7, 70) = 4.211, P = 0.0006). (F) Distribution of the number and duration of activity bouts in DD (Bout length x Genotype, F(7, 70) = 0.1472, P = 0.9938). (G) Inter-daily Stability (Genotype, F(1, 10) = 38.95, P < 0.0001). (H) Intra-daily variability (Genotype, F(1, 10) = 6.571, P = 0.0282). (I) Relative Amplitude (Genotype, F(1, 10) = 122.6, P < 0.0001). (J) Total activity per day (Genotype, F(1, 10) = 3.969, P = 0.0743). Mean +/- SEM. Statistically significant multiple comparisons are indicated by an asterisk.

Similar articles

Cited by

References

    1. Mohawk, J. A., Green, C. B. & Takahashi, J. S. Central and peripheral circadian clocks in mammals. Annu. Rev. Neurosci.35, 445–462. 10.1146/annurev-neuro-060909-153128 (2012). - PMC - PubMed
    1. Dibner, C., Schibler, U. & Albrecht, U. The mammalian circadian timing system: Organization and coordination of central and peripheral clocks. Annu. Rev. Physiol.72, 517–549. 10.1146/annurev-physiol-021909-135821 (2010). - PubMed
    1. Hattar, S., Liao, H. W., Takao, M., Berson, D. M. & Yau, K. W. Melanopsin-containing retinal ganglion cells: Architecture, projections, and intrinsic photosensitivity. Science295, 1065–1070. 10.1126/science.1069609 (2002). - PMC - PubMed
    1. Hughes, S. et al. Signalling by melanopsin (OPN4) expressing photosensitive retinal ganglion cells. Eye30. 10.1038/eye.2015.264 (2016). - PMC - PubMed
    1. Foster, R. G. & Hankins, M. W. Circadian vision. Curr. Biol.17, R746–R751. 10.1016/j.cub.2007.07.007 (2007). - PubMed

Publication types

LinkOut - more resources