. 2025 Jan 29;15(1):3635.
doi: 10.1038/s41598-025-88292-x.

Construction of a rodent neural network-skeletal muscle assembloid that simulate the postnatal development of spinal cord motor neuronal network

Affiliations

Construction of a rodent neural network-skeletal muscle assembloid that simulate the postnatal development of spinal cord motor neuronal network

Haiyang Yu et al. Sci Rep. .

Abstract

Neuromuscular diseases usually manifest as abnormalities involving motor neurons, neuromuscular junctions, and skeletal muscle (SkM) in postnatal stage. Present in vitro models of neuromuscular interactions require a long time and lack neuroglia involvement. Our study aimed to construct rodent bioengineered spinal cord neural network-skeletal muscle (NN-SkM) assembloids to elucidate the interactions between spinal cord neural stem cells (SC-NSCs) and SkM cells and their biological effects on the development and maturation of postnatal spinal cord motor neural circuits. After coculture with SkM cells, SC-NSCs developed into neural networks (NNs) and exhibited a high proportion of glutamatergic and cholinergic neurons, low proportion of neuroglia and gamma-aminobutyric acidergic neurons, and increased expression of synaptic markers. In NN-SkM assembloids, the acetylcholine receptors of SkM cells were upregulated, generating neuromuscular junction-like structures with NNs. The amplitude and frequency of SkM cell contraction in NN-SkM assembloids were increased by optogenetic and glutamate stimulation and blocked by tetrodotoxin and dizocilpine, respectively, confirming the existence of multisynaptic motor NNs. The coculture process involves the secretion of neurotrophin-3 and insulin growth factor-1 by SkM cells, which activate the related ERK-MAPK and PI3K-AKT signaling pathways in NNs. Inhibition of the ERK-MAPK and PI3K-AKT pathways significantly reduces neuronal differentiation and synaptic maturation of neural cells in NN-SkM assembloids, while also decreasing acetylcholine receptor formation on SkM cells. In brief, NN-SkM assembloids simulate the composition of spinal cord motor NNs and respond to motor regulatory signals, providing an in vitro model for studying postnatal development and maturation of spinal cord motor NNs.

Keywords: Motor neural network; Neuromuscular interaction; Skeletal muscle; Spinal cord neural stem cells; Tissue engineering.


Conflict of interest statement

Declarations. Competing interests: The authors declare no competing interests.

Figures
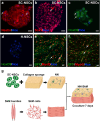
Fig. 1
Fig. 1
Construction of NN-SkM assembloids. (ac) SC-NSCs expressing Nestin, Sox2 and HoxD9. (d) HoxD9 expression in NSCs from the hippocampus. (e) and (f) SkM cells exhibited MyoD-positive and MyoG-positive immunoreactivity. (g) A schematic diagram summarizing the assembly process of the NN-SkM assembloids. The cell nuclei were counterstained with Hoechst 33,342 (Hoe). Scale bars: 10 μm in (a), (c), and (d); 20 μm in (b), (e) and (f).
Fig. 2
Fig. 2
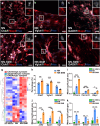
The differentiation of SC-NSCs in the NN and NN-SkM assembloids. After 7 days of cultivation, the SC-NSCs differentiated into Map2-positive neurons (arrows in a and b), Olig2-positive oligodendrocytes (arrows in c and d) and GFAP-positive astrocytes (arrows in e and f) in the NN and NN-SkM assembloids. (g) Bar chart showing that the NN-SkM group had more Map2-positive cells and fewer GFAP-positive and Olig2-positive cells than the NN group (n = 6; **P < 0.01). (h) Heatmap representation of genes related to neural differentiation that were significantly differentially expressed (P < 0.05) between the NN-SkM, NN and SC-NSCs groups. Z-scoring label-free quantification (LFQ) intensities are depicted; red and blue represent increased and decreased values, respectively. Expression of genes associated with neuron differentiation (i), oligodendrocyte differentiation (j) and astrocyte differentiation (k). The results were significant across every group, with data input as values to the base 10 to allow log adjustment (n = 3, ***P < 0.001, **P < 0.01, *P < 0.05). The data are presented as means ± standard deviations (SD) in (g,ik). Scale bars = 20 μm in (af).
Fig. 3
Fig. 3
Neurotransmitter expression in NN and NN-SkM assembloids after 7 days of culture. (ac) The expression of ChAT, Vglut1 and GAD67 in the NN. (df) The expression of ChAT, Vglut1 and GAD67 in the NN-SkM assembloids. (h) Bar chart showing that the NN-SkM group had more ChAT-positive and Vglut1-positive neurons and fewer GAD67-positive cells than the NN group (n = 6, ***P < 0.001, **P < 0.01). (g) Heatmap representation of genes related to neurotransmitter expression that were significantly different (P < 0.05) between the NN-SkM, NN and SC-NSCs groups. Z-scored LFQ intensities are depicted; red and blue represent increased and decreased values, respectively. Expression of genes associated with cholinergic (i), glutamatergic (j), and GABAergic synapses (k). The results were significant across every group, with data with data log-transformed to base 10 (n = 3, **P < 0.01). The data are presented as the means ± SDs in (hk). Scale bars: 20 μm in (af).
Fig. 4
Fig. 4
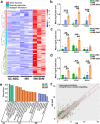
The expression of neuronal function-related genes in the NN-SkM assembloids. (a) Heatmap constructed from 109 upregulated (red) and downregulated (blue) genes with significant differences related to axon function, neuron projection and synapse formation by clustering analysis. Genes associated with axon function (b), neuron projection (c) and synapse formation (d). The results were significant across every group, with data input as values to the base 10 to allow log adjustment (n = 3, ***P < 0.001, **P < 0.01, *P < 0.05). (e) GO term enrichment analysis of the most highly expressed genes in the NN-SkM assembloids. (f) The scatter plot illustrates the expression levels of genes associated with neuronal activation and growth factor-related signaling across the NN and NN-SkM groups. Each point in the scatter plot corresponds to a gene, with the x-axis denoting the gene expression levels in the NN group and the y-axis representing the gene expression levels in the NN-SkM group. Genes exhibiting significant differences are depicted by red and orange dots, respectively, while genes with no significant differences are depicted in gray. The data are presented as the means ± SDs (n = 3) in (bd). BP = biological process; CC = cellular component; MF = molecular function.
Fig. 5
Fig. 5
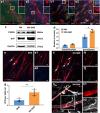
Synapse and NMJ formation in the NN-SkM assembloids. After 7 days of cultivation, neuronal cells in the NN (a) and NN-SkM assembloids (b) expressed postsynaptic density protein 95 (PSD95, green), a postsynaptic marker, and synaptophysin (SYP, white), a presynaptic marker, after 7 days of culture. (c) and (d) Western blot showing differential expression between the NN and NN-SkM groups (*P < 0.05). After 2D cultivation (e) and coculture with NN (f), SkM cells exhibited clusters with BTX. (g) Quantification of BTX clusters per SkM cell in the SkM and NN-SkM groups (**P < 0.01). (h) NF-positive neurons juxtaposed with BTX-positive SkM cells in the NN-SkM assembloids. Scale bars: 20 μm in (ab, ef); 5 μm in (h). Blots shown in Supplementary Fig. 2. The data are presented as the means ± SDs in (d) and (g). Arrows in Fig. 5e and f indicate the BTX clusters.
Fig. 6
Fig. 6
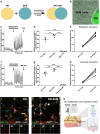
NN control of muscle activity. (a) Schematics showing the NN-SkM assembloid setup. (b) Representative image showing an NN-SkM assembloid. In the NN, the expression of Thy1-ChR2/EYFP resulted in green fluorescence. (c) Representative traces of SkM cell contraction after normalization to the prestimulation baseline, after optogenetic stimulation and after TTX application in the NN-SkM assembloids. (d) Quantification of SkM cell contraction before and after optogenetic stimulation and after TTX application showing the median number of events per subfield within a field over a 20-second interval (**P < 0.01; ***P < 0.001). (e) Quantification of displacement normalized to the baseline levels before and after optogenetic stimulation. (f) Representative traces of SkM cell contraction normalized to the prestimulation baseline, after glutamate stimulation, and after the application of MK-801 to the NN-SkM assembloids. (g) Quantification of SkM cell contraction before glutamate stimulation, after glutamate stimulation and after MK-801 application showing the median number of events in subfields per field in 20 s (**P < 0.01; ***P < 0.001). (h) Quantification of displacement normalized to the baseline before and after glutamate stimulation. (i) and (j) Neurons in the NN and NN-SkM groups were triple-stained for ChAT, Vglut1, and SYP, revealing the synaptic connections between glutamatergic and cholinergic neurons. (k) Schematic diagram of the multisynaptic motor regulation system in the NN-SkM assembloids. Scale bars: 10 μm in (ij).
Fig. 7
Fig. 7
The interaction mechanism between NN and SkM cells. (a) The network diagram represents the expression levels of five functional gene sets in the NN-SkM group compared with those in the NN group. Individual nodes between functional sets represent individual genes, and the color represents the log2FC value. (b) Network diagram showing the associations of genes enriched in different functional sets in the NN-SkM group compared with those in the NN group. The node size of the functional set represents the total number of candidate genes according to GO. (c) The expression profiles of SkM cells in the SkM and NN-SkM groups. (d) The expression profiles of IGF1-R, TrkC, p-AKT, AKT, p-PI3K, PI3K, p-ERK and ERK in the NN and NN-SkM groups are shown. (e) and (f) show the expression of TrkC in the NN and NN-SkM groups. (g) and (h) show the expression of IGF1-R in the NN and NN-SkM groups. (i) Relative expression levels of NT-3 and IGF-1 in SkM cells in the SkM and NN-SkM groups. (j) Bar chart showing the quantification of protein expression in the NN and NN-SkM groups based on Western blotting (*P < 0.05, ***P < 0.001). (k) Schematic diagram showing that neurotrophic factors secreted by SkM cells activate the PI3K-AKT and MAPK-ERK pathways within NNs. The data are presented as the means ± SDs (n = 3) in (i and j). Scale bars: 10 μm in (eh). Blots shown in Supplementary Fig. 2.

Similar articles

References

    1. Harley, P. et al. 3D Compartmentalised Human pluripotent stem cell-derived neuromuscular co-cultures. Bio-Protoc13, e4624 (2023). - PMC - PubMed
    1. Leng, Y. et al. Advances in in vitro models of neuromuscular junction: Focusing on organ-on-a-chip, organoids, and biohybrid robotics. Adv. Mater. Deerfield Beach Fla.35, e2211059 (2023). - PubMed
    1. Klim, J. R. et al. ALS-implicated protein TDP-43 sustains levels of STMN2, a mediator of motor neuron growth and repair. Nat. Neurosci.22, 167–179 (2019). - PMC - PubMed
    1. Zhang, K., Bai, L., Xu, W. & Shen, C. Human neuromuscular junction three-dimensional organoid models and the insight in motor disorders. J. Mol. Cell. Biol.13, 767–773 (2022). - PMC - PubMed
    1. Kim, H., Kim, G. S., Hyun, S. H. & Kim, E. Advancements in 2D and 3D in Vitro models for studying neuromuscular diseases. Int. J. Mol. Sci.24, 17006 (2023). - PMC - PubMed

Publication types

MeSH terms

Substances

LinkOut - more resources