Observational Study
. 2025 Feb;26(2):308-322.
doi: 10.1038/s41590-024-02059-6. Epub 2025 Jan 29.

Integrating single-cell RNA and T cell/B cell receptor sequencing with mass cytometry reveals dynamic trajectories of human peripheral immune cells from birth to old age

Affiliations
Observational Study

Integrating single-cell RNA and T cell/B cell receptor sequencing with mass cytometry reveals dynamic trajectories of human peripheral immune cells from birth to old age

Yufei Wang et al. Nat Immunol. 2025 Feb.

Abstract

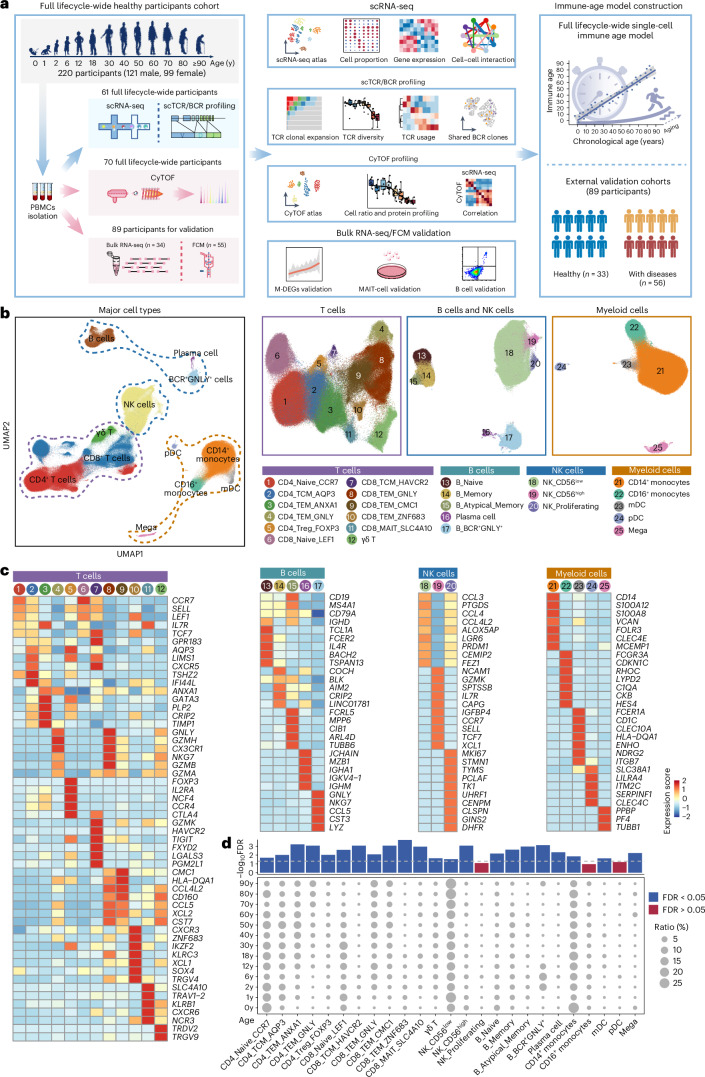
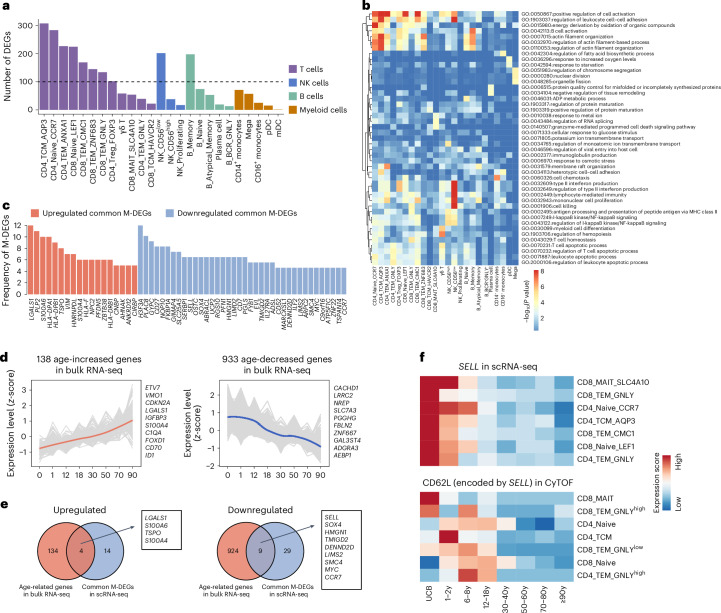
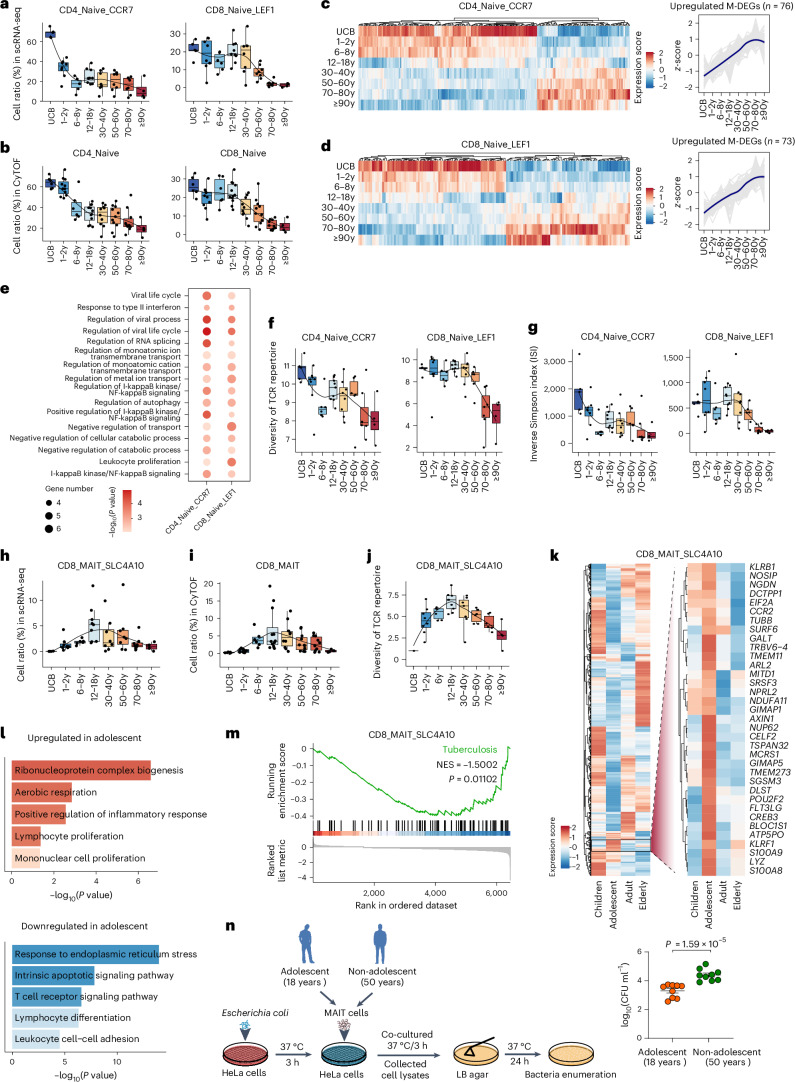
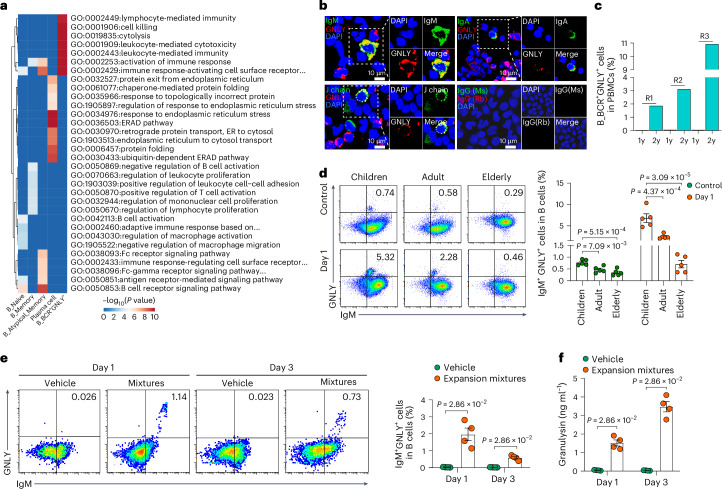
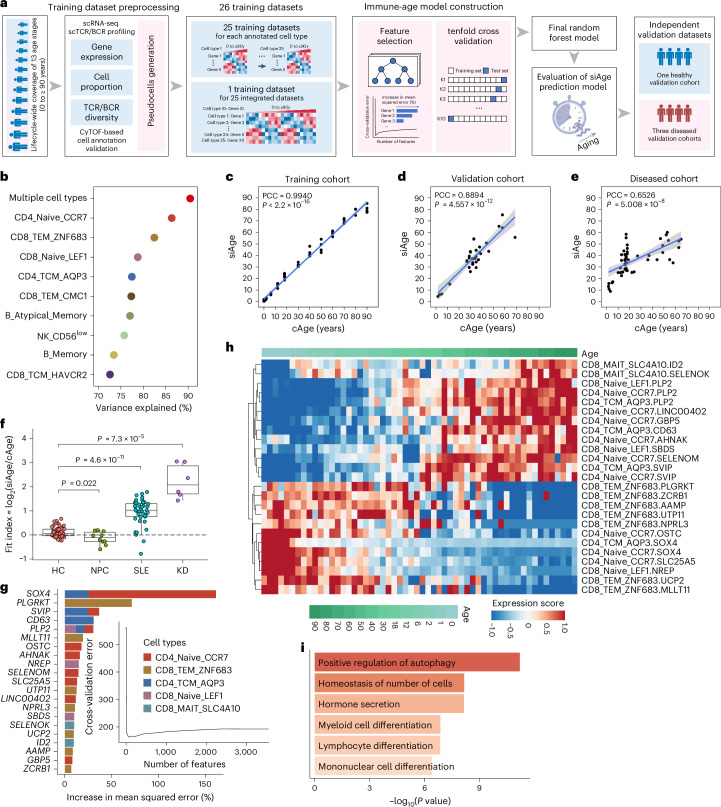
A comprehensive understanding of the evolution of the immune landscape in humans across the entire lifespan at single-cell transcriptional and protein levels, during development, maturation and senescence is currently lacking. We recruited a total of 220 healthy volunteers from the Shanghai Pudong Cohort (NCT05206643), spanning 13 age groups from 0 to over 90 years, and profiled their peripheral immune cells through single-cell RNA-sequencing coupled with single T cell and B cell receptor sequencing, high-throughput mass cytometry, bulk RNA-sequencing and flow cytometry validation experiments. We revealed that T cells were the most strongly affected by age and experienced the most intensive rewiring in cell-cell interactions during specific age. Different T cell subsets displayed different aging patterns in both transcriptomes and immune repertoires; examples included GNLY+CD8+ effector memory T cells, which exhibited the highest clonal expansion among all T cell subsets and displayed distinct functional signatures in children and the elderly; and CD8+ MAIT cells, which reached their peaks of relative abundance, clonal diversity and antibacterial capability in adolescents and then gradually tapered off. Interestingly, we identified and experimentally verified a previously unrecognized 'cytotoxic' B cell subset that was enriched in children. Finally, an immune age prediction model was developed based on lifecycle-wide single-cell data that can evaluate the immune status of healthy individuals and identify those with disturbed immune functions. Our work provides both valuable insights and resources for further understanding the aging of the immune system across the whole human lifespan.


Conflict of interest statement

Competing interests: The authors declare no competing interests.

Figures

Fig. 1
Fig. 1. Overview of single-cell transcriptomes of peripheral immune cells across each stage of the human lifespan.
a, Workflow of the overall experimental design of this study. Panel a created in BioRender. Huang, T. (2024) https://BioRender.com/a58r007. b, UMAP plot illustrating the peripheral immune cell subsets identified within PBMCs from 61 samples. c, Heatmaps showing the expression of signature genes in each cell subset. d, Dot plot showing the age-related variations in proportion of the 25 immune cell subsets across 13 age groups. Kruskal–Wallis one-way analysis was used to identify cell subsets with significant differences across age groups. FDR correction was applied to account for multiple testing and the values are shown above the dot plot. Horizontal dashed line marks the threshold for FDR significance (FDR < 0.05). mDCs, myeloid dendritic cells; pDCs, plasmacytoid dendritic cells; UMAP, uniform manifold approximation and projection; y, years. Source data
Fig. 2
Fig. 2. Global transcriptome dynamics of peripheral immune cells throughout the human lifespan.
a, Bar plot showing the number of DEGs derived from scRNA-seq analyses of all cell subsets. b, Heatmap showing the functional enrichment analyses of DEGs in all cell subsets. P values were determined by hypergeometric test. c, Bar plots showing the frequencies of upregulated and downregulated M-DEGs derived from scRNA-seq analyses observed in all cell subsets. All M-DEGs with a frequency of ≥5 are displayed. d, Line plots showing the expression trajectories of upregulated (left panel) and downregulated (right panel) age-related genes identified by bulk RNA-seq analyses. Data are shown in terms of gene expression z-score. Each gray line represents the expression trajectory of a gene. e, Venn diagrams showing the number of overlapping genes between common M-DEGs identified in scRNA-seq data and age-related genes identified in bulk RNA-seq data. Among the 56 common M-DEG genes defined by scRNA-seq, 13 intersected with the age-related genes defined by bulk RNA-seq. f, Heatmap showing the expression of SELL gene in seven cell subsets by scRNA-seq and CD62L protein (encoded by SELL) in corresponding cell subsets by CyTOF among eight life stages. Source data
Fig. 3
Fig. 3. Rewiring of CCIs among peripheral immune cells across the human lifespan.
a, Heatmap showing that CCI probability varied significantly across the lifespan. The probability for each CCI was row-scaled with a z-score. The significantly varied CCIs among eight different human life stages were determined using Kruskal–Wallis one-way analyses. P values were adjusted with FDR, and an adjusted P value (Padj) of <0.0001 was considered statistically significant. b, Bar plot showing that T cells experience the most intensive rewiring in CCIs with age. cf, Network graphs showing the CCI cluster 1 (c), cluster 2 (d), cluster 3 (e) and cluster 4 (f) from a. The hub cell subset of each cluster is highlighted with a larger node size in cf. The hub cell subset of each cluster is highlighted with a larger node size. g, Network graph showing the CCI network mediated by differentially expressed ligands and receptors. h, Bar plot showing the top ten biological processes enriched in the differentially expressed ligands and receptors. P values were determined by hypergeometric test. i, Box plot showing the average shortest path length and degree of immune checkpoints and non-immune checkpoints in g. Box plots show median, first (lower hinge) and third (upper hinge) quartiles; whiskers show 1.5× the interquartile range. P values were determined by a two-sided unpaired Wilcoxon rank-sum test. j, Bar plot showing, for each immune checkpoint ligand and receptor, the number of cell subsets in which they were detected as differentially expressed. k, Heatmaps showing the scaled expression of CD27, ICOS and PDCD1 genes across the lifespan in the indicated cell subsets, detected by scRNA-seq. l, Heatmaps showing the scaled expression of CD27, ICOS and PD1 proteins across the lifespan in the indicated cell subsets, detected by CyTOF. UCB, umbilical cord blood. Source data
Fig. 4
Fig. 4. Clonal expansion of T cells across the entire lifespan.
a, Stacked bar graph showing the distribution of T cell clone sizes in the 13 age groups. b, Heatmap showing the row-scaled usage of significantly differentially expressed V-J genes from TCR α-chains and TCR β-chains across six high-TCE groups (2, 6, 12, 70, 80 and 90 years). The six age groups were clustered into two distinct groups: the 2–12-year-old group (early life high-TCE group) and the 70–90-year-old group (late-life high-TCE group). c, Bar plot showing the distribution of T cell clone sizes in each αβ T cell subset. d,e, Box plot showing the clonal expansion levels of total αβ T cell subsets (d) and CD8_TEM_GNLY cells (e) across 13 age groups quantified by the STARTRAC-expa metric. The black line indicates LOESS regression. f, Volcano plot showing the DEGs in high-TCE CD8_TEM_GNLY cells (clone size ≥ 50 cells) in the late-life high-TCE group (70–90 years old) compared with those in the early life high-TCE group (2, 6 and 12 years old). The representative genes are labeled. Dashed lines demarcate two-sided Benjamini–Hochberg-corrected Padj = 0.05 and log2 fold change (FC) = 0.25. g, Bar plots showing the representative enriched biological processes of DEGs upregulated in high-TCE CD8_TEM_GNLY cells in early life (left panel) and in late life (right panel). P values were determined by hypergeometric test. h, Box plots showing the gene module scores for the pathways in high-TCE CD8_TEM_GNLY cells in the early life and late-life high-TCE groups. The two-sided Wilcoxon rank-sum test was used to calculate the P values. i, Rank for TF regulons in high-TCE CD8_TEM_GNLY cells in the early life (left panel) and late-life (right panel) high-TCE groups using the regulon specificity score. In d, e and h, box plots show median, first (lower hinge) and third (upper hinge) quartiles; whiskers show 1.5× the interquartile range. MHC, major histocompatibility complex; TF, transcription factor. Source data
Fig. 5
Fig. 5. Aging features of naive T cells and CD8+ MAIT cells.
a,b, Scatter plot illustrating changes in the proportion of CD4+ (CD4_Naive_CCR7; left) and CD8+ naive T cells (CD8_Naive_LEF1; right) in total αβ T cells with aging from scRNA-seq (a) and CyTOF (b). c,d, Heatmap showing the row-scaled expression of M-DEGs in CD4_Naive_CCR7 (c) and CD8_Naive_LEF1 (d) cells across eight life stages (left), and line plots showing the expression trajectories of M-DEGs upregulated with age (right). Expression z-scores are shown. e, Dot plot showing the representative enriched biological processes of M-DEGs upregulated with age in CD4+ and CD8+ naive T cells. f,g, Scatter plots showing TCR repertoire diversities in CD4+ (CD4_Naive_CCR7; left) and CD8+ naive T cells (CD8_Naive_LEF1; right) across eight life stages, as measured by Shannon’s entropy (f) and the inverse Simpson index (g). hj, Scatter plot illustrating the proportion changes of CD8_MAIT_SLC4A10 cells in total αβ T cells with aging from scRNA-seq (h) and CyTOF (i) analyses and their TCR repertoire diversities as measured by Shannon’s entropy (j) across eight life stages. k, Heatmap showing the expression of all the DEGs (left) and zoom-in on upregulated genes (right) in CD8_MAIT_SLC4A10 cells in adolescents (12–18 years old). l, Bar plots showing the representative enriched biological processes of upregulated (top) and downregulated (bottom) DEGs in CD8_MAIT_SLC4A10 cells in adolescents. m, GSEA enrichment plot for gene set ‘tuberculosis’ in CD8_MAIT_SLC4A10 cells in the adolescent group compared with other groups. n, Schematic diagram showing the design of MAIT cell’s bactericidal capability assay (left) and bar plot showing the bacteria load after MAIT cell co-culture. The P value was determined by two-sided unpaired Wilcoxon rank-sum test (right, n = 9 each). P values in e, l and m were determined by hypergeometric test. P < 0.05 was considered statistically significant in e, l, m and n. The black lines indicate LOESS regression in a, b, f and g. CFU, colony forming unit; GSEA, gene set enrichment analysis. Source data
Fig. 6
Fig. 6. Function of the newly identified cytotoxic B cell subset.
a, Heatmap showing the functional enrichment analyses of signature genes in each B cell subset based on the scRNA-seq analyses. The top ten pathways in each cell subset (ranked by P value) are listed. P values were determined by hypergeometric test. b, Immunofluorescence of B cell markers (IgM, IgA and J chain) and the cytotoxic protein granulysin (GNLY) in PBMCs collected from six healthy 6-year-olds. The experiment was repeated four times with similar results. c, Bar plot showing the percentage of B_BCR+GNLY+ cells in PBMCs from three infants with longitudinal follow-up, examined at the ages of 1 year and 2 years by scRNA-seq analyses. R1, R2 and R3 represent different individuals. d, Flow cytometry analysis showing proportions of IgM+GNLY+ cells in children (4–9 years old), adults (24–30 years old) and the elderly (64–72 years old), without stimulation (control, top left) and day 1 after in vitro stimulation with an expansion mixture consisting of IL-21 (10 ng ml−1), IL-2 (50 IU ml−1), CD40L (50 ng ml−1), anti-BCR (5 mg ml−1) and CpG ODN 2006 (1 mg ml−1) (bottom left) (n = 5 per group). Bar plots showing the percentage of IgM+GNLY+ cells in indicated groups (right panel). e, Flow cytometry analysis showing the proportion of IgM+GNLY+ cells in cultured human B cells on days 1 and 3 after in vitro stimulation with an expansion mixture (left panel) (n = 4 per group). Bar plots showing the percentage of IgM+GNLY+ cells in B cells from each group (right panel). f, Bar plots showing GNLY concentration in culture supernatants of B cells on days 1 and 3 of culture after in vitro stimulation with or without an expansion mixture. The concentrations of GNLY were determined by ELISA (n = 4 per group). In d, e and f, bar plots show the mean ± s.e.m.; P < 0.05 was considered statistically significant. P values in a were determined by hypergeometric test. P values in d were determined by one-way ANOVA followed by the Tukey post hoc test. P values in e and f were determined by two-sided unpaired Wilcoxon rank-sum test. ELISA, enzyme-linked immunosorbent assay. Source data
Fig. 7
Fig. 7. Construction of the single-cell immune age prediction model based on lifecycle-wide single-cell data.
a, Workflow of the single-cell immune age prediction model construction. b, Dot plot showing the predictive performance of the cell-type-specific immune age prediction models based on our lifecycle-wide single-cell data. The top ten cell types with the highest scores are shown. c, Scatter plot showing the correlation of single-cell immune age (siAge) with chronological age (cAge) in the training set (n = 56 samples). d, Scatter plot showing the correlation of siAge with cAge in the external healthy validation cohort (n = 33 samples). e, Scatter plot showing the correlation of siAge with cAge in the external validation cohort of diseased patients with disturbed immune functions (n = 56 samples). f, Box plot comparing the fit index distribution calculated by the siAge model in the healthy validation cohort with those of the diseased validation cohorts, which include NPC (n = 10 samples), SLE (n = 40 samples) and KD (n = 6 samples) cohorts. Box plots show median, first (lower hinge) and third (upper hinge) quartiles; whiskers show 1.5× the interquartile range. P values were determined by two-sided unpaired Wilcoxon rank-sum test. g, Bar plot showing the top 21 key genes identified by random forest regression. The genes are ranked in descending order of importance with respect to the accuracy of the model. The insert represents a tenfold cross-validation error as a function of the number of input features used to regress against the chronological ages. h, Heatmap showing the row-scaled expression of the top 21 key genes across age in corresponding cell subsets. i, Bar plot showing functional enrichment of the top 21 key genes. P values were determined by hypergeometric test. In ce, the blue line indicates linear regression; PCC and P values are indicated. The gray shadow covers the 95% confidence interval. In cf, P < 0.05 was considered statistically significant. KD, Kawasaki diseases; NPC, nasopharyngeal carcinoma; SLE, systemic lupus erythematosus. Source data
Extended Data Fig. 1
Extended Data Fig. 1. Basic characteristics of the integrated dataset and signature genes of 25 peripheral immune cell subsets covering 13 age groups.
a. UMAP plots showing the 25 peripheral immune cell subsets covering 13 age groups across the entire lifespan. Cell subsets are indicated in different colors. b. UMAP plots showing the distribution of expression of selected signature genes for 25 cell subsets. c. UMAP plots showing the distribution of expression of selected signature genes for 12 T cell subsets. d. Violin plots showing the distribution of expression of selected signature genes for 25 cell subsets. e. Violin plots showing the distribution of UMI counts (left panel) and gene counts (right panel) per cell type. B_BCR+GNLY+ cells are circled with dashed circle in (a) and (b). Source data
Extended Data Fig. 2
Extended Data Fig. 2. Validation of cell annotation derived from scRNA-seq data by CyTOF, Azimuth, and GSEA.
a. UMAP of integrated CyTOF data of peripheral immune cell subsets identified within the PBMCs. b. Heatmap showing the relative mean cluster gene and protein expressions in major immune cell types from scRNA-seq (left panel) and CyTOF (right panel) analyses, respectively. c. Heatmap showing the correlation between scRNA-seq-derived major cell types and CyTOF-derived major cell types, computed from expression of scRNA-seq variable genes and corresponding CyTOF protein markers. d. UMAP of T cell subsets identified in the integrated CyTOF data. e. Heatmap showing the relative mean cluster gene and protein expressions in T cell subsets from scRNA-seq (left panel) and CyTOF (right panel) analyses, respectively. f. Heatmap showing the correlation between the scRNA-seq-derived T cell subsets and the CyTOF-derived T cell subsets, computed from expression of scRNA-seq variable genes and corresponding CyTOF protein markers. g. Heatmap showing strong consistency of our cell annotations based on scRNA-seq and cell annotations predicted by the automated annotation tool, Azimuth. h. GSEA plots showing immunological signature gene sets enriched by the marker genes of each T cell subset, illustrating that our categorization of T cells based on scRNA-seq aligned with established findings. Source data
Extended Data Fig. 3
Extended Data Fig. 3. Cell composition dynamics of 25 peripheral immune cell subsets across 13 age groups.
a. Stacked bar graph showing the average proportion of each cell subset within total PBMCs based on scRNA-seq analyses across 13 age groups. bd. Scatter plots showing the correlation between age and the proportion of each cell subset based on the scRNA-seq analyses in Fig. 1d. (b) Cell subsets significantly positively correlated with age, (c) cell subsets significantly negatively correlated with age, (d) cell subsets enriched in certain age groups. eg. Scatter plots showing the correlation between age and the proportion of each cell subset based on the CyTOF analyses. (e) Cell subsets significantly positively correlated with age, (f) cell subsets significantly negatively correlated with age, (g) cell subsets enriched in certain age groups. In box plots b–g, median (center line), first and third quartiles (box), and extra 1.5× interguartile ranges (whiskers) are shown. In b, c, e, and f, Spearman correlation coefficient ρ and P values are indicated. A P value < 0.05 was considered statistically significant. Source data
Extended Data Fig. 4
Extended Data Fig. 4. Functional enrichment analyses of M-DEGs in peripheral immune cell subsets.
a. Bar plot showing the numbers of total M-DEGs defined by scRNA-seq in each cell subset. b. Bar plot showing the numbers of upregulated (left panel) and downregulated (right panel) M-DEGs in each cell subset. c. Heatmap showing the functional enrichment analyses of upregulated M-DEGs in different peripheral immune cell subsets. d. Heatmap showing the functional enrichment analyses of downregulated M-DEGs in different peripheral immune cell subsets. e. Functional enrichment network of the common M-DEGs in Fig. 2c. f. Functional enrichment network of the common M-DEGs in Fig. 2d. g, h. The DEGs were classified into distinct clusters by Mfuzz based on the temporal trajectories of their expression. The DEG clusters whose expression peaked in children (144 genes, g) and the elderly (90 genes, h) are shown. i. Heatmap showing the functional enrichment analyses of the genes whose expression peaked in children in (g). j. Heatmap showing the functional enrichment analyses of the genes whose expression peaked in the elderly in (h). k. The positive correlation of LGALS1 expression with age and the negative correlation of CCR7 and TMIGD2 expression with age via bulk RNA-seq analyses (n = 34 samples). The blue line indicates linear regression. The gray shadow covers the 95% confidence interval. Spearman correlation coefficient ρ and P values are indicated. A P value < 0.05 was considered statistically significant. P values were determined by hypergeometric test in c–f,i and j. DEG, differentially-expressed genes; M-DEGs, monotonically differentially expressed genes. Source data
Extended Data Fig. 5
Extended Data Fig. 5. Expression dynamics of differentially expressed immune checkpoints within immune cell subsets among the different life stages.
a. Heatmaps showing the row-scaled expression of immune checkpoint ligands in the indicated cell subsets across the eight life stages. b. Heatmaps showing the row-scaled expression of immune checkpoint receptors in the indicated cell subsets across the eight life stages. Source data
Extended Data Fig. 6
Extended Data Fig. 6. Characteristics of T cell subsets across the entire lifespan.
a. Bar plot showing the percentage of TCR detection in each αβ T cell subset and in total αβ T cells. b. Bar plot showing the frequency of CDR3 amino acid length from TCR α-chains (top panel) and TCR β-chains (bottom panel) across eight life stages. Error bar shows the mean ± SEM. c. Box plots showing the clonal expansion levels of each αβ T cell subset quantified by STARTRAC-expa metric in αβ T cell subsets across 13 age groups. d. Box plots showing TCR repertoire diversity in CD4+ naive T cells (CD4_Naive_CCR7; left panel), CD8+ naive T cells (CD8_Naive_LEF1; middle panel) and MAIT cells (CD8_MAIT_SLC4A10; right panel) across eight life stages. The diversity of TCR repertoires was measured by Chao1 method. e. Box plots showing TCR repertoire diversity in CD8_MAIT_SLC4A10 cells across eight life stages. The diversity of TCR repertoires was measured by Inverse Simpson Index. f. Representative gene interaction network of upregulated genes in (Fig. 5k) using the STRING database (https://string-db.org/). Edge thickness represents the strength of data support from the STRING database. g. Box plots showing normalized protein expression of CD161 (encoded by KLRB1) in CD8_MAIT cells in children (1–6 years old), adolescents (12–18 years old), adults (30–60 years old), and the elderly (70–90 years old) based on the CyTOF analyses. In box plots ce and g, median (center line), first and third quartiles (box), and extra 1.5× interquartile ranges (whiskers) are shown, and the black line indicates LOESS regression. CDR3, complementarity-determining region-3. Source data
Extended Data Fig. 7
Extended Data Fig. 7. Functional difference between B_BCR+GNLY+ cells and other peripheral immune cells with cytotoxic functions.
a. Upset plots showing the number of shared upregulated DEGs in B_BCR+GNLY+ cells compared with that in seven cytotoxic T cell subsets including CD4_TEM_GNLY, CD8_TCM_HAVCR2, CD8_TEM_ZNF683, CD8_TEM_CMC1, CD8_TEM_GNLY, CD8_MAIT_SLC4A10, and γδ T cells. b. Upset plots showing the number of shared upregulated DEGs in B_BC +GNLY+ cells compared with that in three cytotoxic NK cell subsets including NK_CD56low, NK_CD56high, and NK_Proliferating cells. c. Dot plots showing the representative enriched biological processes of upregulated DEGs in B_BCR+GNLY+ cells compared with those in seven cytotoxic T cell subsets. d. Dot plots showing the representative enriched biological processes of upregulated DEGs in B_BCR+ GNLY+ cells compared with those in three cytotoxic NK cell subsets. e. Box plots showing the expression score of cytotoxicity in B_BCR+GNLY+ cells and seven cytotoxic T cell and three cytotoxic NK cell subsets. Box plots show median (center line), first and third quartiles (box), and extra 1.5× interquartile ranges (whiskers) and the black line indicates LOESS regression. The dashed line indicates the median score of cytotoxicity in B_BCR+GNLY+ cells. P values were determined by the two-sided unpaired Wilcoxon rank-sum test. A P value < 0.05 was considered statistically significant. In c and d, P values were determined by hypergeometric test. Source data
Extended Data Fig. 8
Extended Data Fig. 8. Features of BCR across the human lifespan.
a. Bar plot showing the percentage of BCR detection in all peripheral immune cell subsets. b. UMAP plots showing selected shared BCR clones among different B cell subsets. c. Box plot showing the clonal expansion levels of total B cells (top left) and five B cell subsets across eight age stages quantified by STARTRAC-expa metric. d. Box plots showing the CDR3 amino acid length from BCR heavy chains (left panel) and BCR light chains (right panel) across eight life stages. After controlling for donor, Kruskal-Wallis test reveals no significant differences in CDR3 amino acid length across eight life stages (P > 0.05). In box plots c and d, median (center line), first and third quartiles (box), and extra 1.5× interquartile ranges (whiskers) are shown, and the black line indicates LOESS regression. Source data
Extended Data Fig. 9
Extended Data Fig. 9. Transcriptional regulatory characteristics of cell differentiation in the B cell subsets.
a. Heatmap showing the area under the curve values of TF regulons in each B cell subset. Numbers between brackets represent the regulon counts for respective TFs. The value for each TF regulon is a row-scaled Z-score. b. Rank for TF regulons in each B cell subset by the regulon specificity score. c. Heatmap showing the row-scaled expression of the top 10 TFs in each B cell subset shown in (b). TF, transcription factor. Source data
Extended Data Fig. 10
Extended Data Fig. 10. A graphic summary of the novel insights from this study.
We developed a comprehensive single-cell atlas of human peripheral immune cells across the lifespan from newborns to the elderly. Single-cell multi-omics analyses were performed to capture the diversity and dynamic trajectories of peripheral immune cells, revealing key age-specific features: a newly identified cytotoxic B-cell population enriched in children, expansion of mucosal-associated invariant T (MAIT) cells during adolescence, distinct aging patterns in naive CD4+ and CD8+ T cells, and clonal expansions of CD8+ T cells in both young and elderly individuals. Additionally, we constructed an immune age prediction model, which estimates immune age and identifies potential immune dysfunction. Created in BioRender. Huang, T. (2024) https://BioRender.com/a58r007.

References

    1. Mittelbrunn, M. & Kroemer, G. Hallmarks of T cell aging. Nat. Immunol.22, 687–698 (2021). - PubMed
    1. Moqri, M. et al. Biomarkers of aging for the identification and evaluation of longevity interventions. Cell186, 3758–3775 (2023). - PMC - PubMed
    1. Simon, A. K., Hollander, G. A. & McMichael, A. Evolution of the immune system in humans from infancy to old age. Proc. Biol. Sci.282, 20143085 (2015). - PMC - PubMed
    1. Tong, Z. et al. Single-cell RNA sequencing maps immune cell heterogeneity in mice with allogeneic cardiac transplantation. Cardiovasc. Innov. Appl.8, 988 (2023).
    1. Nikolich-Zugich, J. The twilight of immunity: emerging concepts in aging of the immune system. Nat. Immunol.19, 10–19 (2018). - PubMed

Publication types

MeSH terms

Substances