. 2025 Mar;26(3):497-510.
doi: 10.1038/s41590-024-02073-8. Epub 2025 Jan 29.

Signature cytokine-associated transcriptome analysis of effector γδ T cells identifies subset-specific regulators of peripheral activation

Affiliations

Signature cytokine-associated transcriptome analysis of effector γδ T cells identifies subset-specific regulators of peripheral activation

Daniel Inácio et al. Nat Immunol. 2025 Mar.

Abstract

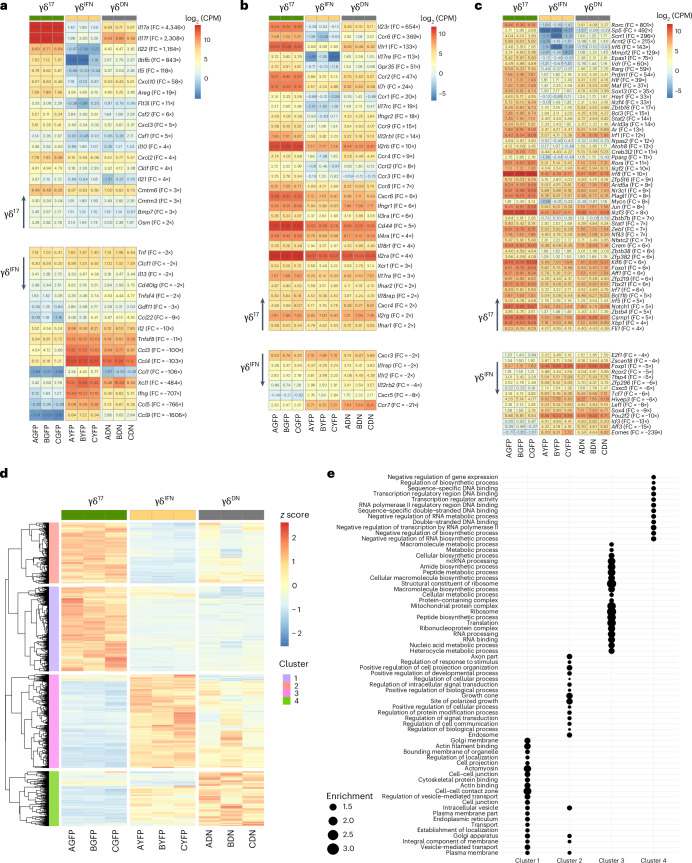
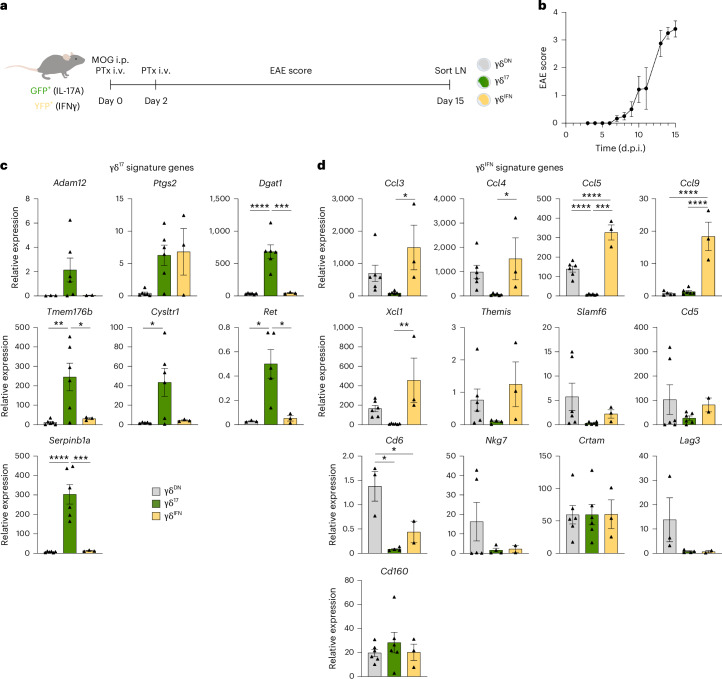
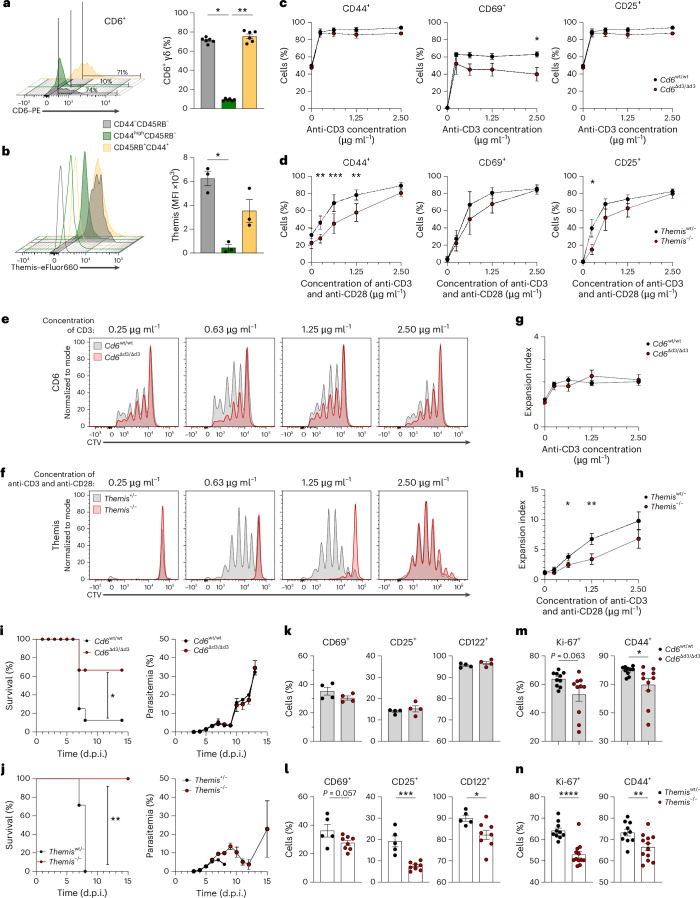
γδ T cells producing either interleukin-17A (γδ17 cells) or interferon-γ (γδIFN cells) are generated in the mouse thymus, but the molecular regulators of their peripheral functions are not fully characterized. Here we established an Il17a-GFP:Ifng-YFP double-reporter mouse strain to analyze at unprecedented depth the transcriptomes of pure γδ17 cell versus γδIFN cell populations from peripheral lymph nodes. Within a very high fraction of differentially expressed genes, we identify a panel of 20 new signature genes in steady-state γδ17 cells versus γδIFN cells, which we further validate in models of experimental autoimmune encephalomyelitis and cerebral malaria, respectively. Among the signature genes, we show that the co-receptor CD6 and the signaling protein Themis promote the activation and proliferation of peripheral γδIFN cells in response to T cell antigen receptor stimulation in vitro and to Plasmodium infection in vivo. This resource can help to understand the distinct activities of effector γδ T cell subsets in pathophysiology.


Conflict of interest statement

Competing interests: The authors declare no competing interests.

Figures

Fig. 1
Fig. 1. Characterization of the divergent transcriptomes of γδ17 versus γδIFN cells.
a, Schematic of the genomic alterations introduced in the double-reporter Il17a-GFP:Ifng-YFP mouse strain used for isolation of γδ17 and γδIFN cells. In each cytokine locus, a sequence for an independently translated fluorescent reporter protein was inserted downstream of the cytokine’s endogenous translational stop codon; UTR, untranslated region. b, Graphical overview of the protocol used to isolate the populations of interest. In short, cells were isolated from the pLNs of Il17a-GFP:Ifng-YFP reporter mice stimulated with PMA plus ionomycin and sorted by FACS accordingly to their fluorescence profiles; NGS, next-generation sequencing. c, Average proportion of GFP+ and YFP+ γδ T cells obtained by FACS (right; n = 9, three independent experiments) with a representative plot (left). d, Intracellular staining of IL-17 and IFNγ on sorted GFP+ or YFP+ γδ T cells. e, PCA plot of all nine samples used for RNA-seq data analysis based on normalized expression values. Each population of cells isolated (GFP+YFP (labeled GFP), GFPYFP+ (labeled YFP) and GFPYFP (labeled DN)) is represented by three independent samples labeled A, B and C, each composed of a pool of cells from several mice. f, Distance matrix showing the Euclidean distance of the different samples comparing normalized expression values (CPMs). Samples are clustered using hierarchical clustering. g, Venn diagram of expressed genes (defined as having a normalized CPM value of >1 in at least two of three samples of the group) in the different subsets. h, Venn diagram of differentially expressed genes (false discovery rate (FDR) of <0.05 and fold change of >1.5) of the different comparison pairs. ik, Volcano plots displaying the log2 (fold change) and log2 (FDR) resulting from a differential expression analysis comparing GFP+ versus YFP+ (i), GFP+ versus DN (j) and YFP+ versus DN (k). Some of the most significantly differentially expressed genes are annotated, focusing on genes selectively enriched in GFP+ (γδ17) or YFP+ (γδIFN) cells. Data are shown as mean ± s.d. (c); FC, fold change.
Fig. 2
Fig. 2. Gene families and pathways enriched in peripheral γδ17 versus γδIFN cells.
ac, Heat maps displaying the log2 (CPM) normalized expression values of differentially expressed genes more expressed in γδ17 (top) or in γδIFN (bottom) cells for cytokines (a), cytokine and chemokine receptors (b) and transcription factors (c). d, Heat map displaying the row-scaled z scores of normalized expression values of all differentially expressed genes. Genes were clustered using hierarchical clustering, and a cutting point was selected to obtain four groups. e, Gene Ontology (GO) terms significantly enriched in a GO enrichment analysis using GoRilla comparing the GO annotations of genes present in each individual cluster to annotations of the genes of all clusters.
Fig. 3
Fig. 3. Identification of signature genes in peripheral γδ17 versus γδIFN cells.
a,b,Heat maps displaying the log2 (CPM) normalized expression values of the 50 most enriched differentially expressed genes in γδ17 cells (a) and the 50 most enriched genes in γδIFN cells (b), ordered by fold change, in γδ17, γδIFN and γδDN cells. c,d, Heat maps displaying the log2 (CPM) normalized expression values of selected candidates (CPM > 30 with known biological function) enriched in γδ17 (c) and γδIFN (d) cells, manually grouped by functional categories, in γδ17, γδIFN, TH17 and TH1 cells.
Fig. 4
Fig. 4. Patterns of expression of γδ17 versus γδIFN signature genes across lymphoid organs.
a,b, γδDN (GFPYFP), γδ17 (GFP+) and γδIFN (YFP+) γδ T cells were sorted, and RNA was extracted and subjected to RT–qPCR analysis. Relative expression levels of γδ17 cell signature genes (a) and γδIFN cell signature genes (b) were normalized to that of Actb (β-actin); nd, not detected; Thy, thymus; Spl, spleen. Data are representative of one to four independent experiments. Each symbol indicates a pool of cells from several mice. Data are shown as mean ± s.e.m. and were analyzed by one-way analysis of variance (ANOVA) with a Tukey’s multiple comparisons test under the assumption of data normality; *P ≤ 0.05, **P ≤ 0.01, ***P ≤ 0.001 and ****P ≤ 0.0001.
Fig. 5
Fig. 5. Expression of signature genes in γδ17 and γδIFN cells in EAE induction.
a, Schematic representation of the experimental design. Double Il17a-GFP:Ifng-YFP reporter mice were subjected to EAE, and γδDN (GFPYFP), γδ17 (GFP+) and γδIFN (YFP+) cells from pLNs were isolated by FACS at the peak plateau stage (day 15) to perform RNA extraction, followed by RT–qPCR analysis; MOG, myelin oligodendrocyte glycoprotein; i.p., intraperitoneal; i.v., intravenous; PTx, pertussis toxin. b, EAE clinical score of Il17a-GFP:Ifng-YFP reporter mice (n = 8) until 15 days postimmunization (d.p.i.). c,d, Relative expression levels of validated γδ17 signature genes (c) and γδIFN signature genes (d) were normalized to Actb (β-actin). Data are representative of two to six independent experiments. Each symbol represents a pool of cells from several mice. Data are shown as mean ± s.e.m. and were analyzed by one-way ANOVA with a Tukey’s multiple comparisons test under the assumption of data normality; *P ≤ 0.05, **P ≤ 0.01, ***P ≤ 0.001 and ****P ≤ 0.0001.
Fig. 6
Fig. 6. Expression of signature genes in γδ17 and γδIFN cells following malaria infection.
a, Schematic representation of the experimental design. Double Il17a-GFP:Ifng-YFP reporter mice were infected with 2 × 104 P. berghei ANKA GFP sporozoites via retro-orbital injection, and γδDN (GFPYFP), γδ17 (GFP+) and γδIFN (YFP+) cells from pLNs were isolated by FACS at day 5 postinfection. b, Parasitemia of infected Il17a-GFP:Ifng-YFP reporter mice in days postinfection (n = 11). c,d, Relative expression levels of validated γδ17 signature genes (c) and γδIFN signature genes (d) were normalized to B2m2-microglobulin). Data are representative of two to four independent experiments. Each symbol represents a pool of cells from several mice. Data are shown as mean ± s.e.m. and were analyzed by one-way ANOVA with a Tukey’s multiple comparisons test under the assumption of data normality; *P ≤ 0.05, **P ≤ 0.01, ***P ≤ 0.001 and ****P ≤ 0.0001.
Fig. 7
Fig. 7. CD6 and Themis promote the activation and proliferation of peripheral CD27+ γδIFN-biased cells.
a,b, Flow cytometry analyses of the frequency of CD6+ cells within CD44CD45RB, CD44highCD45RB and CD45RB+CD44+ γδ T cell subsets from the pLNs of C57BL/6 mice (data are representative of two independent experiments; n = 6; a) or mean fluorescence intensity (MFI) of Themis (b) within those subsets from the pLNs of Themis+/– (filled histograms) and Themis−/− mice (empty histograms). In the MFI summary graph, each symbol corresponds to the subtraction of the autofluorescence from each subset in Themis−/− mice to that of the respective Themis+/– control (data are representative of three independent experiments; n = 3). c,d, Frequencies of CD44 or CD69 (at 48 h) and CD25 (at 72 h) expression in CTV-labeled CD27+ γδ T cells from the pLNs and spleens of Cd6Δd3/Δd3 and control mice stimulated for 72 h with increasing concentrations of soluble anti-CD3 in the presence of T cell-depleted splenocytes (data are representative of three independent experiments; n = 3; each replicate constitutes a pool of three mice; c) or Themis−/− and control mice after 72 h of stimulation with increasing concentrations of plate-bound monoclonal anti-CD3 plus anti-CD28 (data are representative of five (n = 5, 48 h) or eight (n = 8, 72 h) independent experiments; each replicate constitutes a pool of two mice). eh, Representative plots of CTV dilution at 72 h of proliferating CD27+ γδ T cells from Cd6Δd3/Δd3 (e) or Themis−/− (f) and control mice in the aforementioned culture systems (c and d) as well as respective expansion indexes for CD6 (n = 3; g) and Themis (n = 8; h). i,j, Survival (left) and parasitemia (right) of Cd6Δd3/Δd3 and control mice (n = 11; i) and Themis−/− and control mice (survival n = 7, parasitemia n = 14; j) infected with P. berghei ANKA GFP sporozoites. Data are representative of two independent experiments. k,l, Frequencies of CD69, CD25 and CD122 expression in γδIFN-committed CD45RB+CD44+ cells from the pLNs of infected Cd6Δd3/Δd3 (n = 4) and control (n = 4) mice (k) and Themis−/− (n = 8) and control (n = 5) mice (l) 5 days postinfection. Data are from one (Cd6) or two (Themis) independent experiments. m,n, Frequencies of Ki-67 and CD44 in IFNγ+ γδ T cells from the pLNs of infected Cd6Δd3/Δd3 (n = 10) and control (n = 10) mice (m) and Themis−/− (n = 12) and control (n = 10) mice (n). Data are from three independent experiments and are shown as mean ± s.e.m. Data were analyzed by Kruskal–Wallis test (a and b) or two-way ANOVA (c and d) and mixed effects model (g and h), under the assumption of data normality, for multiple comparisons. Survival data were analyzed by log-rank test (i and j), and single comparisons were analyzed by Mann–Whitney or t-test (k and n); *P ≤ 0.05, **P ≤ 0.01, ***P ≤ 0.001 and ****P ≤ 0.0001.
Extended Data Fig. 1
Extended Data Fig. 1. Characterization of γδ T cell subsets isolated from Il17a-GFP:Ifng-YFP reporter mice.
(a) Representative flow cytometry plots showing gating strategy used to identify γδ T cells subsets. Red arrows show sequence of gating strategy. (b) Characterization of the Vγ chain usage, as determined by Vγ1 and Vγ4 TCR staining, within the GFP+, YFP+ and DN γδ T cell populations of Il17a-GFP:Ifng-YFP reporter mice (n = 3 mice). Data are representative of one independent experiment and each symbol represents a biological replicate. (c) Representative flow cytometry plots displaying the expression of CD24, CD44 and CD45RB extracellular markers within the GFP+, YFP+ and DN γδ T cell subsets from the pLN of Il17a-GFP:Ifng-YFP reporter mice, and (d) the expression of GFP and YFP within CD24 CD44highCD45RB or CD45RB+CD44+ γδ T cell subsets from the pLN of reporter mice. (e) Representative flow cytometry plots displaying the expression of CD27 within the GFP+, YFP+ and DN γδ T cell subsets from the pLN of Il17a-GFP:Ifng-YFP reporter mice and (f) the expression of GFP and YFP within CD27 or CD27+ γδ T cell subsets from the pLN of reporter mice. (g) Representative flow cytometry plots and barplots displaying the frequencies of γδDN, γδ17 (GFP+) or γδIFN (YFP+) cells after 16 h of in vitro differentiation of γδDN sorted from the pooled pLN plus spleen of Il17a-GFP:Ifng-YFP reporter mice, cultured wither with IL-1β plus IL-23 or IL-12 plus IL-18 in the presence or absence of p.b. anti-CD3 mAb. Data are representative of two independent experiments and each symbol represents a biological replicate. Graphs display Mean ± SEM.
Extended Data Fig. 2
Extended Data Fig. 2. Comparison of expression profiles of effector γδ and CD4 + T cell subsets.
(a) PCA plot from mRNA-seq data analysis, comprising the three GFP and three YFP samples from pLN γδ T cell subsets, and two Th17 and two Th1 samples also isolated from Il17a-GFP:Ifng-YFP reporter mice but at the peak of experimental autoimmune encephalomyelitis (EAE). Each population of cells isolated – GFP+ (labelled GFP, in green); YFP+ (labelled YFP, in yellow), Th1 (in red) and Th17 (in blue) – is represented by its independent samples. (b) Venn diagram of the upregulated genes (FDR < 0.05 and fold change > 1.5) of the different comparison pairs. (c) Venn diagram of the downregulated genes (FDR < 0.05 and fold change > 1.5) of the different comparison pairs. (d) Heatmap displaying the log2(CPM) normalized expression values of the most enriched (ordered by fold change) differentially expressed genes in γδ17 and comparison with Th1 and Th17 profiles. (e) Heatmap displaying the log2(CPM) normalized expression values of the most enriched (ordered by fold change) differentially expressed genes in γδIFN and comparison with Th1 and Th17 profiles.
Extended Data Fig. 3
Extended Data Fig. 3. Expression of signature genes in Vγ-based subsets of γδ17 or γδIFN cells.
(a) γδ17 GFP+Vγ1Vγ4 and GFP+Vγ4+ and γδIFN YFP+Vγ1+ and YFP+Vγ4+ cells were sorted and RNA was extracted and subject to RT-qPCR analysis. Relative expression levels of (b) γδ17 signature genes or (c) γδIFN signature genes were normalised to β-actin (n = 4). Data are representative of one to four independent experiments. Each symbol is a pool of cells from several mice. Graphs display Mean ± SEM. One-way analysis of variance (ANOVA) test with Tukey’s multiple-comparisons test under the assumption of data normality. P* ≤ 0.05, **P ≤ 0.01, ***P ≤ 0.001, ****P ≤ 0.0001.
Extended Data Fig. 4
Extended Data Fig. 4. Expression of γδ17/γδIFN signature genes in ex vivo γδ17-biased CD44highCD45RB or γδIFN-biased CD45RB+CD44+ cells.
(a-b) Relative expression levels of (A) γδ17 and (B) γδIFN signature genes normalized to B2m (β2-microglobulin) in ex vivo CD24CD44highCD45RB and CD24CD45RB+CD44+ γδ T cells sorted from the pLN, liver (Lv) or testis (T) of C57BL/6 mice; n.d. means non-detected. Data are representative of seven independent experiments. Each symbol is a pool of cells from several mice. Graphs display Mean ± SEM. Two-tailed t-tests were performed under the assumption of data normality. P* ≤ 0.05, **P ≤ 0.01, ***P ≤ 0.001, ****P ≤ 0.0001.
Extended Data Fig. 5
Extended Data Fig. 5. Comparison of the expression of the γδ17/γδIFN signature genes in our bulk RNA-seq with publicly available scRNA-seq datasets.
(a-b) Heatmaps depicting the normalized scaled Seurat expression values for each of the 20 validated γδ17/γδIFN signature genes identified in our study in Il17a+ or Ifng + γδ T cells from the publicly-available Yang et al. (A) or du Halgouet et al. (B) single-cell RNA-seq datasets. (c) Heatmap displaying the log2(CPM) normalized expression values from pseudobulk counts of the 20 validated γδ17/γδIFN signature genes in Il17a+ or Ifng + γδ T cells from our dataset (LN) or those of of Yang et al. (LN) and du Halgouet et al. [LN, spleen, liver, lung, small intestine (SI), large intestine (LI) and skin] and (d) barplots displaying log2(FC) estimated values of the validated γδ17/γδIFN signature genes between those same Il17a+ or Ifng + γδ T cells from the three datasets.
Extended Data Fig. 6
Extended Data Fig. 6. Analysis of thymic γδ T cell subsets in CD6 mutant or Themis-deficient mice.
(a) Frequency and (b) total cell counts of γδ T cells in the thymus of adult CD6Δd3/Δd3 and littermate CD6 control mice. (c) Frequency of Vγ usage of γδ T cells in the thymus of adult CD6Δd3/Δd3 and littermate CD6 control mice. (d) Frequency of thymic γδ T cells committed to the CD24 CD44CD45RB, CD44highCD45RB, CD45RB+CD44 and CD45RB+CD44+ subsets in the thymus of adult CD6Δd3/Δd3 and littermate CD6 control mice. (e) Frequency of IL-17+, IFN-γ+ or IL-17IFN-γ double negative (DN) γδ T cells from the thymus of adult CD6Δd3/Δd3 and littermate CD6 control mice upon in vitro stimulation with PMA/ionomycin in the presence of Brefeldin A. (f) Frequency and (g) total cell counts of γδ T cells in the thymus of adult Themis−/− and littermate Themis+/− control mice. (h) Frequency of Vγ usage of γδ T cells in the thymus of adult Themis−/− and littermate Themis+/− control mice. (i) Frequency of thymic γδ T cells committed to the CD24 CD44CD45RB, CD44highCD45RB, CD45RB+CD44 and CD45RB+CD44+ subsets in the thymus of adult Themis−/− and littermate Themis+/− control mice. (j) Frequency of IL-17+, IFN-γ+ or IL-17IFN-γ double negative (DN) γδ T cells from the thymus of adult Themis−/− and littermate Themis+/− control mice upon in vitro stimulation with PMA/ionomycin in the presence of Brefeldin A. All data are representative of two independent experiments (n = 6 mice), and each symbol represents a biological replicate. Graphs display Mean ± SEM. Two-tailed Mann-Whitney (A-B, F-G) or multiple comparisons Kruskal-Wallis (C-E, H-J) tests.
Extended Data Fig. 7
Extended Data Fig. 7. Activation and proliferation of peripheral γδ17-biased CD27 γδ T cells from CD6 mutant or Themis-deficient mice.
(a) Gating strategy used to identify the CD24 γδ T cell subsets in which CD6 or Themis protein expression was analysed: CD44CD45RB, CD44highCD45RB and CD45RB+CD44+, with a representative plot of CD6 expression in the three subsets. (b) Frequencies of CD44, CD69 and CD25 expression in CTV-labelled CD27- γδ T cells sorted from pooled pLN and spleen of CD6Δd3/Δd3 or littermate CD6 control mice stimulated for 48 hours with soluble anti-CD3 (1.25 µg/mL) in the presence of T cell-depleted splenocytes. Data are from two independent experiments, n = 2. Each symbol represents a pool of cells from three mice (c) Frequencies of CD44, CD69 and CD25 expression and (d) expansion index of CTV-labelled CD27 γδ T cells sorted from pooled pLN and spleen of Themis−/− and littermate Themis+/− control mice upon 48 hours of in vitro stimulation with plate-bound anti-CD3 and anti-CD28 (2.5 µg/mL). Themis data are representative of six independent experiments, n = 6; each symbol in the graphs represents a pool of cells from two mice used in each experiment. (e) Gating strategy used to identify IFN-γ+ γδ T cells from the pLN of P. berguei infected mice at day 5 post infection, with representative plots of KI-67 and CD44 expression in these cells. Graphs display Mean ± SEM. Two-tailed Mann-Whitney test.

References

    1. Ribot, J. C., Lopes, N. & Silva-Santos, B. γδ T cells in tissue physiology and surveillance. Nat. Rev. Immunol.21, 221–232 (2021). - PubMed
    1. Silva-Santos, B., Mensurado, S. & Coffelt, S. B. γδ T cells: pleiotropic immune effectors with therapeutic potential in cancer. Nat. Rev. Cancer19, 392–404 (2019). - PMC - PubMed
    1. Ribot, J. C. et al. γδ-T cells promote IFN-γ-dependent Plasmodium pathogenesis upon liver-stage infection. Proc. Natl Acad. Sci. USA116, 9979–9988 (2019). - PMC - PubMed
    1. Chora, A. F. et al. Interplay between liver and blood stages of Plasmodium infection dictates malaria severity via γδ T cells and IL-17-promoted stress erythropoiesis. Immunity56, 592–605 (2023). - PubMed
    1. Fiala, G. J., Gomes, A. Q. & Silva-Santos, B. From thymus to periphery: molecular basis of effector γδ-T cell differentiation. Immunol. Rev.298, 47–60 (2020). - PMC - PubMed

MeSH terms

LinkOut - more resources