. 2025 Jan 29:10.1038/s41587-024-02523-6.
doi: 10.1038/s41587-024-02523-6. Online ahead of print.

AAV capsid prioritization in normal and steatotic human livers maintained by machine perfusion

Affiliations

AAV capsid prioritization in normal and steatotic human livers maintained by machine perfusion

Jae-Jun Kim et al. Nat Biotechnol. .

Abstract

Therapeutic efficacy and safety of adeno-associated virus (AAV) liver gene therapy depend on capsid choice. To predict AAV capsid performance under near-clinical conditions, we established side-by-side comparison at single-cell resolution in human livers maintained by normothermic machine perfusion. AAV-LK03 transduced hepatocytes much more efficiently and specifically than AAV5, AAV8 and AAV6, which are most commonly used clinically, and AAV-NP59, which is better at transducing human hepatocytes engrafted in immune-deficient mice. AAV-LK03 preferentially transduced periportal hepatocytes in normal liver, whereas AAV5 targeted pericentral hepatocytes in steatotic liver. AAV5 and AAV8 transduced liver sinusoidal endothelial cells as efficiently as hepatocytes. AAV capsid and steatosis influenced vector episome formation, which determines gene therapy durability, with AAV5 delaying concatemerization. Our findings inform capsid choice in clinical AAV liver gene therapy, including consideration of disease-relevant hepatocyte zonation and effects of steatosis, and facilitate the development of AAV capsids that transduce hepatocytes or other therapeutically relevant cell types in the human liver with maximum efficiency and specificity.


Conflict of interest statement

Competing interests: The authors declare no competing interests.

Figures

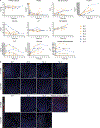
Extended Data Fig. 1 |
Extended Data Fig. 1 |. Long-term NMP of a steatotic and fibrotic human liver.
a, Flowchart illustrating the workflow for long-term NMP and analysis of human livers. b, Hematoxylin and eosin (H&E), collagen (Sirius Red) and lipid (Oil Red O) stainings of liver tissue samples after NMP; scale bars, 100 μm. c, Immunofluorescence for ACTA2, VIM and PDGFRA in liver tissue samples after NMP; scale bars, 50 μm. d, Parameters of viability and function measured during NMP. e, Hemodynamic parameters measured during NMP. ALP, alkaline phosphatase; ALT, alanine aminotransferase; AST, aspartate aminotransferase; IVC, inferior vena cava; LDH, lactate dehydrogenase; UA, uric acid.
Extended Data Fig. 2 |
Extended Data Fig. 2 |. Hemoconcentration mimicking renal function.
a, Stainings of liver tissue samples before (H&E, Sirius Red) and after (Oil Red O) NMP; scale bars, 50 μm. b,c, Levels of waste metabolites (b) and electrolytes (c) measured in perfusate during NMP. Red arrows indicate start of hemoconcentration at 11.5 h of NMP.
Extended Data Fig. 3 |
Extended Data Fig. 3 |. Removal of neutralizing antibodies against AAV capsids by PRBC washing.
a, Measurement of NAbs against AAV capsids by in vitro neutralization assay in plasma from unwashed or washed PRBCs (washing protocols I and II described in Supplementary Methods) with AAV vectors. b, Measurement of NAbs against the AAV8 capsid in plasma from NL 1 perfusate during NMP. Human intravenous immunoglobulin (IVIG) was used as a positive control. Values are presented as mean ± s.d. (n = 3, technical replicates).
Extended Data Fig. 4 |
Extended Data Fig. 4 |. Long-term NMP of normal and steatotic human livers.
a, Parameters of viability and function measured during NMP of normal and steatotic livers. b, TUNEL assay on liver tissue samples before and after NMP. Of note, pre-NMP biopsy was not performed for SL 1; scale bars, 100 μm.
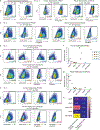
Extended Data Fig. 5 |
Extended Data Fig. 5 |. AAV testing in wild-type and humanized mouse livers.
a, Flow cytometry of hepatocytes released from livers of wild-type mice 2 days after intravenous injection of AAV vector preparations that were used in NL 1 (left) and NL 2 (right). be, Flow cytometry of human or mouse hepatocytes released from livers of FRGN or wild-type mice 2 days after intravenous injection of AAV vector preparations that were used in SL 3 (b), NL 3 (c), NL 4 (d) or SL 4 (e). f,g, Quantification of transduced human (f) and mouse (g) hepatocytes by flow cytometry. h, Heatmap showing relative levels of AAV fluorescent protein expression in human (left) and mouse (right) hepatocytes normalized to the levels of AAV8. For each AAV capsid, the levels were averaged across different mice.
Extended Data Fig. 6 |
Extended Data Fig. 6 |. Flow cytometry/FACS of the principal liver cell populations in human liver.
a, FACS of CD26+ hepatocytes (left) released from human liver tissue followed by analysis of cell type-specific markers by qRT-PCR (right). Nonparenchymal cells (NPCs) were excluded by gating on the CD45CD31EPCAMPDGFRB population. b, FACS of NPCs (monocytes/macrophages, endothelial cells and cholangiocytes) from human liver tissue (top) followed by analysis of cell-type-specific markers by qRT-PCR (bottom). c, Differential PDGFRB and CD90 expression in hepatic stellate cells (HSCs) and fibroblasts/activated HSCs released from SL 1 and analyzed by scRNA-seq. d, FACS of mesenchymal cells (left) followed by analysis of cell-type-specific markers by qRT-PCR (right). Bar graphs represent mean ± s.d. (n = 3, technical replicates).
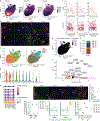
Extended Data Fig. 7 |
Extended Data Fig. 7 |. Analysis of disease state and unique hepatocyte subpopulation.
a, Expression density plots for periportal zonation, pericentral zonation and steatosis gene module scores. b, Immunofluorescence for CXCL8 and Bodipy 493/503 labeling in liver tissue samples; scale bars, 200 μm; PV, portal vein; CV, central vein. c, UMAPs of 22,146 hepatocytes from four livers analyzed by scRNA-seq and clustered according to gene expression (left) or sample identity (right). d, Normalized and log-transformed expression levels of steatosis gene module score in cell clusters from (c). e, Gene expression profile of differentially expressed genes from clusters 5, 3 and 9. f, Kernel density estimation histograms of hepatocytes transduced by the AAV6 capsid or AAV-NP59 capsid across gene module scores. g, Expression density plot showing cluster of nonzonated hepatocytes expressing SPP1, SOX9 and TACSTD2. h, Population distribution of cluster of nonzonated hepatocytes expressing SPP1, SOX9 and TACSTD2 across four livers. i, Volcano plot showing top differentially expressed genes in the cluster of nonzonated hepatocytes expressing SPP1, SOX9 and TACSTD2. Inflammatory (CXCL6, CXCL10, CXCL8, CXCL2), fibrogenic (TIMP1), steatosis (UBD, DEFB, IL32) and cholangiocyte (SOX4, SOX9, SPP1, TM4SF1, TACSTD2) marker genes are upregulated, while hepatocyte identity genes (CYP2E1, CYP1A2) and FADS1 are downregulated. P values were calculated using Wilcoxon rank-sum test and adjusted with Bonferroni’s correction. j, Immunofluorescence for TROP2 in liver tissue samples (left) and quantification of TACSTD2-expressing hepatocytes in scRNA-seq (right); scale bar, 200 μm. White arrowheads indicate hepatocytes positive for both TROP2 and HNF4A. k, Co-expression of TACSTD2 and MKI67 or TOP2A visualized by percent overlap (left) or expression relationship (right) in TACSTD2-expressing cells. l, Quantification of AAV transgene mRNA-expressing TACSTD2-expressing hepatocytes.
Extended Data Fig. 8 |
Extended Data Fig. 8 |. AAV vector DNA analysis in human and mouse livers.
ac, Quantification of circular episomes (a), total AAV vector DNA (vgs) in circular episomes (b) and average number of vgs per episome (c) in total DNA from Huh-7 cells 3 days after AAV vector transduction. Three AAV vectors were separately or simultaneously transduced at multiplicities of infection of 20,000 for the AAV8 capsid, 1,000 for the AAV5 capsid and 100 for the AAV-LK03 capsid. Values are presented as mean ± s.d. (n = 3, technical replicates). Means were compared using two-tailed unpaired t-tests. d,e, Quantification of total vgs (d) and transgene mRNA (e) in iPS cell-Heps 7 days after AAV vector transduction. Cells were treated with 200 μM palmitic acid every 2 days for 9 days. Values are presented as mean ± s.d. (n = 3, technical replicates). Means were compared using two-tailed unpaired t-tests. f, Quantification of circular episomes in nuclei from segment three of human livers by treatment with T5 exonuclease. g,h, Quantification of AAV transgene mRNA (g) and ratio between AAV transgene mRNA and total vgs in circular episomes (h) in tissue samples from mouse livers repopulated with human hepatocytes after co-injection of AAV vectors at the same dose of 4.0 × 10¹⁰ vgs. Values are presented as mean ± s.d. (six lobes from two mice at day 14, nine lobes from three mice at day 42, nine lobes from three mice at day 70; biological replicates). Means were compared using two-tailed unpaired t-tests. il, Quantification of vgs with treatment of T5 exonuclease alone (i), PS-DNase alone (j), PS-DNase combined with restriction enzymes (k) and the average number of vgs per episome (l) in total DNA from wild-type mouse livers. Four AAV vectors were co-injected at a dose of 2.0 × 10¹⁰ vgs each. Values are presented as mean ± s.d. (n = 3 mice at day 3, n = 3 mice at day 16, n = 2 mice at day 40; biological replicates). Means were compared using two-tailed unpaired t-tests.
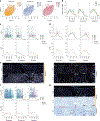
Extended Data Fig. 9 |
Extended Data Fig. 9 |. AAV vector transduction in non-hepatocytes.
a, Cell-type-specific markers used to identify monocyte/macrophage subtypes. b, Cell-type-specific markers used to identify endothelial cell subtypes. ECs, endothelial cells; LSECs, liver sinusoidal endothelial cells; PC, pericentral; PP, periportal. c, Quantification of AAV transgene mRNA-expressing LSECs normalized to the levels of AAV8. d, Percent of LSECs or hepatocytes expressing either MKI67 or TOP2A.
Fig. 1 |
Fig. 1 |. Efficiency and specificity of hepatocyte transduction by the AAV8 capsid in normal human liver.
a, Cartoon showing cannulation of human liver and direction of flow in blood vessels and the bile duct (gall bladder removed). b, Images of cannulated and perfused NL 1 (left) and AAV8–eYFP vector infusion into the portal vein (right). Cannula colors are the same in a and b, where yellow indicates the portal vein, red indicates the hepatic artery, blue indicates the inferior vena cava, and the black arrowhead indicates the bile duct. c, Viability and function measured during NMP of NL 1 and NL 2. Of note, in NL 2, infusion of 1 U of PRBCs at 60 h precipitated an increase in lactate. In NL 1, bile production was not recorded between 0 and 11 h due to a mispositioned bile duct cannula. d, Uniform manifold approximation and projection (UMAP) of 6,959 liver cells analyzed by scRNA-seq and clustered according to cell identity; NK, natural killer. e, Left, distribution of AAV8+ cells in scRNA-seq. Right, percentage and absolute number of AAV8+ cells in each cell population. f, Immunofluorescence for GFP (AAV8), FAH (hepatocytes), CD31 (endothelial cells) and CD68 (monocytes/macrophages) in tissue samples from NL 2 after NMP. White arrowheads indicate cells positive for both GFP and the respective cell-type-specific marker; scale bars, 25 μm. g, Flow cytometry (left) with quantification (right) of AAV8-transduced cells released from NL 2 after 62 h of NMP; FP, fluorescent protein. h,i, Quantification of AAV vgs per diploid genome (h) and transgene (TG) mRNA expression (i) in isolated hepatocytes and tissue samples from NL 1 and NL 2. NL 1 received 5.7 × 10¹² vgs and NL 2 received 1.6 × 10¹³ vgs. Values are presented as mean ± s.d. (n = 2 except n = 3 hepatocytes in h; technical replicates); Seg, segment; Seg mean, mean expression values of all eight segments. j, ISH of AAV vector DNA using an eGFP sense probe (top) and both AAV vector DNA and mRNA using an eGFP antisense probe (bottom) combined with immunofluorescence for GFP in tissue samples from NL 1 and NL 2; scale bars, 25 μm.
Fig. 2 |
Fig. 2 |. Comparison of efficiency and specificity of hepatocyte transduction by the AAV8, AAV5, AAV-LK03, AAV6 and AAV-NP59 capsids in normal and steatotic human livers.
a, Assignments of AAV capsids to human livers for side-by-side comparison. SL 3 received 3.4 × 10¹³ vgs, NL 3 received 5.5 × 10¹² vgs, NL 4 received 6.7 × 10¹¹ vgs and SL 4 received 3.0 × 10¹² vgs of each vector. Of note, the low-producing AAV6 capsid dictated the lower dose in NL 4. b, UMAP of 35,807 cells from four livers analyzed by scRNA-seq and clustered according to cell identity; ECs, endothelial cells; LSECs, liver sinusoidal endothelial cells; HSCs, hepatic stellate cells; VSMCs, vascular smooth muscle cells. c, UMAP showing cells transduced by AAV capsids. d, Heat map showing percent transduction by AAV capsids across cell populations. e,f, Quantification of AAV transgene mRNA-expressing hepatocytes by scRNA-seq (e) and ddPCR (f). g, Quantification of AAV fluorescent protein-expressing hepatocytes by flow cytometry. h, Quantification of AAV vector DNA (vgs) per diploid genome in hepatocytes by ddPCR. i, Heat map showing the relative levels of AAV vector mRNA, protein and DNA among five AAV capsids normalized to the levels of AAV8. The levels from four livers were averaged for each capsid. j, Heat map showing the relative levels of the ratio between AAV transgene mRNA and total AAV vector DNA from hepatocytes (top row) and AAV transgene mRNA and uncoated nuclear AAV vector DNA from tissue samples (bottom row). Levels were normalized to the levels of AAV8 and averaged from four livers for each capsid.
Fig. 3 |
Fig. 3 |. Comparison of zonation of hepatocyte transduction by the AAV8, AAV5, AAV-LK03, AAV6 and AAV-NP59 capsids in normal and steatotic human livers.
a, Gene module scores for periportal and pericentral zonation and steatosis applied to UMAPs of 22,146 hepatocytes from four livers analyzed by scRNA-seq. b, Kernel density estimation histograms of transgene-positive hepatocyte distribution across gene module scores. c, Kernel density estimation histograms of hepatocytes transduced by the AAV8 capsid across gene module scores (top) and separated by disease state (bottom). d, Kernel density estimation histograms of hepatocytes transduced by the AAV5 capsid across gene module scores (top) and separated by disease state (bottom). e, ISH of AAV8 and AAV5 vector DNA with sense probes in tissue samples; scale bars, 25 μm; PP, periportal; PC, pericentral. f, Kernel density estimation histograms of hepatocytes transduced by the AAV-LK03 capsid across gene module scores (top) and separated by disease state (bottom). g, ISH of AAV-LK03 vector DNA with sense probes in tissue samples. Kernel density estimation histograms for AAV6 and AAV-NP59 capsids are shown in Extended Data Fig. 7f; scale bars, 25 μm.
Fig. 4 |
Fig. 4 |. Efficiency of AAV vector episome formation in normal and steatotic human hepatocytes.
a, Schematics showing predicted AAV vg structures following treatment with Plasmid-Safe DNase (PS-DNase) alone or in combination with restriction enzymes (XbaI and SphI). PS-DNase treatment allows for quantification of circular episomes by digital PCR; additional restriction enzyme treatment allows for quantification of total vector DNA (vgs) in circular episomes; H–T, head to tail; H–H, head to head; T–T, tail to tail. b,c, Quantification of circular episomes (b) and total vgs in circular episomes (c) in nuclei from segment three of human liver tissues. BmtI and SphI were used to cut vector DNA from SL 3. d, Quantification of the average number of vgs per episome in nuclei from segment three of normal livers (NL 2, NL 3 and NL 4) and steatotic livers (SL 3 and SL 4). The average number was calculated by dividing the number in c by the number in b. eg, Quantification of circular episomes (e), total vgs in circular episomes (f) and the average number of vgs per episome (g) in total DNA from iPS cell-Heps 7 days after AAV vector transduction. Three AAV vectors were cotransduced at multiplicities of infection of 20,000 for the AAV8 capsid, 1,000 for the AAV5 capsid and 30 for the AAV-LK03 capsid. Palmitic acid was added at 200 μM every 2 days for 9 days. Values are presented as mean ± s.d. (n = 3, technical replicates). hj, Quantification of circular episomes (h), total vgs in circular episomes (i) and the average number of vgs per episome (j) in tissue samples from FRGN mouse livers repopulated with human hepatocytes after co-injection of AAV vectors at the same dose of 4 × 10¹⁰ vgs. Values are presented as mean ± s.d. (six lobes from two mice at day 14, nine lobes from three mice at day 42 and nine lobes from three mice at day 70; biological replicates). Means were compared using two-tailed unpaired t-tests.
Fig. 5 |
Fig. 5 |. Efficiency of transduction of monocyte/macrophage and endothelial cell subtypes by the AAV8, AAV5, AAV-LK03, AAV6 and AAV-NP59 capsids in normal and steatotic human livers.
a, UMAP of 2,759 monocytes/macrophages from four livers clustered according to cell subtype. b, Population distribution of monocyte/macrophage subtypes. c, AAV-transduced cells visualized by UMAP. d, Heat map showing percent transduction by AAV capsids of monocyte/macrophage subtypes. e, Quantification of AAV transgene mRNA-expressing Kupffer cells by scRNA-seq. f, UMAP of 2,091 endothelial cells from four livers clustered according to cell subtype; ECs, endothelial cells; LSECs, liver sinusoidal endothelial cells; PP, periportal; PC, pericentral. g, Population distribution of endothelial cell subtypes. h, AAV-transduced cells visualized by UMAP. i, Heat map showing percent transduction by AAV capsids of endothelial cell subtypes. j, Quantification of AAV transgene mRNA-expressing LSECs by scRNA-seq.

References

    1. Zabaleta N, Unzu C, Weber ND & Gonzalez-Aseguinolaza G Gene therapy for liver diseases—progress and challenges. Nat. Rev. Gastroenterol. Hepatol. 20, 288–305 (2023). - PubMed
    1. De Wolf D, Singh K, Chuah MK & VandenDriessche T Hemophilia gene therapy: the end of the beginning? Hum. Gene Ther. 34, 782–792 (2023). - PubMed
    1. Nathwani AC Gene therapy for hemophilia. Hematology 2022, 569–578 (2022). - PMC - PubMed
    1. Gramignoli R, Vosough M, Kannisto K, Srinivasan RC & Strom SC Clinical hepatocyte transplantation: practical limits and possible solutions. Eur. Surg. Res. 54, 162–177 (2015). - PubMed
    1. Piccolo P, Rossi A & Brunetti-Pierri N Liver-directed gene-based therapies for inborn errors of metabolism. Expert Opin. Biol. Ther. 21, 229–240 (2021). - PubMed

LinkOut - more resources