. 2025 Jan 29;16(1):1138.
doi: 10.1038/s41467-024-55259-x.

Intricacies of human-AI interaction in dynamic decision-making for precision oncology

Affiliations

Intricacies of human-AI interaction in dynamic decision-making for precision oncology

Dipesh Niraula et al. Nat Commun. .

Abstract

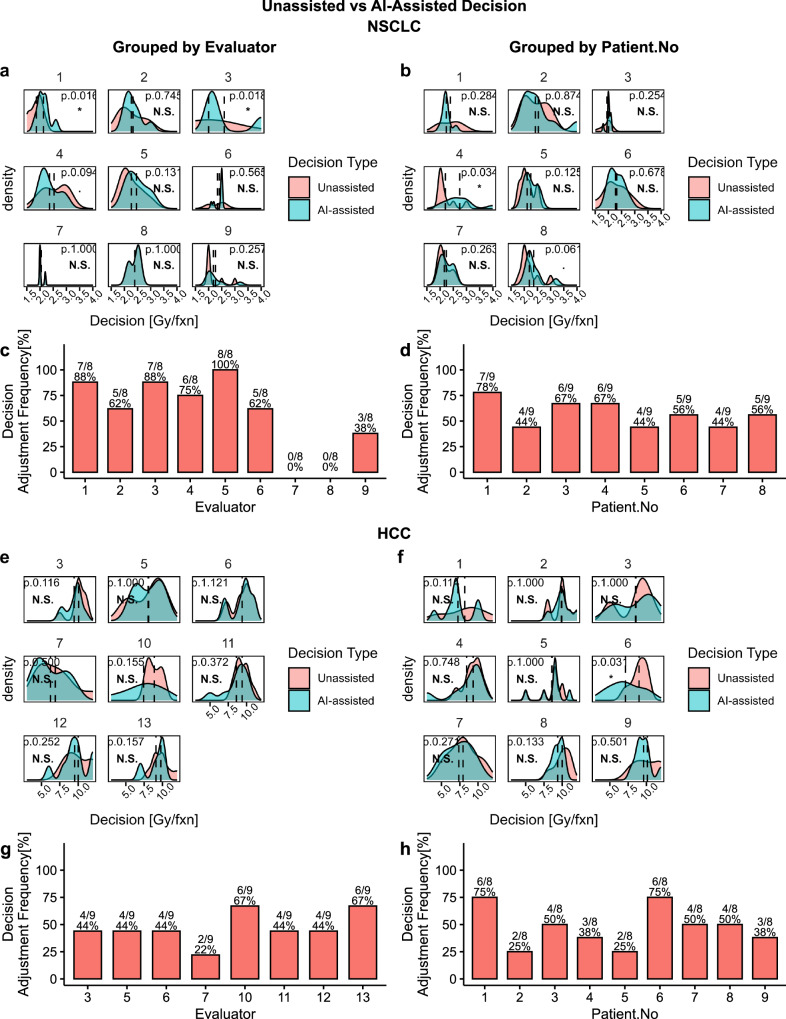
AI decision support systems can assist clinicians in planning adaptive treatment strategies that can dynamically react to individuals' cancer progression for effective personalized care. However, AI's imperfections can lead to suboptimal therapeutics if clinicians over or under rely on AI. To investigate such collaborative decision-making process, we conducted a Human-AI interaction study on response-adaptive radiotherapy for non-small cell lung cancer and hepatocellular carcinoma. We investigated two levels of collaborative behavior: model-agnostic and model-specific; and found that Human-AI interaction is multifactorial and depends on the complex interrelationship between prior knowledge and preferences, patient's state, disease site, treatment modality, model transparency, and AI's learned behavior and biases. In summary, some clinicians may disregard AI recommendations due to skepticism; others will critically analyze AI recommendations on a case-by-case basis; clinicians will adjust their decisions if they find AI recommendations beneficial to patients; and clinician will disregard AI recommendations if deemed harmful or suboptimal and seek alternatives.


Conflict of interest statement

Competing interests: DN, KCC, IDD, JBJ, JJ, YL, RKTH, AKB, MPD, JMF, CLL, SRM, MNM, RFP, SNR, and AR have no conflicting interests. BDG reports fees unrelated to this work from Sure Med Compliance and Elly Health. MMM reports research funding from Varian, a licensing agreement with Fuse Oncology, and serves in the AAPM Board of Directors and is the Co-Director of MROQC, funded by BCBSM. TJD is a member of the National Comprehensive Cancer Network (NCCN) NSCLC panel. JFTR reports stock ownership and leadership in Cvergenx, Inc. He reports IP and royalty rights in RSI, GARD, RxRSI. HHMY reports funding or fees unrelated to this work from the National Institute of Health, UpToDate, Novocure and Bristol-Myers Squib. IEN is on the scientific advisory of Endectra, LLC., co-founder of iRAI LLC, deputy editor for the journal of Medical Physics, co-chief editor of British Journal of Radiology (BJR)-AI and receives funding from the National Institute of Health (NIH), foundations, and Department of Defense (DoD). A PCT patent application for ARCliDS has been filed. Patent Title: Adaptive radiotherapy clinical decision support tool and related methods, Patent Applicant: H Lee Moffitt Cancer Center IP office in conjunction with University of Michigan IP office. Inventors: DN, IEN, RKTH, Wenbo Sun, JJ, IDD, KCC, MMM, and JBJ. Application Number: US2023/075004. Status of Application: Pending. Specific aspect of manuscript covered in patent application: The patent covers the underlying model-based decision-making framework of ARCliDS.

Figures

Fig. 1
Fig. 1. ARCliDS evaluation module workflow.
The modules were deployed on cloud in shinyapps.io server and used google sheets as data storage. Welcome Page contains links to tutorial video hosted in YouTube and manuscript preprint; from which a new evaluator can create a new account and returning user can login back to complete their evaluation. Create Account page consists of a series of input prompts including a unique username and 8-digit PIN so that they could log back in if disconnected unexpectedly or if needed to step away. Data Frame hosted as a google sheet automatically saves login info and evaluation input. Additionally, it saves randomized list of patients, and the last patient evaluated for each user account to check if evaluation is completed. Unassisted Phase page presents patient’s relevant info, treatment plans including 3D dose distribution and structure, cumulative DVH, pre and mid treatment 3D PET scans for NSCLC, pre and mid treatment liver functions along with pre-treatment 3D MRI scans for HCC; and contains input prompts for dose decision, decision confidence, and a textbox for remark. AI-Assisted Phase page presents AI-recommendation, outcome estimation for a range of dose show in TCP vs NTCP outcome space, and Distribution plots for all the feature variables; and contains input prompts for dose decision and decision confidence, a series of multiple-choice questions to access the user trust level, and a textbox for remark. Exit Page marks the end of the evaluation.
Fig. 2
Fig. 2. Unassisted vs AI-assisted decision analysis grouped by evaluators and patient number.
Plots ad summarizes data from NSCLC and plots eh from HCC. Density plots a, b, e, and f compare the unassisted (un) and AI-assisted (aia) distribution and includes the p-values from a matched pair randomization two-sided t-test with unaia0 as the alternative hypothesis and standard significance code: *** (p<0.001), ** (p<0.01), *(p<0.05),.(p<0.1), N.S (p0.1). Bar plots c, d, g, and h shows the frequency of decision adjustment (unaia) after AI-assistance in percentages.
Fig. 3
Fig. 3. Analysis of Decision adjustment with respect to AI recommendation.
The first, second, and third column of figures correspond to NSCLC, NSCLC excluding evaluators with zero decision adjustment, and HCC, respectively, and all the plots are colored by evaluators and marked coded patient number. All evaluators in HCC adjusted at least one of their decisions. Scatter plots a, b, and c shows relationship between the level of decision adjustment (aiaun) and dissimilarity with AI recommendation (aiun). Scatter plots df show relationship between AI Trust Level (0-5, 5 being the highest level) and agreement with AI-recommendation (aiaai|). The aiaai=0 line corresponds to absolute agreement with the AI-recommendation. All plots include the Spearman correlation coefficients, p-values (two-sided t test), and co-variance ellipse (95 % confidence). Covariance ellipses are included for a visual insight about the data distribution.
Fig. 4
Fig. 4. Analysis of evaluator’s decision confidence.
The first, second, and third column of figures correspond to NSCLC, NSCLC excluding Evaluators with zero decision adjustment, and HCC, respectively. All evaluators in HCC adjusted at least one of their decisions. 2D Scatter plots a, b, and c show the relationship between evaluators’ AI-assisted decision (aia) confidence (0-5, 5 being the highest level) and AITrustlevel(0-5, 5 being the highest level). 2D Scatter plots d, e, and f show the relationship between evaluators’ change in confidence level (aiaconfunconf) and AItrustlevel. 2D Scatter plots g, h and i show the relationship between evaluators’ change in confidence level and level of decision adjustment with AI-assistance. All plots include the Spearman correlation coefficients, p-values (two-sided t test), and co-variance ellipse (95 % confidence). Covariance ellipses are included for a visual insight about the data distribution.
Fig. 5
Fig. 5. Analysis of Evaluator’s decision confidence with respect to the Standard of Care Dose fractionation (2 Gy/fx for NSCLC RT; 10 Gy/fx for HCC SBRT).
The first, second, and third column of figures correspond to NSCLC, NSCLC excluding evaluators with zero decision adjustment, and HCC, respectively. All evaluators in HCC adjusted at least one of their decisions. 2D Scatter plots ac show the relationship between unassisted decision (un) confidence (0-5, 5 being the highest level) and closeness of un to the standard of care dose decision values (NSCLC:un2Gy/fx); HCC: un10Gy/fx). 2D Scatter plots d, e, and f show the relationship between AI-assisted decision (aia) confidence and closeness of un to the standard of care dose decision values (NSCLC:aia2 Gy/fx); HCC: aia10Gy/fx). All plots include the Spearman correlation coefficients, p-values (two-sided t test), and co-variance ellipse (95 % confidence). Covariance ellipses are included for a visual insight about the data distribution.
Fig. 6
Fig. 6. Reliability analysis via intraclass correlation coefficient (ICC).
Bar plots a and b compare McGraw and Wong’s ICC between unassisted decision and AI-assisted decision for NSCLC and HCC, respectively. ICC value along with 95% confidence interval, and p-value (one-sided F-test, Hα:icc>0) for NSCLC and HCC are presented in Table 1. We applied two-way random effects model to calculate four types of ICC for n×k data structure where n and k are the number of patients and evaluators, respectively, which were both chosen randomly from a larger pool of patients and evaluators (NSCLC: n=8, k=9; HCC: n=9, k=8). ICC type Consistency (C) measures the symmetric differences between the decisions of the k evaluators, whereas ICC type Absolute Agreement (A) measures the absolute differences. ICC unit Single rater corresponds to using the decision from a single evaluator as the basis for measurement and ICC unit Average corresponds to using the average decision from all evaluators.
Fig. 7
Fig. 7. AI utility analysis of decision adjustment with respect to RT outcome estimate for NSCLC.
Scatter plots a and b, grouped by patient number, show the RT outcome estimate (RTOE) in the space spanned by tumor control probability (TCP) and normal tissue complication probability (NTCP) for Unassisted (un) and AI-assisted (aia) decision, respectively. Scatter plots c and d show the change in RTOE for adjusted decisions in un vs aiaTCP space and un vs aiaNTCP space, respectively, including the 45 Null dashed line. Out of 41 decision adjustment, 32 (76%) increased both TCP and NTCP while 10 (24%) decreased TCP and NTCP. Paired plot e and violin plot f, present analysis of adjusted decision based on RTOE scoring schema TCP(1NTCP) [1 for (tcp,ntcp)=(1, 0), 0 for ntcp=1]. Paired plots e compares the change in score for un and aia for each patient. Violin plot f presents the overall summary statistics for the pairwise difference in score between aia and un: meansd=0.0011(0.0058);median(Q1Q3)=0.0011(0.00160.0022). Box plots include center line: median, box limits: upper and lower quartiles; whiskers: 1.5x interquartile range; and points: outliers.
Fig. 8
Fig. 8. AI utility analysis of decision adjustment with respect to RT outcome estimate for HCC.
Scatter plots a and b, grouped by patient number, show the RT Outcome Estimate (RTOE) in the space spanned by tumor control probability (TCP) and normal tissue complication probability (NTCP) for Unassisted (un) and AI-assisted (aia) decision, respectively. Scatter plots c and d show the change in RTOE for adjusted decisions in un vs aiaTCP space and un vs aiaNTCP space, respectively, including the 45 Null dashed line. Out of 34 decision adjustment, 9 (26%) increased both TCP and NTCP while 25 (74%) decreased TCP and NTCP. Paired plots e and violin plot f, present analysis of adjusted decision based on RTOE scoring schema TCP(1NTCP) [1 for (tcp,ntcp)=(1, 0), 0 for ntcp=1]. Paired plots e compares the change in score for un and aia for each patient. Violin plot f presents the overall summary statistics for the pairwise difference in score between aia and un: meansd=0.0059(0.0144); median(Q1Q3)=0.0034(7E40.0086). Box plots include center line: median, box limits: upper and lower quartiles; whiskers: 1.5× interquartile range; and points: outliers.

Update of

References

    1. Scott, E. C. et al. Trends in the approval of cancer therapies by the FDA in the twenty-first century. Nat. Rev. Drug Discov.22, 625–640 (2023). - PubMed
    1. Debela, D. T. et al. New approaches and procedures for cancer treatment: Current perspectives. SAGE Open Med.9, 205031212110343 (2021). - PMC - PubMed
    1. Nicora, G., Vitali, F., Dagliati, A., Geifman, N. & Bellazzi, R. Integrated multi-omics analyses in oncology: a review of machine learning methods and tools. Front. Oncol.10, 1030 (2020). - PMC - PubMed
    1. Wei, L. et al. Artificial intelligence (AI) and machine learning (ML) in precision oncology: a review on enhancing discoverability through multiomics integration. Br. J. Radiol. 96, 20230211 (2023). - PMC - PubMed
    1. Adaptive Treatment Strategies in Practice. (Society for Industrial and Applied Mathematics, Philadelphia, PA). 10.1137/1.9781611974188 (2015).

LinkOut - more resources