. 2025 Apr;5(4):558-575.
doi: 10.1038/s43587-024-00798-7. Epub 2025 Jan 29.

Niche-derived Semaphorin 4A safeguards functional identity of myeloid-biased hematopoietic stem cells

Affiliations

Niche-derived Semaphorin 4A safeguards functional identity of myeloid-biased hematopoietic stem cells

Dorsa Toghani et al. Nat Aging. 2025 Apr.

Erratum in

  • Author Correction: Niche-derived Semaphorin 4A safeguards functional identity of myeloid-biased hematopoietic stem cells.
    Toghani D, Gupte S, Zeng S, Mahammadov E, Crosse EI, Seyedhassantehrani N, Burns C, Gravano D, Radtke S, Kiem HP, Rodriguez S, Carlesso N, Pradeep A, Georgiades A, Lucas F, Wilson NK, Kinston SJ, Göttgens B, Zong L, Beerman I, Park B, Janssens DH, Jones D, Toghani A, Nerlov C, Pietras EM, Mesnieres M, Maes C, Kumanogoh A, Worzfeld T, Cheong JG, Josefowicz SZ, Kharchenko P, Scadden DT, Scialdone A, Spencer JA, Silberstein L. Toghani D, et al. Nat Aging. 2025 Apr;5(4):720. doi: 10.1038/s43587-025-00837-x. Nat Aging. 2025. PMID: 39979638 No abstract available.

Abstract

Somatic stem cell pools comprise diverse, highly specialized subsets whose individual contribution is critical for the overall regenerative function. In the bone marrow, myeloid-biased hematopoietic stem cells (myHSCs) are indispensable for replenishment of myeloid cells and platelets during inflammatory response but, at the same time, become irreversibly damaged during inflammation and aging. Here we identify an extrinsic factor, Semaphorin 4A (Sema4A), which non-cell-autonomously confers myHSC resilience to inflammatory stress. We show that, in the absence of Sema4A, myHSC inflammatory hyper-responsiveness in young mice drives excessive myHSC expansion, myeloid bias and profound loss of regenerative function with age. Mechanistically, Sema4A is mainly produced by neutrophils, signals via a cell surface receptor, Plexin D1, and safeguards the myHSC epigenetic state. Our study shows that, by selectively protecting a distinct stem cell subset, an extrinsic factor preserves functional diversity of somatic stem cell pool throughout organismal lifespan.


Conflict of interest statement

Competing interests: L.S., S. Radtke and H.P.-K. are listed inventors on patent application 18/717,971 relating to this work. All other authors declare no competing interests.

Figures

Extended Data Fig. 1
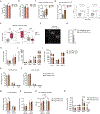
The absence of Sema4A leads to excessive myeloid expansion and premature hematopoietic aging-like phenotype.
Extended Data Fig. 2
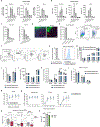
The absence of Sema4A leads to functional attrition of myHSC during aging.
Extended Data Fig. 3
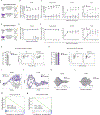
The absence of Sema4A in young animals leads to selective myHSC hyperactivation at the steady state.
Extended Data Fig. 4
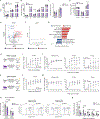
Sema4AKO myHSC are hypersensitive to acute innate immune activation.
Extended Data Fig. 5
PlxnD1fl/fl is a functional receptor for Sema4A on myHSC.
Extended Data Fig. 6
Neutrophils serve as a physiologically important source of Sema4A.
Fig 1.
Fig 1.. The absence of Sema4A leads to excessive myeloid expansion and premature hematopoietic aging-like phenotype
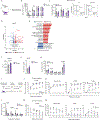
A-C. Platelet count (44 weeks, P = 0.04; 60 weeks, P = 1.8×10⁻⁵; 74 weeks, P = 0.002) (A), hematocrit level (60 weeks P = 0.03; 74 weeks, P = 0.002) (B), and neutrophil count (44 weeks, P = 0.02; 60 weeks, P = 0.02; 74 weeks, P = 0.02) (C) in the peripheral blood of aged WT/Sema4AKO mice (n=5 mice per group). D. Representative images of sub-epiphyseal area of H&E stained femurs from aged WT/Sema4AKO mice (n=4 mice per group). E. Myeloid to erythroid ratio in the bone marrow of aged WT/Sema4AKO mice (n=4 mice per group). F. Representative images of H&E staining of femurs from aged WT/Sema4AKO mice. Arrows with letters M and E indicate myeloid and erythroid cells respectively (n=4 mice per group). G-J. Absolute number of hematopoietic stem and progenitor subsets (G), megakaryocyte progenitors (MkP) (H), erythroid progenitors (colony-forming unit – erythroid, CFU-E) (I) and mature cells (J) in the bone marrow of aged WT/Sema4AKO mice (n=4 mice per group). K. Projection of previously published myeloid signature onto the RNA-Seq profiles of HSC from aged WT/Sema4A (n=4 animals per group). L, M. Absolute numbers of myHSC (L) and LyHSC (M) in the bone marrow of aged WT/Sema4AKO mice (n=5 mice per group). P values are shown. For the peripheral blood counts, *P<0.05, **P<0.01, ***P<0.001. Statistical significance was assessed by two-tailed t-test. Mean +/− (SEM) are shown.
Fig 2.
Fig 2.. The absence of Sema4A leads to functional attrition of myHSC during aging.
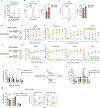
A-C. Experimental schema (A), overall percentage of donor-derived peripheral blood cells (4 weeks, P = 0.003; 8 weeks P = 0.01; 12 weeks, P = 0.01; 16 weeks, P = 0.01; 20 weeks, P = 0.01; 24 weeks P = 0.006) (B) and lineage contribution by donor-derived cells (Myeloid cells: 4 weeks, P = 0.006; 8 weeks, P = 0.003; 12 weeks, P = 8.9×10⁻⁵; 16 weeks, P = 8.8×10⁻⁷; 20 weeks, P = 1.1×10⁻⁷; 24 weeks, P = 1.0×10⁻⁷; B cells: 4 weeks, P = 0.02; 12 weeks, P = 0.03; 16 weeks, P = 0.02; 20 weeks, P = 0.01; 24 week,s P = 0.007) (C) after competitive transplantation of WT/Sema4AKO myHSC (CD45.2) into WT recipients (CD45.1) (n=5 animals per group). D-F. Experimental schema (D), overall percentage of donor-derived peripheral blood cells (E) and and lineage contribution by donor-derived cells (F) after competitive transplantation of WT/Sema4AKO lyHSC (CD45.2) into WT recipients (CD45.1) (n=5 animals per group). G-H. Overall percentage of donor-derived cells in the bone marrow after competitive transplantation of WT/Sema4AKO myHSC (CD45.2) (G) and WT/Sema4AKO lyHSC (CD45.2) (H) into WT recipients (CD45.1), quantification and representative plot for the overall bone marrow chimerism are shown (n=5 animals per group). I, J. UMAP representation of 162 myHSC (I) and 165 lyHSC (J) from aged WT and Sema4AKO mice (n=2 mice per genotype). K, L. Distribution of diffusion pseudotime values of myHSC (n=322 cells across 2 biological replicates and 4 technical replicates) (K) and lyHSC (n=320 cells across 2 biological replicates and 4 technical replicates) (L) from aged WT and Sema4AKO mice. In the inner box plots of the violinplots, the white point shows median value, box limits indicate upper and lower quartiles, whiskers extend to minimum and maximum values. M,N Enrichment of up- and down-regulated genes in the aged Sema4AKO myHSC signature for the upregulated (M) and downregulated (N) genes in the HSC “aging signature” as assessed by GSEA. P values are shown and were determined using determined using random permutation test. For the transplant experiments, *P<0.05, **P<0.05. Statistical significance was assessed by two-tailed t-test, except for the diffusion pseudotime analysis (P) where two-tailed Wilcoxon rank sum test was used. Mean +/− SEM are shown.
Fig 3.
Fig 3.. The absence of Sema4A in young animals leads to selective myHSC hyperactivation at the steady state.
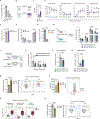
A. Baseline peripheral blood counts of WT and Sema4AKO mice (n=7 mice per group). B-D. Absolute number of primitive hematopoietic cells (B), myHSC and lyHSC (C) and mature myeloid cells (D) in WT/Sema4AKO mice (n=6 mice per group). E, F. Volcano plots showing DEGs in myHSC (E) and lyHSC (F) from WT and Sema4KO mice. The x and y axes indicate the expression fold change (FC) (log2) and the false discovery rate (FDR) (−log10) for each gene versus controls, respectively. Legends highlight upregulated (red) or downregulated (blue) transcripts, as well as genes not passing cutoff criteria for FC (black) and FDR (gray). Selected representative genes are shown (n=4 biological replicates per genotype). G. Gene set enrichment analysis (GSEA) showing top overrepresented canonical pathways which are upregulated (red) or downregulated (blue) in Sema4AKO myHSC as compared to WT myHSC. The pathways with FDR <0.05 are shown (n=4 biological replicates per genotype). H-J. Experimental schema (H), overall percentage of donor-derived peripheral blood cells (8 weeks, P = 0.047; 12 weeks, P = 0.02; 16 weeks, P = 0.009; 20 weeks, P = 0.007; 24 weeks, P = 0.003) (I) and lineage contribution by donor-derived cells (B cells: 8 weeks P = 0.02; 12 weeks, P = 0.01; 16 weeks, P = 0.007; 20 weeks, P = 0.005; 24 weeks, P = 0.003; T cells: 12 weeks, P = 0.03; 16 weeks, P = 0.03; 20 weeks P = 0.03; 24 weeks, P = 0.02) (J) in WT mice (CD45.1) which were competitively transplanted with WT/Sema4AKO myHSC. (CD45.2) (n=5 mice per group). K-M. Experimental schema (K), overall percentage of donor-derived peripheral blood cells (8 weeks, P = 0.049; 12 weeks, P = 0.03; 16 weeks, P = 0.046) (L) and lineage contribution by donor-derived cells (Myeloid cells: 8 weeks, P = 0.008; B cells: 12 weeks, P = 0.02; 16 weeks, P = 0.02) (M) in WT mice (CD45.1) which were competitively transplanted with WT/Sema4AKO lyHSC (CD45.2). (n=4 mice per group). N. Frequency of LT-HSC (as percentage of Lin-Kit+Sca1+ cells) in the bone marrow of WT mice (CD45.1) after competitive transplantation of WT/Sema4AKO myHSC (myHSC recipients, CD45.2) and WT/Sema4AKO lyHSC (lyHSC recipients, CD45.2), quantification and representative plots are shown (n=5 for myHSC recipient groups and n=4 for lyHSC recipient groups). O. Myeloid/lymphoid ratio of peripheral blood donor-derived cells in WT mice which were competitively transplanted with WT/Sema4AKO myHSC (n=5 mice per group). P values are shown. For the transplant experiments, *P<0.05, **P<0.05. Statistical significance was assessed by two-tailed t-test, mean +/− SEM are shown.
Fig 4.
Fig 4.. Sema4AKO myHSC are hypersensitive to acute innate immune activation.
A-C. Experimental schema (A), absolute number of myHSC and progenitor subsets (B) and myHSC cell cycle analysis (C) in WT/Sema4AKO mice 72 hours post-LPS injection (n=4 mice per group). D. Volcano plot representation of the RNA-Seq data from WT/Sema4AKO myHSC 72 hours post-LPS injection (n=4 mice per group). E. Gene set enrichment analysis of myHSC from WT/Sema4AKO mice on day 3 post-LPS injection (n=4 mice per group). F-H. Peripheral blood platelet count (F), absolute number of myHSC (G) and primitive hematopoietic cells in WT/Sema4AKO mice (H) 30 days after treatment with low-dose LPS (n=5 mice per group). I-K. Experimental schema (I), overall percentage of donor-derived peripheral blood cells (4 weeks, P = 0.02; 8 weeks, P = 5.8×10⁻⁵; 12 weeks, P = 6.5×10⁻⁵; 16 weeks, P = 4.8×10⁻⁵; 24 weeks, P = 0.004) (J) and lineage contribution by donor-derived cells (B cells: 8 weeks, P = 0.0002; 12 weeks, P = 0.0001; 16 weeks, P = 0.0001; 24 weeks, P = 0.003; T cells: 8 weeks, P = 0.02; 12 weeks, P = 0.001; 16 weeks, P = 0.001; 24 weeks, P = 0.01;) (K) in primary recipient WT mice (CD45.1) which were competitively transplanted with myHSC from low-dose LPS-treated WT/Sema4A (CD45.2) mice (n=5 mice per group). L. Myeloid/lymphoid ratio of donor derived cells in WT mice (CD45.1) which were competitively transplanted with myHSC from low-dose LPS-treated WT/Sema4A (CD45.2) mice (n=5 mice per group). M,N. Overall percentage of donor-derived peripheral blood cells (8 weeks, P = 0.0008; 12 weeks, P = 0.0006; 16 weeks, P = 0.03) (M) and lineage contribution by donor-derived cells (Myeloid cells: 4 weeks, P = 0.045; 8 weeks, P = 0.002; 12 weeks, P = 0.03; B cells: 12 weeks, P = 0.002; 16 weeks, P = 0.0003; 20 weeks, P = 0.003) (N) in secondary recipient WT mice (CD45.1) which were competitively transplanted with myHSC from primary recipient mice (CD45.2) as shown in (I) (n=5 mice per group). P values are shown. For the transplant experiments, *P<0.05, **P<0.05. Statistical significance was assessed by two-tailed t-test. Mean +/− SEM are shown.
Fig 5.
Fig 5.. PlxnD1 is a functional receptor for Sema4A on myHSC.
A. Expression of mRNA encoding for known Sema4A receptors in HSC (n=3 mice) (taken from Cabezas-Wallscheid, Cell, 2017). B, C. Expression of PlxnD1-GFP reporter (B) and Nrp1 protein (C) in myHSC and lyHSC in WT mice, as assessed by flow cytometry (n=3 biological replicates). D-F. Experimental schema (D), overall percentage of donor-derived peripheral blood cells (4 weeks, P = 0.03; 8 weeks, P = 0.02; 12 weeks, P = 0.05; 16 weeks, P = 0.05) (E) and lineage contribution by donor-derived cells (Myeloid cells: 4 weeks, P = 0.02; B cells: 8 weeks, P = 0.04; T cells: 8 weeks, P = 0.03) (F) in WT mice (CD45.1) transplanted with myHSC from untreated PlxnD1fl/fl Mx1Cre(+) and PlxnD1fl/fl Cre(−) mice (CD45.2) (n=5 mice per group). G-I. Experimental schema (G), overall percentage of donor-derived peripheral blood cells (H) and lineage contribution by donor-derived cells (I) in WT mice (CD45.1) transplanted with lyHSC from untreated PlxnD1fl/fl Mx1Cre(+) and PlxnD1fl/fl Cre(−) mice (CD45.2) (n=5 mice per group). (J) Myeloid/lymphoid ratio of donor-derived cells in WT mice (CD45.1) transplanted with myHSC from PlxnD1fl/fl Mx1Cre(+) and PlxnD1fl/fl Cre(−) mice (CD45.2) (n=5 mice per group). Overall statistical significance assessed by two-tailed ANOVA. K-M. Experimental schema (K), absolute number of myHSC and progenitor subsets (L) and myHSC cell cycle analysis (M) in PlxnD1fl/fl Mx1Cre(+) and PlxnD1fl/fl Cre(−) mice 72 hours post-LPS injection (n=4 mice per group). P values are shown. For the transplant experiments, *P<0.05, **P<0.05. Statistical significance was assessed by two-tailed t-test unless otherwise stated. Mean +/− SEM are shown.
Fig 6.
Fig 6.. Neutrophils serve as a physiologically important source of Sema4A.
A. Relative contribution of distinct cellular subsets to Sema4A production in the bone marrow at the steady state (n=4 mice per group). B-C. Experimental schema for non-competitive transplantation of WT myHSC into lethally irradiated WT/Sema4AKO recipients (B), the number of transplanted myHSC progeny in calvarial bone marrow, as assessed by intra-vital microscopy at the 24-hour time point (C) (n= 4 mice per group). D-F. Longitudinal blood counts (Hematocrit: 4 weeks P = 0.004; 8 weeks, P = 0.005; 12 weeks P = 0.02; 20 weeks P = 0.04; Neutrophils: 4 weeks P = 0.001; 12 weeks P = 0.01; 24 weeks P = 0.002) (D), donor-derived LT-HSC frequency (E) and mature cell frequency (F) in the bone marrow of a separate WT/Sema4AKO cohort which was non-competitively transplanted with WT myHSC (n= 5 mice for WT group and n=3 mice for Sema4AKO grouo) (G). Sema4A expression in Ly6Ghigh vs Ly6Glow neutrophils (n=5 mice per group). H,I. Experimental schema (H) and absolute number of myHSC and primitive hematopoietic cells (I) in Sema4Afl/fl Mrp8-Cre(+) and Sema4Afl/fl Mrp8-Cre(−) 72 hours after LPS injection (n=5 mice per group). J-M. Experimental schema (J), myeloid/lymphoid ratio of peripheral blood donor-derived cells (K), donor-derived LT-HSC frequency (L) and donor-derived MPP4 frequency (M) in WT mice (CD45.1) which were competitively transplanted with myHSC from low-dose LPS-treated Sema4Afl/fl Mrp8-Cre(+) and Sema4Afl/fl Mrp8-Cre(−) (CD45.2) mice (n=5 mice per group). N, O. Sema4A expression in bone marrow WT Ly6Ghigh neutrophils 24 hours post-LPS injection, as quantified by frequency of Sema4A+ cells (N) and Sema4A mean fluorescence intensity (MFI) of Sema4A+ Ly6Ghigh neutrophils (n=4 mice per group) Bar graph and representative flow cytometry plots are shown. (O) P. Frequency of Sema4A+ cells in peripheral blood neutrophil subsets from patients with sepsis and healthy volunteers (HV), as assessed by single cell RNA-Seq in Kwok et al. Displayed is a cumulative analysis of “non-zero” PlxnD1 expression values in single HSPC obtained from 26 patients with sepsis and 6 healthy volunteers. The plots show the median (middle line), interquartile range (box) and minimum to maximum values (whiskers) throughout. Q. Frequency of Sema4A+ Ly6Ghigh neutrophils in the bone marrow of young and aged WT mice (n=5 mice for young WT group and n=4 mice for aged WT group). P values are shown. For the transplant experiments, *P<0.05, **P<0.05. Statistical significance was assessed by two-tailed t-test. Mean +/− SEM are shown.
Fig 7.
Fig 7.. Sema4A maintains the epigenetic identity of myHSC.
A. PCA analysis of ATAC-Seq signatures of myHSC from aged WT/Sema4AKO mice. B. Volcano plot of open chromatin regions that show increased accessibility (n=242) and decreased accessibility (n=144) in aged Sema4AKO myHSC. p-value<0.01 (y-axis), by two-sided wald test C. Gene Set Enrichment Analysis GSEA) of the lyHSC differentially accessible gene signature over the lyHSC gene signature from Meng et al (MUL vs PLT; left panel) and the Sema4A myHSC accessibility genes (right panel). Note that in the Meng et al dataset, MUL and PLT denotes lyHSC and myHSC comparable HSC subsets, respectively. p-value<0.01, by one-sided weighted Kolmogorov–Smirnov test D. Enriched denovo motifs predicted from myHSC/Sema4AKO enriched open chromatin. p-value<1e-6, by two-sided t-test E. Gene expression level of Runx3 in aged WT/Sema4AKO myHSC (from RNA-seq data) (n=322 cells across 2 biological replicates and 4 technical replicates). In the inner box plots of the violinplots, the white point shows median value, box limits indicate upper and lower quartiles, whiskers extend to minimum and maximum values. Statistical significance was assessed by two-tailed Wilcoxon rank sum test.

References

    1. Scaramozza A et al. Lineage Tracing Reveals a Subset of Reserve Muscle Stem Cells Capable of Clonal Expansion under Stress. Cell Stem Cell 24, 944–957 e945 (2019). 10.1016/j.stem.2019.03.020 - DOI - PMC - PubMed
    1. Ibrayeva A et al. Early stem cell aging in the mature brain. Cell Stem Cell 28, 955–966 e957 (2021). 10.1016/j.stem.2021.03.018 - DOI - PMC - PubMed
    1. Altshuler A et al. Discrete limbal epithelial stem cell populations mediate corneal homeostasis and wound healing. Cell Stem Cell 28, 1248–1261 e1248 (2021). 10.1016/j.stem.2021.04.003 - DOI - PMC - PubMed
    1. Farrelly O et al. Two-photon live imaging of single corneal stem cells reveals compartmentalized organization of the limbal niche. Cell Stem Cell 28, 1233–1247 e1234 (2021). 10.1016/j.stem.2021.02.022 - DOI - PMC - PubMed
    1. Hsu YC, Pasolli HA & Fuchs E Dynamics between stem cells, niche, and progeny in the hair follicle. Cell 144, 92–105 (2011). 10.1016/j.cell.2010.11.049 - DOI - PMC - PubMed

LinkOut - more resources