. 2025 Mar;44(6):1641-1662.
doi: 10.1038/s44318-025-00369-5. Epub 2025 Jan 29.

SLC25A1 and ACLY maintain cytosolic acetyl-CoA and regulate ferroptosis susceptibility via FSP1 acetylation

Affiliations

SLC25A1 and ACLY maintain cytosolic acetyl-CoA and regulate ferroptosis susceptibility via FSP1 acetylation

Wei Li et al. EMBO J. 2025 Mar.

Abstract

Ferroptosis, an iron-dependent form of programmed cell death characterized by excessive lipid hydroperoxides accumulation, emerges as a promising target in cancer therapy. Among the solute carrier (SLC) superfamily, the cystine/glutamate transporter system antiporter components SLC3A2 and SLC7A11 are known to regulate ferroptosis by facilitating cystine import for ferroptosis inhibition. However, the contribution of additional SLC superfamily members to ferroptosis remains poorly understood. Here, we use a targeted CRISPR-Cas9 screen of the SLC superfamily to identify SLC25A1 as a critical ferroptosis regulator in human cancer cells. SLC25A1 drives citrate export from the mitochondria to the cytosol, where it fuels acetyl-CoA synthesis by ATP citrate lyase (ACLY). This acetyl-CoA supply sustains FSP1 acetylation and prevents its degradation by the proteasome via K29-linked ubiquitin chains. K168 is the primary site of FSP1 acetylation and deacetylation by KAT2B and HDAC3, respectively. Pharmacological inhibition of SLC25A1 and ACLY significantly enhances cancer cell susceptibility to ferroptosis both in vitro and in vivo. Targeting the SLC25A1-ACLY axis is therefore a potential therapeutic strategy for ferroptosis-targeted cancer intervention.

Keywords: ACLY; Acetylation; FSP1; Ferroptosis; SLC25A1.


Conflict of interest statement

Disclosure and competing interests statement. The authors declare no competing interests.

Figures
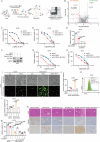
Figure 1
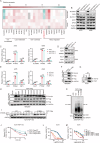
Figure 1. Identification of SLC25A1 as a critical regulator of ferroptosis sensitivity.
(A) Schematic diagram of SLC family-targeted CRISPR-Cas9 screening in A375 cells. (B) Representation of gene scores from CRISPR-Cas9 screening, categorized as anti-ferroptosis and pro-ferroptosis. SLC25A1 is marked in bold. (CE) Measurement of cell viability in shControl (shCtrl) versus shSLC25A1-A375 cells following treatment with increasing doses of RSL3 (C) or erastin (D) over 48 h, or culture in cysteine-depleted medium for 24 h (E). n = 3 for (C, D), and n = 6 for (E), n represents biological independent experiments. (E) Statistical analysis by were calculated using one-way ANOVA tests; mean + SD, p values from left to right: ****p = 1.46E−10, ****p = 4.55E−10, ****p = 5.56E−11. (F) Immunoblot of SLC25A1 protein levels in indicated cell groups. SLC25A1-knockdown A375 cells were reintroduced with a shRNA-resistant SLC25A1 construct (shSLC25A1 + SLC25A1-A375). (G, H) Evaluation of cell viability in shCtrl, shSLC25A1, and shSLC25A1 + SLC25A1-A375 cells after 48 h of treatment with increasing concentrations of RSL3 (G) or erastin (H). n = 3 for (G, H), n represents biological independent experiments. (I, J) Detection of cell death using SYTOX Green in shCtrl and shSLC25A1-A375 cells treated as indicated for 48 h. RSL3 at 0.5 μM, Fer-1 at 1 μM. Upper panel: phase-contrast images, lower panel: SYTOX Green staining for dead cells. Scale bars: left, 100 μm. (I) Quantitative analysis of cell death percentage is presented. n = 3, n represents biological independent experiments. Statistical analysis by two-way ANOVA tests; mean + SD, p values from left to right: ***p = 0.0002, ****p = 1.97E−05, ****p = 2.17E−05 (J). (K, L) Detection of lipid peroxidation through flow cytometer in shCtrl and shSLC25A1-A375 cells under indicated treatments for 6 h. RSL3 at 0.5 μM, Fer-1 at 1 μM (K). Quantification of lipid peroxidation percentage is presented. n = 3, n represents biological independent experiments. Statistical analysis by two-way ANOVA tests; mean + SD, p values from left to right: ***p = 0.0001, ***p = 0.001, ****p = 1.59E−06, ****p = 2.26E−06 (L). (M) Measurement of cell viability in shCtrl and shSLC25A1-A375 cells subjected to indicated treatments for 48 h. Treatments include RSL3 at 0.5 μM, Fer-1 at 1 μM, Z-VAD-FMK (Z-V) at 10 μM, Necrostatin-1 (Nec-1) at 1 μM, and Bafilomycin A1 (Baf-A1) at 50 nM. n = 6, n represents biological independent experiments. Statistical analysis by two-way ANOVA tests; mean + SD, p values from left to right: ***p = 0.0001, ***p = 0.0002, ****p = 1.40E−09, ****p = 7.84E−08, ns: not significant. (N) Liver-specific Slc25a1 knockdown (Slc25a1-KD) mice were generated by tail vein injection of AAV8 virus three weeks later. Lip-1 (10 mg/kg) was injected half an hour before ischemia reperfusion (IRI) or sham-treatment. Visual inspection showing liver damage and representative images showing H&E staining, MDA and Fsp1 immunohistochemical staining of livers from mice under the indicated treatment conditions. Scale bars: right, 200 nm. The experiment was repeated at least three times. Source data are available online for this figure.
Figure 2
Figure 2. Breakdown of citrate to acetyl-CoA by SLC25A1 and ACLY inhibits ferroptosis.
(A) Measurement of citrate levels in the total cell, cytosol and nucleus, and mitochondria. n = 3, n represents biological independent experiments. Statistical analysis by two-way ANOVA tests; mean + SD, p values from left to right: ns: not significant, **p = 0.0092, **p = 0.0015, **p = 0.0012, **p = 0.0020 (A375 cells); ns: not significant; **p = 0.0045, **p = 0.0058, **p = 0.0066, **p = 0.0079 (A549 cells). (B) Measurement of cellular acetyl-CoA concentrations. n = 3, n represents biological independent experiments. Statistical analysis by two-tailed, unpaired Student’s t-test; mean + SD, p values from left to right: ****p = 4.67E−05, ****p = 1.00E−05, ****p = 9.72E−06, ****p = 5.77E−05. (C) Immunoblot confirming the knockdown of ACLY in shACLY-A375/A549 cells. (D, E) Measurement of cell viability in shCtrl and shACLY-A375/A549 cells following treatment with incremental doses of RSL3 (D) or erastin (E) over 48 h. n = 3 for (D, E), n represents biological independent experiments. (F) Comparison of cell viability between shCtrl and shACLY-A375/A549 cells exposed to indicated treatments for 48 h. RSL3 at 0.5 μM, Fer-1 at 1 μM. n = 3, n represents biological independent experiments. Statistical analysis by two-way ANOVA tests; mean + SD, p values from left to right: ****p = 1.16E−07, ****p = 2.21E−05, ****p = 5.25E−11, ****p = 4.37E−12 (A375 cells); ****p = 3.75E−07, ****p = 4.97E−12, ****p = 4.40E−11 (A549 cells). (G) Immunoblot of ACLY and SLC25A1 protein levels in the indicated cells. Following ACLY knockdown, A375 and A549 cells were subjected to SLC25A1 knockdown (shACLY + shSLC25A1-A375/A549). (H, I) Cell viability assays for shCtrl, shACLY, and shACLY + shSLC25A1-A375/A549 cells treated with increasing RSL3 (H) or erastin (I) concentrations for 48 h. n = 3 for (H, I), n represents biological independent experiments. Source data are available online for this figure.
Figure 3
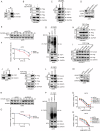
Figure 3. FSP1 is acetylated at lysine 168, leading to increased protein stability.
(A) Heat map representing expression of proteins involved in ferroptosis in shCtrl and shSLC25A1-A375 cells from proteomics. (B) Immunoblot of the protein levels of SLC25A1, FSP1, SLC7A11, GCH1, GPX4, and ACSL4 in shCtrl versus shSLC25A1-silenced A375/A549 cells. (C) Quantitative RT-PCR (qRT-PCR) analysis of mRNA expressions of SLC25A1, PTGS2, and FSP1 in shCtrl and shSLC25A1-A375/A549 cells. n = 3, n represents biological independent experiments. Statistical analysis by two-way ANOVA tests; mean + SD, p values from left to right: ****p = 2.53E−07, ****p = 2.27E−07, ****p = 1.99E−08, ****p = 8.65E−08, ns: not significant (A375 cells); ****p = 3.01E−05, ****p = 2.70E−05, ****p = 3.38E−08, ****p = 3.42E−07, ns: not significant (A549 cells). (D) Immunoblot of ACLY and FSP1 protein levels in shCtrl and shACLY-silenced A375/A549 cells. (E) qRT-PCR analysis of mRNA expressions of ACLY, PTGS2, and FSP1 in shCtrl and shACLY-A375/A549 cells. n = 3, n represents biological independent experiments. Statistical analysis by two-way ANOVA tests; mean + SD, p values from left to right: ***p = 0.00032, ***p = 0.00023, ***p = 0.00034, ****p = 1.08E−06, ns: not significant (A375 cells); ****p = 8.75E−06, ****p = 2.22E−06, ****p = 1.97E−05, ****p = 7.32E−06, ns: not significant (A549 cells). (F) Immunoblot of acetylated FSP1-Flag in HEK293T cells, with empty vector as a negative control. (G) Immunoblot of acetylation of endogenous FSP1 in A375 cells. IgG was employed as a negative control. (H) Immunoblot of acetylation profiles of various FSP1-Flag mutants in HEK293T cells. (I, J) Immunoblot of FSP1 protein stability in A375-FSP1-KO cells re-expressing Flag-tagged FSP1 WT, K168R, or K168Q mutants, following cycloheximide (CHX, 60 μg/mL) treatment over specified durations (I). Quantification of FSP1 protein levels. n = 3, n represents biological independent experiments. Statistical analysis by two-tailed, unpaired Student’s t-test; mean + SD, p values from left to right: **p = 0.0094, ***p = 0.00023 (J). (K) Immunoblot of FSP1 ubiquitination in A375-FSP1-KO cells stably expressing Flag-tagged FSP1 WT, K168R, or K168Q mutants, following 10 μM MG132 treatment for 12 h. IgG served as a negative control. (L, M) Measurement of cell viability in control sgRNA (V2), FSP1-knockout (sgFSP1), and FSP1-knockout A375 cells re-expressing FSP1 WT/K168R/K168Q exposed to increasing concentrations of RSL3 (L) or erastin (M) for 48 h. n = 3 for (L, M), n represents biological independent experiments. Source data are available online for this figure.
Figure 4
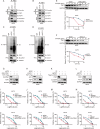
Figure 4. FSP1 acetylation and deacetylation is predominantly mediated by KAT2B/HDAC3.
(A) Immunoblot detecting endogenous interaction between FSP1 and KAT2B in A375 cells, with IgG as a negative control for IP. (B) Immunoblot of exogenous interaction between FSP1-Flag and Myc-tagged KAT2B in HEK293T cells, with Flag empty vector as a negative control. (C) Immunoblot of FSP1 acetylation following KAT2B knockdown in A375 cells with IgG as a negative control. (D) Immunoblot of FSP1 protein levels in shCtrl versus shKAT2B-A375 cells. (E, F) Time-dependent FSP1 protein stability assessed via immunoblot in shCtrl and shKAT2B-A375 cells treated with CHX (60 μg/ml) for indicated durations and quantification of FSP1 protein levels (E). Quantification of FSP1 protein levels. n = 3, n represents biological independent experiments. Statistical analysis by two-tailed, unpaired Student’s t-test; mean + SD, **p = 0.0016 (F). (G) Immunoblot of FSP1 ubiquitination in shCtrl and shKAT2B-A375 cells following treatment with MG132 (10 μM) for 12 h, with IgG as a negative control. (H) Immunoblot of acetylation of exogenous FSP1 upon treatment with HDAC inhibitors: trichostatin A (TSA, 1 μM, 12 h) or nicotinamide (NAM, 10 mM, 6 h) in HEK293T cells transfected with FSP1-Flag, with Flag empty vector as a negative control. (I) Immunoblot of the acetylation of exogenous FSP1 in HEK293T cells with indicated treatment: ACY957 (10 μM, 6 h), RGFP966 (1 μM, 24 h), LMK-235 (1 μM, 24 h), and Ricolinostat (40 μM, 24 h), with Flag empty vector as a negative control. (J) Immunoblot of endogenous interaction between FSP1 and HDAC3 in A375 cells, with IgG as a negative control. (K) Immunoblot of exogenous interaction between FSP1-Flag and V5-tagged HDAC3 in HEK293T cells, with Flag empty vector as a negative control. (L) Immunoblot of FSP1 acetylation following HDAC3 knockdown in A375 cells with IgG as a negative control. (M) Immunoblot of FSP1 protein levels in shCtrl versus shHDAC3-A375 cells. (N, O) Immunoblot of FSP1 protein stability in shCtrl and shHDAC3-A375 cells treated with CHX (60 μg/ml) for indicated times and quantification of FSP1 protein levels (N). n = 3, n represents biological independent experiments. Statistical analysis by two-tailed, unpaired Student’s t-test; mean + SD, ****p = 8.39E−05 (O). (P) Immunoblot of FSP1 ubiquitination in shCtrl and shHDAC3-A375 cells after MG132 treatment (10 μM, 12 h), with IgG as a negative control. (Q, R) Cell viability assays in shCtrl, shKAT2B, and shHDAC3-A375 cells treated with increasing concentrations of RSL3 (O) or erastin (P) for 48 h. n = 3 for (OR), n represents biological independent experiments. Source data are available online for this figure.
Figure 5
Figure 5. SLC25A1 and ACLY regulate FSP1 acetylation and stability.
(A, B) Immunoblot of FSP1 acetylation levels in A375 cells stably transfected with lentiviral shRNA targeting SLC25A1 (A), ACLY (B), or a control shRNA. IgG served as a negative control. (C, D) Immunoblotting of ubiquitination of FSP1 in A375 cells stably expressing shRNA against SLC25A1 (C), ACLY (D), or control shRNA, following 10 μM MG132 treatment for 12 h. IgG served as a negative control. (E, F) Immunoblots of FSP1 protein levels in A375 cells with stable shRNA-mediated knockdown of SLC25A1 (E), ACLY (F), or control shRNA, treated with CHX (60 μg/ml) for the indicated durations and quantification of FSP1 protein levels. n = 3 for (E, F), n represents biological independent experiments. Statistical analysis by two-tailed, unpaired Student’s t-test; mean + SD, ****p = 1.10E−05 (E), ***p = 0.00021 (F). (G, H) Immunoblots of SLC25A1, ACLY, and FSP1 in A375 cells following knockdown of SLC25A1 (G) or ACLY (H) and overexpression of FSP1. (I, J) Cell viability assays of A375 cells expressing control shRNA (shCtrl), shRNA against SLC25A1 (shSLC25A1), shSLC25A1 with FSP1 overexpression (shSLC25A1 + FSP1), shRNA against ACLY (shACLY), and shACLY with FSP1 overexpression (shACLY + FSP1) treated with increasing concentrations of RSL3 (I) or erastin (J) for 48 h. n = 3 for (I, J), n represents biological independent experiments. (K, L) Immunoblot of FSP1, SLC25A1, and ACLY levels in FSP1-knockout A375 cells overexpressing SLC25A1 (K) or ACLY (L). (M, N) Cell viability assays of A375 cells transfected with V2, sgRNA targeting FSP1 (sgFSP1), sgFSP1 with SLC25A1 overexpression (sgFSP1 + SLC25A1), and sgFSP1 with ACLY overexpression (sgFSP1 + ACLY) exposed to increasing concentrations of RSL3 (M) or erastin (N) for 48 h. n = 3 for (M, N), n represents biological independent experiments. Source data are available online for this figure.
Figure 6
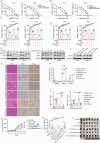
Figure 6. Targeting SLC25A1 and ACLY increases ferroptosis sensitivity in vivo.
(A, B) Cell viability assays of A375 and A549 cells treated with increasing concentrations of RSL3 (A) or erastin (B), with and without the addition of BTA (5 mM) or SB204990 (20 μM). n = 3 for (A, B), n represents biological independent experiments. (C, D) Cell viability assays of A375 and A549 cells subjected to indicated treatments for 48 h: RSL3 (0.5 μM), erastin (1 μM), BTA (5 mM), SB204990 (20 μM), and Ferrostatin-1 (Fer-1, 1 μM). n = 3 for (C, D), n represents biological independent experiments. Statistical analysis by two-way ANOVA tests; mean + SD, p values from left to right: ****p = 3.70E−12, ****p = 1.57E−11, ****p = 1.25E−10, ****p = 2.30E−07, ****p = 7.20E−09 (C: A375 cells); ****p = 1.60E−08, ****p = 3.67E−08, ****p = 8.46E−11, ****p = 2.92E−09, ****p = 2.80E−11 (C: A549 cells); ****p = 3.06E−06, ****p = 3.49E−08, ****p = 3.64E−08, ****p = 1.64E−09, ****p = 7.60E−11 (D: A375 cells); ****p = 3.19E−07, ****p = 2.33E−07, ****p = 3.94E−08, ****p = 1.51E−07, ****p = 2.25E−07 (D: A549 cells). (E) Immunoblot of FSP1 protein levels in A375 and A549 cells treated with BTA or SB204990. (F) Immunoblot of FSP1 protein levels in A375 and A549 cells treated with dimethyl citrate or sodium acetate. (G) Mice were injected with vehicle, BTA (50 mg/kg) for three consecutive days. Lip-1 (10 mg/kg) was injected half an hour before ischemia reperfusion (IRI) or sham-treatment. Representative images showing H&E staining, MDA and Fsp1 immunohistochemical staining of livers from mice under the indicated treatment conditions. Scale bars: right, 200 nm. The experiment was repeated three times. (H) qRT-PCR analysis of mRNA expressions of Slc25a1, Ptgs2, and Chac1 from mice liver under the indicated treatment conditions. Treatments include Vehicle + Sham, Vehicle + IRI, Vehicle + IRI + Lip-1, BTA + Sham, BTA + IRI and BTA + IRI + Lip-1. n = 5, 6, 7, 6, 7, 7 (Slc25a1); 5, 5, 6, 5, 7, 6 (Ptgs2); 5, 5, 7, 6, 5, 5 (Chac1), n represents biological independent experiments. Statistical analysis by two-way ANOVA tests; mean + SD, p values from left to right: ***p = 0.00052, ***p = 0.00094, ****p = 2.69E−05, ****p = 1.08E−05 (Ptgs2); *p = 0.011, **p = 0.0014, *p = 0.016, **p = 0.006 (Chac1). (I) Measurement of ALT and AST levels in the serum from mice under the indicated treatment conditions. Treatments include Vehicle + Sham, Vehicle + IRI, Vehicle + IRI + Lip-1, BTA + Sham, BTA + IRI and BTA + IRI + Lip-1. n = 5, 5, 5, 6, 5, 6 (ALT); 6, 6, 6, 6, 6, 6 (AST), n represents biological independent experiments. Statistical analysis by two-way ANOVA tests; mean + SD, p values from left to right: ****p = 1.09E−05, ***p = 0.0022, ****p = 3.19E−05, ****p = 6.36E−08 (ALT), **p = 0.0065, ns: not significant, **p = 0.0052, *p = 0.00094 (AST). (J) Evaluation of tumor growth in xenograft mouse models using A375 cells. Upon reaching approximately 100 mm3, tumors were subjected to random division into six groups (n = 7 per group) and treated intraperitoneally (i.p.) every two days over 13 days with the following: (1) Vehicle, (2) IKE (50 mg/kg), (3) BTA (50 mg/kg) + IKE (50 mg/kg), (4) BTA (50 mg/kg) + IKE (50 mg/kg) + Lip-1 (10 mg/kg), (5) SB204990 (50 mg/kg) + IKE (50 mg/kg), (6) SB204990 (50 mg/kg) + IKE (50 mg/kg) + Lip-1 (10 mg/kg). n = 7, n represents biological independent experiments. Statistical analysis by two-tailed, unpaired Student’s t-test; mean + SD, p values from left to right: **p = 0.00098, *p = 0.048, *p = 0.039, *p = 0.042, *p = 0.0171. (K) Tumor weights were measured at the end of the study on day 25. n = 7, n represents biological independent experiments. Statistical analysis by two-tailed, unpaired Student’s t-test; mean + SD, p values from left to right: *p = 0.0183, *p = 0.028, **p = 0.001, *p = 0.033, **p = 0.005. (L) Representative images of tumors from each treatment group taken 25 days after inoculation. Source data are available online for this figure.
Figure 7
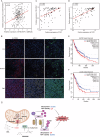
Figure 7. The high expression SLC25A1-ACLY axis predicts the poor prognosis of cancer patients.
(A) Relationship analysis of SLC25A1 and AIFM2 (FSP1) protein levels in the proteomics of cancer cell line encyclopedia were assessed by spearman correlation coefficient and log-rank tests, ***p = 0.0002, R = 0.223. (B) Multiplex immunofluorescence staining of SLC25A1, ACLY and FSP1 in a melanoma tissue microarray. Representative images showing SLC25A1 in red, ACLY in yellow and FSP1 in green. Scale bars: left, 100 μm. (C, D) Relationship analysis of SLC25A1 (C) or ACLY (D) and FSP1 positive expression in melanoma tissue microarray were assessed by spearman correlation coefficient and log-rank tests, ****p = 4.83E−05, R = 0.4566 (C); ****p = 5.64E−06, R = 0.6512 (D). (E, F) The overall survival (OS) in skin cutaneous melanoma (SKCM) (E) and lung adenocarcinoma (LUAD) (F) patients with different SLC25A1-ACLY mRNA levels were assessed by Kaplan–Meier survival curves and log-rank tests using GEPIA2. (G) A schematic model showing the mechanism by SLC25A1, in concert with ACLY, drives the export of citrate from mitochondria and the subsequent synthesis of acetyl-CoA in the cytosol, thereby facilitating FSP1 acetylation at K168 site and preventing its proteasomal degradation. The blockade of SLC25A1-ACLY increases cell susceptibility to ferroptosis and markedly enhances ferroptosis-induced tumor suppression. Source data are available online for this figure.

References

    1. Adorno-Cruz V, Hoffmann AD, Liu X, Dashzeveg NK, Taftaf R, Wray B, Keri RA, Liu H (2021) ITGA2 promotes expression of ACLY and CCND1 in enhancing breast cancer stemness and metastasis. Genes Dis 8:493–508 - PMC - PubMed
    1. Albanese C, Avantaggiati ML (2015) The SLC25A1-p53 mutant crosstalk. Aging 7:519–520 - PMC - PubMed
    1. Bai X, Sui C, Liu F, Chen T, Zhang L, Zheng Y, Liu B, Gao C (2022) The protein arginine methyltransferase PRMT9 attenuates MAVS activation through arginine methylation. Nat Commun 13:5016 - PMC - PubMed
    1. Bersuker K, Hendricks JM, Li Z, Magtanong L, Ford B, Tang PH, Roberts MA, Tong B, Maimone TJ, Zoncu R et al (2019) The CoQ oxidoreductase FSP1 acts parallel to GPX4 to inhibit ferroptosis. Nature 575:688–692 - PMC - PubMed
    1. Carrer A, Trefely S, Zhao S, Campbell SL, Norgard RJ, Schultz KC, Sidoli S, Parris JLD, Affronti HC, Sivanand S et al (2019) Acetyl-CoA metabolism supports multistep pancreatic tumorigenesis. Cancer Discov 9:416–435 - PMC - PubMed

Substances

LinkOut - more resources