. 2025 Jan 29;24(1):9.
doi: 10.1186/s12941-025-00777-9.

Polyp and tumor microenvironment reprogramming in colorectal cancer: insights from mucosal bacteriome and metabolite crosstalk

Affiliations

Polyp and tumor microenvironment reprogramming in colorectal cancer: insights from mucosal bacteriome and metabolite crosstalk

Hadi Feizi et al. Ann Clin Microbiol Antimicrob. .

Abstract

Background: Highly frequent colorectal cancer (CRC) is predicted to have 3.2 million novel cases by 2040. Tumor microenvironment (TME) bacteriome and metabolites are proposed to be involved in CRC development. In this regard, we aimed to investigate the bacteriome and metabolites of healthy, adenomatous polyp, and CRC tissues.

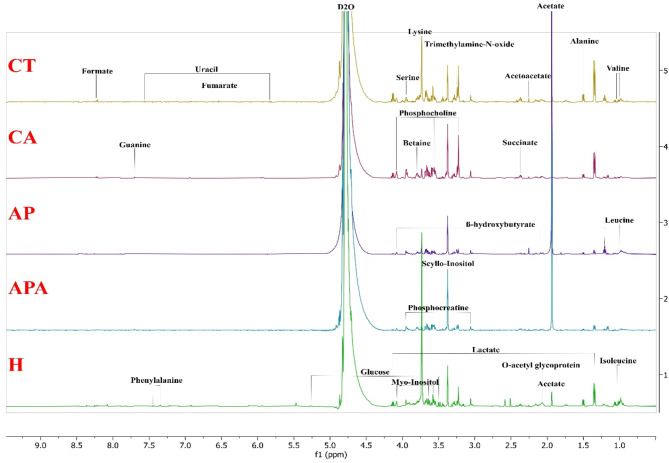
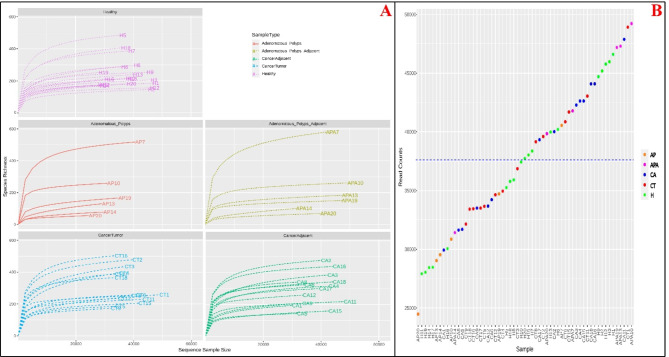
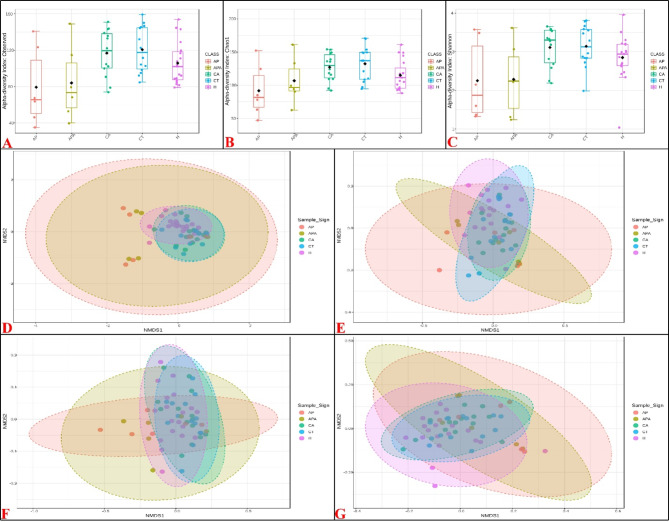
Methods: Sixty samples including healthy (H), adenomatous polyps (AP), adenomatous polyps-adjacent (APA), cancer tumor (CT), and cancer tumor-adjacent (CA) tissues were collected and analyzed by 16 S rRNA sequencing and 1H NMR spectroscopy.

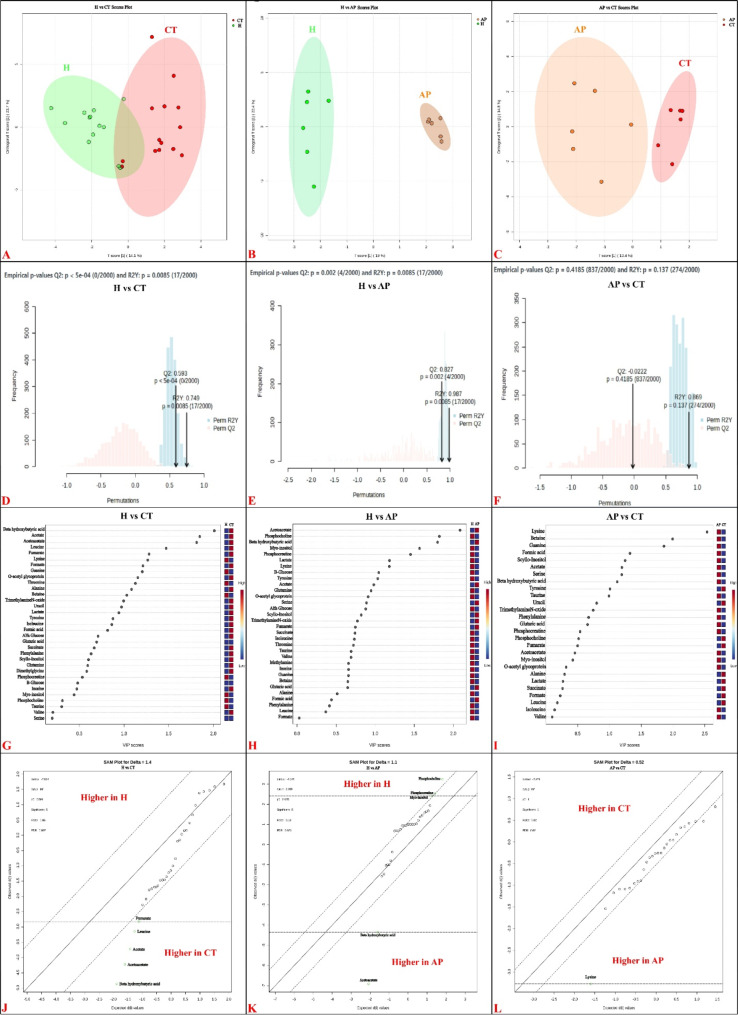
Results: Our results revealed that the bacteriome and metabolites of the H, AP, and CT groups were significantly different. We observed that the Lachnospiraceae family depleted concomitant with acetoacetate and beta-hydroxybutyric acid (BHB) accumulations in the AP tissues. In addition, some bacterial species including Gemella morbillorum, and Morganella morganii were enriched in the AP compared to the H group. Furthermore, fumarate was accumulated concomitant to Aeromonas enteropelogenes, Aeromonas veronii, and Fusobacterium nucleatum subsp. animalis increased abundance in the CT compared to the H group.

Conclusion: These results proposed that beneficial bacteria including the Lachnospiraceae family depletion cross-talk with acetoacetate and BHB accumulations followed by an increased abundance of driver bacteria including G. morbillorum, and M. morganii may reprogram polyp microenvironment leading to tumor initiation. Consequently, passenger bacteria accumulation like A. enteropelogenes, A.veronii, and F. nucleatum subsp. animalis cross-talking fumarate in the TME may aggravate cancer development. So, knowledge of TME bacteriome and metabolites might help in cancer prevention, early diagnosis, and a good prognosis.

Keywords: Fusobacterium nucleatum; Colorectal cancer; Gut metabolome; Gut microbiome; Tumor microenvironment.


Conflict of interest statement

Declarations. Ethics approval and consent to participate: The protocols described in this document were approved by the Tabriz Regional Ethics Committee (Tabriz University of Medical Sciences, Tabriz, Iran), No. I.R.TBZMED.REC.1400.155. All the procedures were done according to the Helsinki Declaration, and informed consent was obtained from all participants. Competing interests: The authors declare no competing interests. Consent for publication: All authors declare agreement and consent for publication.

Figures

Fig. 1
Fig. 1
Some of 500 MHz representative 1H NMR spectra (δ0.5–δ9.5) of different study group’s tissue sample metabolites. 1: healthy individuals (H), 2: adenomatous polyps adjacent (APA), 3: adenomatous polyps (AP), 4: cancer tumor adjacent (CA), and 5: cancer tumor (CT)
Fig. 2
Fig. 2
Bacteriome rarefaction curves and library size for studied samples. Rarefaction curves (A) and library size view (B) of 5 different studied groups including H (healthy), CA (cancer tumor adjacent), CT (cancer tumor), AP (adenomatous polyps), and APA (adenomatous polyps adjacent) represented according to feature abundance table containing raw counts. In the rarefaction curves the vertical axis shows the number of ESVs, and the number of reads is shown on the horizontal axis
Fig. 3
Fig. 3
Alpha and beta diversities of bacteriomes in studied groups. The figure indicates alpha and beta diversities of colorectal tissue bacteriome at the species level (H: healthy, CT: cancer tumor, CA: cancer tumor adjacent, AP: adenomatous polyps, and APA: adenomatous polyps adjacent). (A) alpha diversity of different studied groups using observed ESVs as diversity measure, and T-test / ANOVA as statistical method (p-value 0.010908; [ANOVA] F-value 3.6255). (B) alpha diversity of different studied groups using Chao1 index as diversity measure and T-test / ANOVA as the statistical method (p-value 0.01811; [ANOVA] F-value 3.2628). (C) alpha diversity of different studied groups using Shannon index as diversity measure and T-test / ANOVA as the statistical method (p-value 0.011059; [ANOVA] F-value 3.6156). (D) beta diversity using the ordination-based method of non-metric multidimensional scaling (NMDS), Bray-Curtis Index as distance method, and PERMANOVA (Permutational multivariate analysis of variance) as the statistical method ([PERMANOVA] F-value: 1.9149; p-value: 0.001). (E) beta diversity using the ordination-based method NMDS, Jensen-Shannon Divergence as the distance method, and PERMANOVA as the statistical method ([PERMANOVA] F-value: 2.2486; p-value: 0.001). (F) beta diversity using the ordination-based method NMDS Unweighted UniFrac as the distance method, and PERMANOVA as the statistical method ([PERMANOVA] F-value: 1.8716; p-value: 0.002). (G) beta diversity using the ordination-based method NMDS Weighted UniFrac as the distance method, and PERMANOVA as the statistical method ([PERMANOVA] F-value: 2.1332; p-value: 0.005)
Fig. 4
Fig. 4
Bacterial taxonomic composition of bacteriomes in different colorectal tissues (H: healthy, CT: cancer tumor, CA: cancer tumor adjacent, AP: adenomatous polyps, and APA: adenomatous polyps adjacent) in different taxonomic levels (phylum, class, order, family, genus, and species) represented by stacked bar plots. Stacked bar chart for relative abundance of the bacterial (A) phyla-level, (B) class-level, (C) order-level, (D) top 30 abundant families, (E) top 30 abundant genera, and (F) top 50 abundant species in different colorectal tissues. Features with counts smaller than 4 and 10% prevalence filtered as low read counts due to probable sequencing errors or low-level contamination. 10% of the features with the lowest percentages were also excluded using the inter-quantile range (IQR) as a low variance filter
Fig. 5
Fig. 5
The TSEA (Taxon Set Enrichment Analysis) module. (A) TSEA results using the most prevalent genera and species revealed in bacteriomes of CRC patients’ colorectal tissues. (B) TSEA results using the most prevalent genera and species revealed in bacteriomes of healthy individual’s colorectal tissues. Each node represents a taxon set with its color based on its p-value, and its size is based on the number of hits to the query. An edge connects two taxon sets if the shared hits exceed 20% of their combined taxa
Fig. 6
Fig. 6
Graphs obtained from comparative analysis data between metabolites of healthy (H), adenomatous polyp (AP), and cancer tumor (CT) groups. The OPLS-DA (Orthogonal partial least squares-discriminant analysis) score plots (6A-6C), OPLS-DA model validation with permutation tests (2000 permutations) and cross-validation (6D-6F), VIP (variable importance in projection) plots (6G-6I), and significant analysis of metabolites (SAM) (6J-6L). The green points represent metabolites that were significantly different between H vs. CT (6J), H vs. AP (6K), and AP vs. CT (6L). The solid diagonal line represents “observed = expected”. The more the variable diverges from the solid line the more likely it is to be significant
Fig. 7
Fig. 7
Correlation heatmap of colorectal bacteriome metabolome using Distance correlation test as similarity method. 10% of reads were removed as variance filter based on inter-quartile range, reads with counts less than 4 were also removed as abundance filter. Data scaled via autoscaling as normalization. Different studied groups were used as primary metadata (fixed effects). Age, BMI, and sex of the participants were used as covariates and accounted for in the statistics extracted for the primary metadata. MaAsLine2 is used for microbiome comparison analysis and Limma is used for metabolomics data. Features with a p-value less than 0.01 were considered significant. Significant correlations are highlighted with asterisks. The correlation threshold was set to more than 0.35. The color indicates the correlation calculated by the distance test as a similarity method. Comparisons were done between the healthy (H) vs. adenomatous polyp (AP) group (A), and the H vs. cancer tumor (CT) group (B) at the species taxonomic level with their identified metabolites according to their relative abundances

References

    1. Bray F, Laversanne M, Sung H, Ferlay J, Siegel RL, Soerjomataram I, Jemal A. Global cancer statistics 2022: GLOBOCAN estimates of incidence and mortality worldwide for 36 cancers in 185 countries. Cancer J Clin. 2022;74(3):229–63. - PubMed
    1. Feizi H, Plotnikov A, Rezaee MA, Ganbarov K, Kamounah FS, Nikitin S, Kadkhoda H, Gholizadeh P, Pagliano P, Kafil HS. Postbiotics versus probiotics in early-onset colorectal cancer. Crit Rev Food Sci Nutr. 2024;64(11):3573–82. - PubMed
    1. Feizi H, Rezaee AM, Ghotaslou R, Sadrkabir M, Jadidi-Niaragh F, Gholizadeh P, Taghizadeh S, Ghanbarov K, Yousefi M, Kafil SH. Gut microbiota and colorectal Cancer risk factors. Curr Pharm Biotechnol. 2023;24(8):1018–34. - PubMed
    1. White MT, Sears CL. The microbial landscape of colorectal cancer. Nat Rev Microbiol. 2024;22(4):240–54. - PubMed
    1. Rezasoltani S, Azizmohammad Looha M, Asadzadeh Aghdaei H, Jasemi S, Sechi LA, Gazouli M, Sadeghi A, Torkashvand S, Baniali R, Schlüter H, et al. 16S rRNA sequencing analysis of the oral and fecal microbiota in colorectal cancer positives versus colorectal cancer negatives in Iranian population. Gut Pathogens. 2024;16(1):9. - PMC - PubMed

MeSH terms

Substances

LinkOut - more resources