. 2025 Jan 21:2025:3645641.
doi: 10.1155/ijog/3645641. eCollection 2025.

Multiomics Analysis of Exportin Family Reveals XPO1 as a Novel Target for Clear Cell Renal Cell Carcinoma

Affiliations

Multiomics Analysis of Exportin Family Reveals XPO1 as a Novel Target for Clear Cell Renal Cell Carcinoma

Yanhong Hao et al. Int J Genomics. .

Abstract

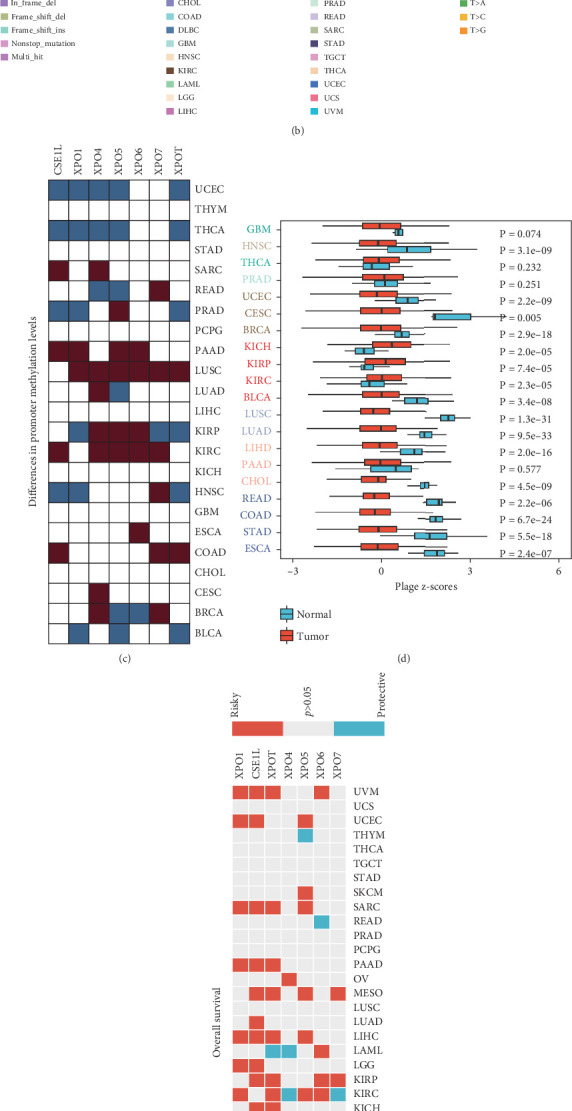
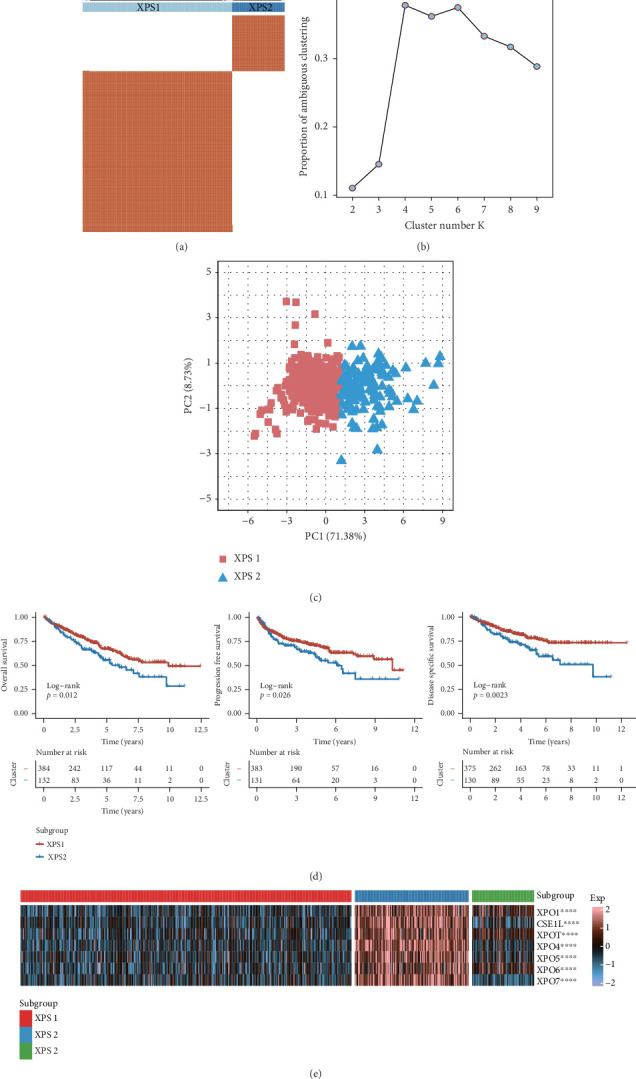
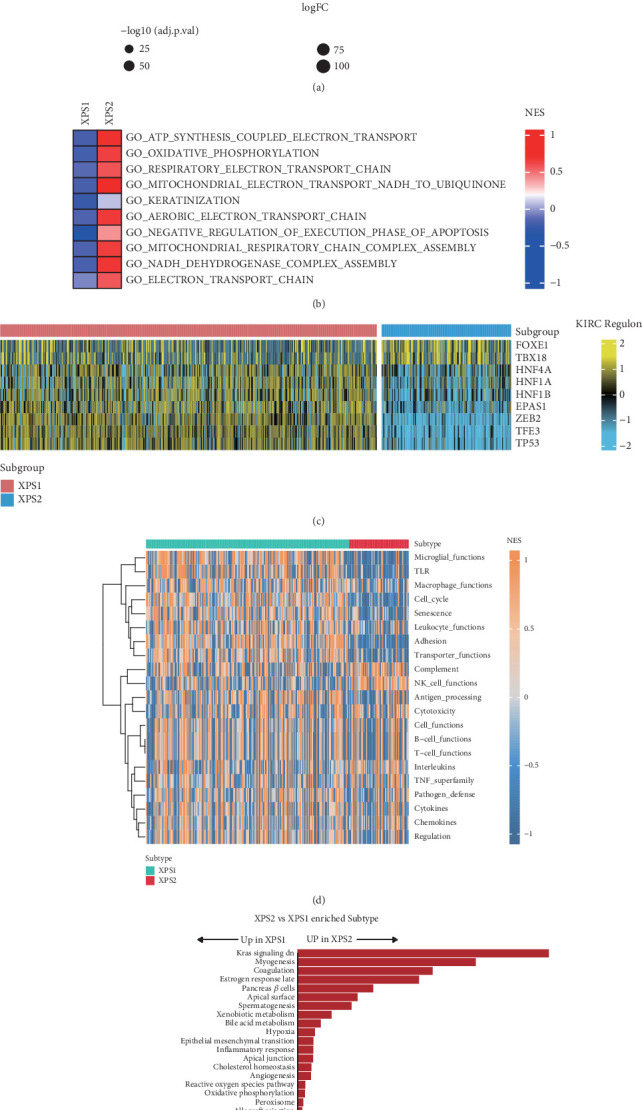
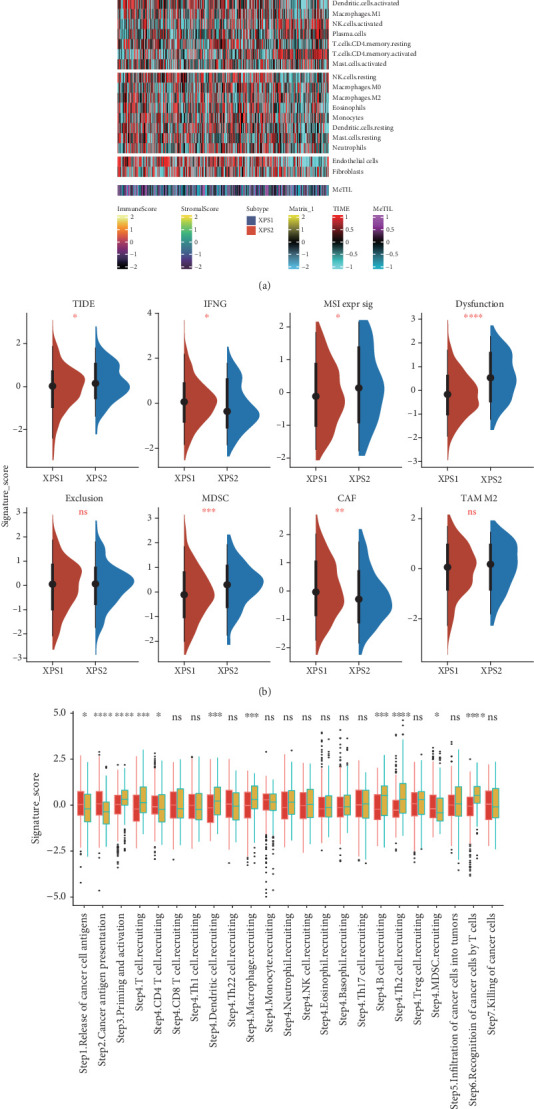
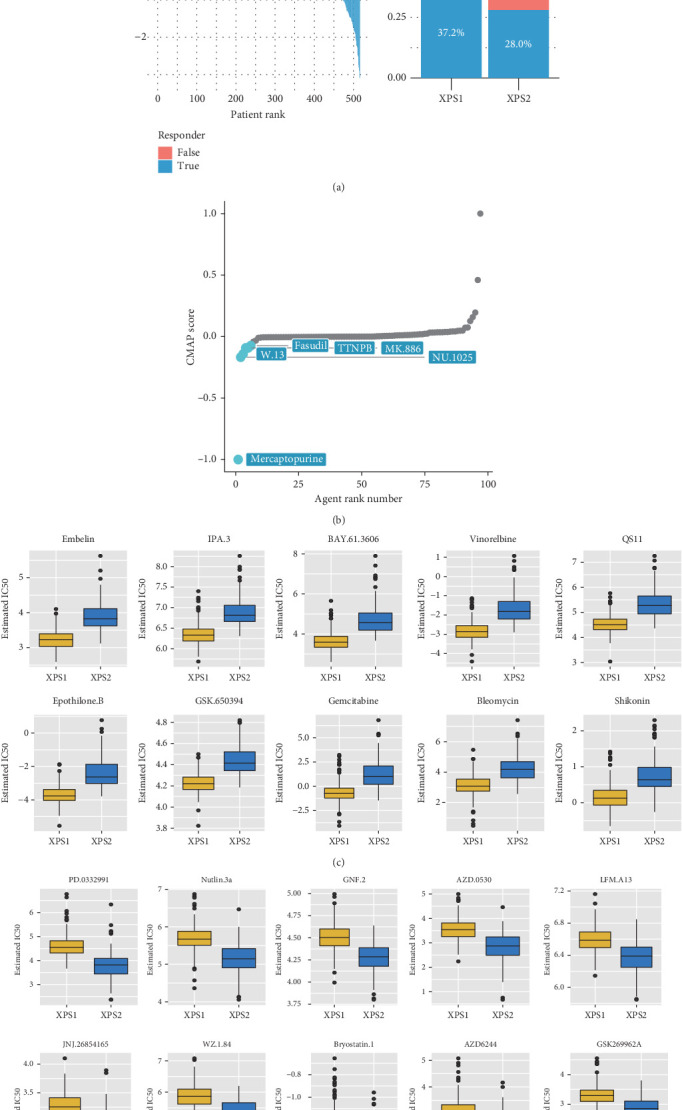
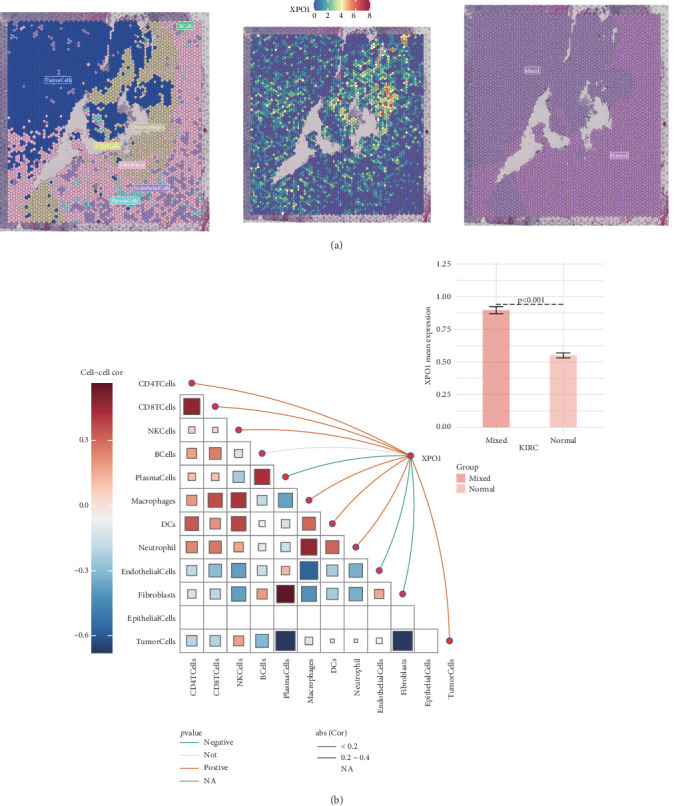
Background: Recently, exportin gene family members have been demonstrated to play essential roles in tumor progression. However, research on the clinical significance of exportin gene family members is limited in clear cell renal cell carcinoma (ccRCC). Methods: Pan-cancer data, ccRCC multiomics data, and single-cell sequence were included to analyze the differences in DNA methylation modification, single nucleotide variations (SNVs), copy number variations (CNVs), and expression levels of exportin gene family members. Non-negative matrix factorization was used to identify molecular subtypes based on exportin gene family members, and the prognostic and biological differences of different molecular subtypes were compared across multiple dimensions. Results: Exportin gene family members were upregulated in pan-cancer expression, and their aberrant expression was significantly influenced by DNA methylation, SNV, and CNV, particularly in ccRCC. Based on the expression matrix of exportin gene family members, two molecular subtypes, exportin famliy genes (XPO)-based subtype 1 (XPS1) and exportin famliy genes (XPO)-based subtype 2 (XPS2), were identified. The expression levels of exportin gene family members in the XPS2 subtype were significantly higher than those in XPS1, and the prognosis was poorer. The XPS2 subtype had lower immune component abundance and higher immune exhaustion scores. Its response rate to immunotherapy was significantly lower than that of the XPS1 subtype, but it was more sensitive to small molecules, including mercaptopurine and nutlin. Among them, exportin-1 (XPO1) is a potential diagnostic and therapeutic target for ccRCC, which can promote renal cancer progression by activating the PI3K-AKT-mTOR (phosphatidylinositol 3-kinase (PI3K)/AKT serine/threonine kinase (AKT)/mechanistic target of rapamycin (MTOR)) and interferon alpha pathways. Conclusion: This study analyzed the variations of exportin gene family members at the pan-cancer level and identified two distinct ccRCC subtypes, which can guide personalized management of patients.

Keywords: XPO1; clear cell renal cell carcinoma; exportin; pan-cancer; single-cell sequence.


Conflict of interest statement

The authors declare no conflicts of interest.

Figures

Figure 1
Figure 1
Expression differences, mutation frequencies, and DNA methylation levels of exportin family genes across pan-cancer. (a) Expression differences of exportin family genes between tumor and adjacent tissues across various cancer types (pan-cancer). Red represents higher expression in tumor tissues, while blue represents lower expression. (b) Oncoplot showing the mutation distribution of exportin family genes across pan-cancer. (c) Differential methylation levels of exportin family genes at their promoter regions. (d) Boxplot displaying the variation in exportin family gene-related scores across pan-cancer. (e) Prognostic value of exportin family genes in pan-cancer. Red indicates a risk factor, while blue indicates a protective factor. (f) Pie plot illustrating the copy number variations (CNVs) of exportin family genes among different cancer types. Red represents gene amplification, while blue represents gene deletion.
Figure 2
Figure 2
Classification of KIRC patients into two subtypes based on the expression of exportin family genes. (a) Consensus score matrix based on the expression of exportin family genes in TCGA-KIRC samples when the number of clusters (k) is set to 2. (b) PAC (partition around medoids) analysis for determining the optimal number of clusters, ranging from 2 to 9. (c) Principal component analysis (PCA) plot showing the two-dimensional distribution of XPS1 and XPS2 subtypes. (d) Kaplan−Meier curves for overall survival, progression-free survival, and disease-specific survival in the TCGA-KIRC cohort. (e) Heatmap displaying the relative expression differences of exportin family genes among XPS1, XPS2, and normal tissue samples. ⁣∗∗∗∗p < 0.0001.
Figure 3
Figure 3
Distinct biological characteristics between XPS1 and XPS2 subtypes. (a) Heatmap showing differentially expressed genes between XPS1 and XPS2 subtypes. (b) Heatmap illustrating the enriched Gene Ontology (GO) pathways between XPS1 and XPS2 subtypes. (c) Heatmap depicting the differences in KIRC-related transcription factor activity between XPS1 and XPS2 subtypes. (d) Heatmap displaying the differences in immune-related pathways between XPS1 and XPS2 subtypes. (e) Bar plot comparing the activation of hallmark gene sets between the two subtypes.
Figure 4
Figure 4
Differences in immune infiltration between XPS1 and XPS2 subgroups. (a) Heatmap showing immune scores, stromal scores, expression levels of immune checkpoint inhibitor (ICI)–related molecules, and the abundance of infiltrating immune cells in different subgroups. (b) Violin plot illustrating the differences in scores related to the tumor immune dysfunction and exclusion (TIDE) algorithm between the two subgroups. (c) Boxplot comparing the immune cycle scores obtained using the tumor immunophenotype (TIP) algorithm between the XPS1 and XPS2 groups. ⁣p < 0.05, ⁣∗∗p < 0.01, and ⁣∗∗∗p < 0.001; ns: no significance.
Figure 5
Figure 5
XPS subtyping is closely associated with KIRC treatment response rates. (a) TIDE algorithm analysis comparing the immunotherapy response rates between XPS1 and XPS2 subgroups. (b) Scatter plot showing the Connectivity Map (CMAP) scores of different drugs in the XPS2 subgroup. Higher CMAP scores indicate increased sensitivity of the XPS2 subgroup to the corresponding drug. (c) Boxplot displaying the sensitive drugs for XPS1 treatment and (d) XPS2 treatment based on an analysis of the Genomics of Drug Sensitivity in Cancer (GDSC) database.
Figure 6
Figure 6
Genomic mutation profiles of the two subgroups. (a) Waterfall plot showing the overall mutation rate of exportin family genes in the TCGA-KIRC cohort. (b) Waterfall plot illustrating the overall profile of frequently mutated genes in the TCGA-KIRC cohort. (c) Waterfall plot comparing the mutation frequency of frequently mutated genes between the XPS1 and (d) XPS2 subgroups. (e) Forest plot displaying the prognostic value of mutated genes between the two subgroups. (f) Bar plot comparing the differences in copy number variations (CNVs) between the two subgroups. ⁣p < 0.05 and ⁣∗∗p < 0.01.
Figure 7
Figure 7
Prognostic and biological roles of exportin family genes in KIRC. (a) Functional annotation of exportin family genes. (b) Univariate regression analysis assessing the impact of exportin family genes on the prognosis of KIRC patients. (c) Expression differences of XPO1 between KIRC tumors and adjacent tissues. (d) Meta-analysis evaluating the comprehensive prognostic effect of XPO1 in KIRC. (e) Determining the biological role of XPO1 in KIRC based on correlation analysis.
Figure 8
Figure 8
Single-cell subgroup distribution and functional differences of macrophages with varying exportin family scores. (a) t-SNE plot showing the distribution and proportions of each cell population. (b) Dot plot showing the marker genes of each cell population. (c) Dot plot showing the exportin family scores for each cell population calculated using five different algorithms. (d) Volcano plot showing differentially expressed genes between XPO high macrophages and XPO low macrophages. (e) Bar plot displaying enriched terms derived from the differential genes. (f) Chord diagram illustrating the communication strength between cell populations based on CellCall analysis. (g) Dot plot showing cell–cell communication enrichment scores related to tumor-associated pathways derived from CellCall analysis.
Figure 9
Figure 9
XPO1 is highly expressed in tumor-mixed regions and negatively correlated with stromal component infiltration. (a) Expression level and localization of XPO1 in the KIRC spatial transcriptome. (b) Line plot illustrating the correlation between XPO1 expression levels and the infiltration abundance of other cellular components in the spatial transcriptome.

Similar articles

References

    1. Moch H., Cubilla A. L., Humphrey P. A., Reuter V. E., Ulbright T. M. The 2016 WHO classification of tumours of the urinary system and male genital organs-part A: renal, penile, and testicular tumours. European Urology . 2016;70(1):93–105. doi: 10.1016/j.eururo.2016.02.029. - DOI - PubMed
    1. Xia C., Dong X., Li H., et al. Cancer statistics in China and United States, 2022: profiles, trends, and determinants. Chinese Medical Journal . 2022;135(5):584–590. doi: 10.1097/CM9.0000000000002108. - DOI - PMC - PubMed
    1. Sung H., Ferlay J., Siegel R. L., et al. Global cancer statistics 2020: GLOBOCAN estimates of incidence and mortality worldwide for 36 cancers in 185 countries. CA: A Cancer Journal for Clinicians . 2021;71(3):209–249. doi: 10.3322/caac.21660. - DOI - PubMed
    1. Yao L., Du Y., Dong W., et al. Chinese quality control indices for standardized diagnosis and treatment of renal cancer (2022 edition) Journal of the National Cancer Institute . 2024;4(1):6–13. doi: 10.1016/j.jncc.2023.11.004. - DOI - PMC - PubMed
    1. Jiang A., Li J., He Z., et al. Renal cancer: signaling pathways and advances in targeted therapies. MedComm . 2024;5(8) doi: 10.1002/mco2.676.e676 - DOI - PMC - PubMed

LinkOut - more resources