. 2025 Jan 15:4:1494717.
doi: 10.3389/fbinf.2024.1494717. eCollection 2024.

Developing a ceRNA-based lncRNA-miRNA-mRNA regulatory network to uncover roles in skeletal muscle development

Affiliations

Developing a ceRNA-based lncRNA-miRNA-mRNA regulatory network to uncover roles in skeletal muscle development

Wang Wenlun et al. Front Bioinform. .

Abstract

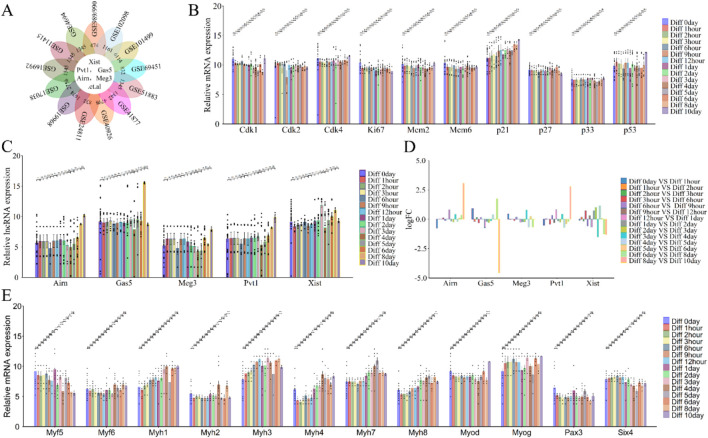
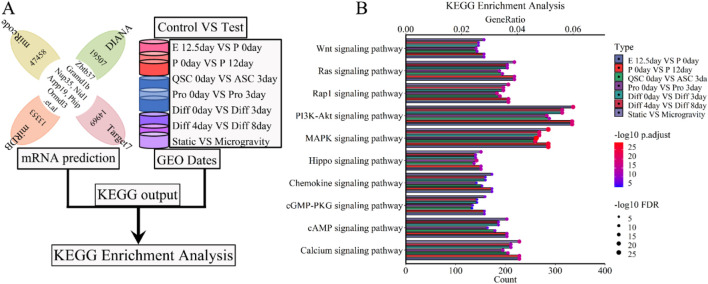
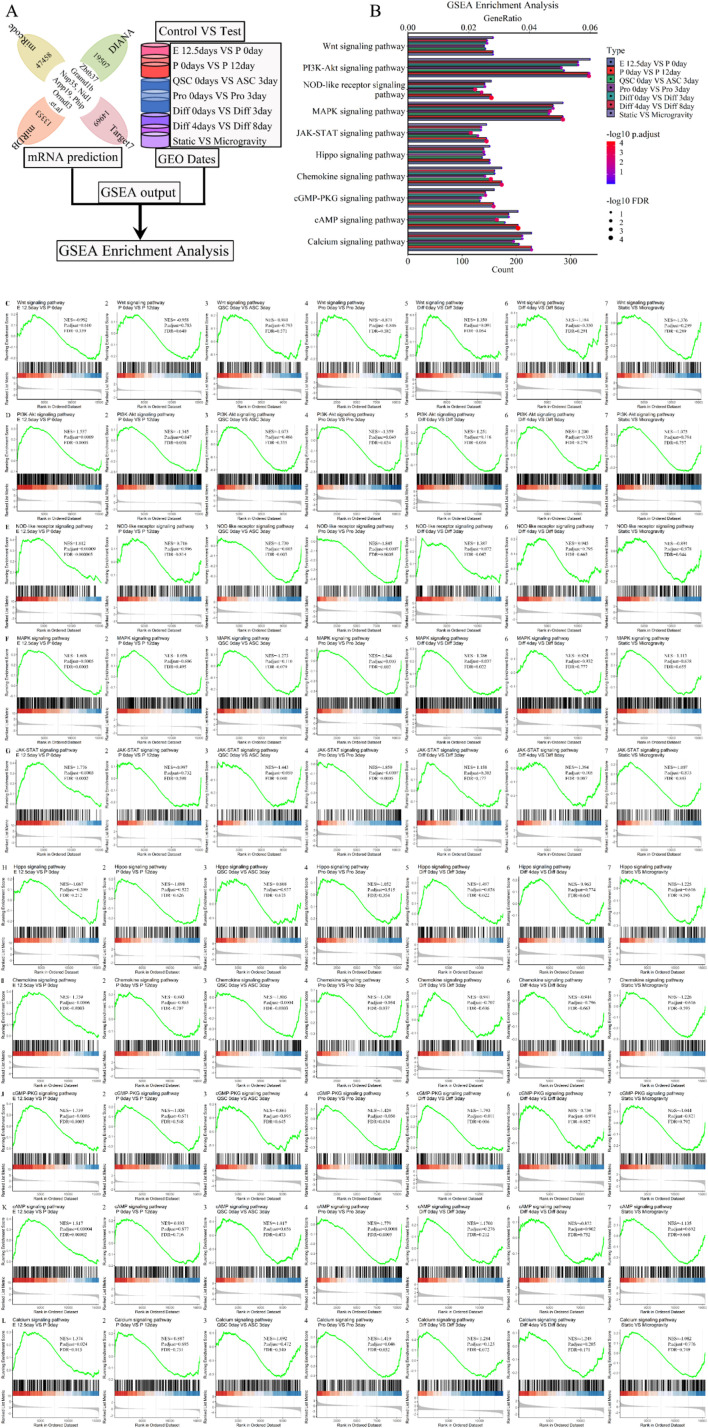
The precise role of lncRNAs in skeletal muscle development and atrophy remain elusive. We conducted a bioinformatic analysis of 26 GEO datasets from mouse studies, encompassing embryonic development, postnatal growth, regeneration, cell proliferation, and differentiation, using R and relevant packages (limma et al.). LncRNA-miRNA relationships were predicted using miRcode and lncBaseV2, with miRNA-mRNA pairs identified via miRcode, miRDB, and Targetscan7. Based on the ceRNA theory, we constructed and visualized the lncRNA-miRNA-mRNA regulatory network using ggalluvial among other R packages. GO, Reactome, KEGG, and GSEA explored interactions in muscle development and regeneration. We identified five candidate lncRNAs (Xist, Gas5, Pvt1, Airn, and Meg3) as potential mediators in these processes and microgravity-induced muscle wasting. Additionally, we created a detailed lncRNA-miRNA-mRNA regulatory network, including interactions such as lncRNA Xist/miR-126/IRS1, lncRNA Xist/miR-486-5p/GAB2, lncRNA Pvt1/miR-148/RAB34, and lncRNA Gas5/miR-455-5p/SOCS3. Significant signaling pathway changes (PI3K/Akt, MAPK, NF-κB, cell cycle, AMPK, Hippo, and cAMP) were observed during muscle development, regeneration, and atrophy. Despite bioinformatics challenges, our research underscores the significant roles of lncRNAs in muscle protein synthesis, degradation, cell proliferation, differentiation, function, and metabolism under both normal and microgravity conditions. This study offers new insights into the molecular mechanisms governing skeletal muscle development and regeneration.

Keywords: ceRNA network; cell proliferation and differentiation; lncRNA; muscle atrophy; muscle development and regeneration; signaling pathway.


Conflict of interest statement

The authors declare that the research was conducted in the absence of any commercial or financial relationships that could be construed as a potential conflict of interest.

Figures

FIGURE 1
FIGURE 1
The progression of skeletal muscle development and Schematic workflow of screening lncRNAs and bioinformatics analyses in skeletal muscle. (A) Study flow diagram showing GEO datasets used for analyses in skeletal muscle development. (B) Hierarchy of progression of skeletal muscle development contained embryonic development, postnatal growth, cell proliferation, cell differentiation, muscle regeneration and so on. For each step, markers for the early and late differentiation are indicated. The genes indicated in magenta encode transcription factors or sarcomeric and associated proteins. (C) Schematic illustration of an integrative computational analysis to map, annotate and reconstruct, to screen, validate and gene enrichment analysis lncRNAs in skeletal muscle development, such as KEGG, GO, Reactome, GSEA enrichment analysis and so on.
FIGURE 2
FIGURE 2
The 5 candidate lncRNAs (lncRNA Xist, lncRNA Gas5, lncRNA Pvt1, lncRNA Airn and lncRNA Meg3) were aberrantly expressed in GSE112768, GSE41877, GSE10246, and GSE165565 datasets. (A) Schematic workflow for statistical analysis process. A volcano plot was used to show the differentially expressed lncRNAs. The negative Log2-adjusted p-values (y-axis) are plotted against the Log2 fold changes in expression (x-axis). The horizontal dashed line indicates the threshold for significance (p ≤ 0.05) and the vertical dashed line indicates the upregulated (right side) and downregulated (left side) lncRNAs. (B) Volcano plot showing the differentially expressed lncRNAs between soleus myofibers nucleus versus cytoplasm in GSE112768. (C) Volcano plot showing the differentially expressed lncRNAs between EDL myofibers nucleus versus cytoplasm in GSE112768. (D) Volcano plot presenting the differentially expressed lncRNAs between C2C12 versus soleus in GSE41877. (E) Volcano plot presenting the differentially expressed lncRNAs between C2C12 versus EDL in GSE41877. (F) Volcano plot illustrating the differentially expressed lncRNAs between C2C12 versus muscle in GSE10246. (G) Volcano plot displaying the differentially expressed lncRNAs between static vs. simulated microgravity in GSE165565. EDL: extensor digitorum longus, SOL: Soleus.
FIGURE 3
FIGURE 3
Functional analysis of differentially expressed lncRNAs (lncRNA Xist, lncRNA Pvt1, lncRNA Gas5, lncRNA Airn and lncRNA Meg3) in stages of embryonic development and postnatal growth. (A) Flower plot diagram presents the overlap of common lncRNAs in GSE52192, GSE73575 and GSE65927 datasets. (B) The expression of lncRNA Xist, lncRNA Pvt1, lncRNA Gas5, lncRNA Airn and lncRNA Meg3 during Embryonic 12.5 days, Postnatal 0day, Postnatal 12day, Postnatal 28 days, Postnatal 65 days. (C) The expression of cell cycle related protein and inhibitor at Embryonic 12.5 days, Postnatal 0 day, Postnatal 12 days, Postnatal 28 days (D) Volcano plot showing the differentially expressed lncRNAs between Embryonic 12.5 days versus Postnatal 0 day. (E) Volcano plot presenting the differentially expressed lncRNAs between Postnatal 0day versus Postnatal 12days (F) Volcano plot illustrating the differentially expressed lncRNAs between Postnatal 12 days versus Postnatal 28 days. (G) Volcano plot displaying the differentially expressed lncRNAs between Postnatal 28 days versus Postnatal 65 days (H) The expression of key myogenic regulators during Embryonic 12.5 days, Postnatal 0 days, Postnatal 12 days, Postnatal 28 days. A volcano plot was used to show the differentially expressed lncRNAs. The negative Log2-adjusted P-values (y-axis) are plotted against the Log2 fold changes in expression (x-axis). The horizontal dashed line indicates the threshold for significance (P ≤ 0.05) and the vertical dashed line indicates the upregulated (right side) and downregulated (left side) lncRNAs. The data are presented as the means ± S.D. of the samples from all different samples. The p-values were calculated using Student’s t-test. NS, non-significant; *p < 0.05; **p < 0.01; ***p < 0.0001. (E) Embryonic; P: Postnatal.
FIGURE 4
FIGURE 4
Functional analysis of differentially expressed lncRNAs (lncRNA Xist, lncRNA Pvt1, lncRNA Gas5, lncRNA Airn and lncRNA Meg3) in phase of skeletal muscle regeneration. (A) Flower plot diagram shows the overlap of lncRNAs in GSE3483, GSE38870, GSE56903, GSE70376 and GSE103684 datasets. (B) The expression of cell cycle related protein and inhibitor at skeletal muscle regeneration. (C) The expression of lncRNA Xist, lncRNA Pvt1, lncRNA Gas5, lncRNA Airn and lncRNA Meg3 during E skeletal muscle regeneration. (D) Bar graphs presenting the differentially expressed lncRNAs (lncRNA Xist, lncRNA Pvt1, lncRNA Gas5, lncRNA Airn and lncRNA Meg3) in skeletal muscle development. Bar graphs was used to show the differentially expressed lncRNAs. The y-axis is Log2 fold changes in expression and x-axis is lncRNAs. (E) The expression of key myogenic regulators during skeletal muscle regeneration. The data are presented as the means ± S.D. of the samples from all different samples. The p-values were calculated using Student’s t-test. NS, non-significant; *p < 0.05; **p < 0.01; ***p < 0.0001. QSC, Quiescent satellite cells; ASC, Activated satellite cells.
FIGURE 5
FIGURE 5
Functional analysis of differentially expressed lncRNAs (lncRNA Xist, lncRNA Pvt1, lncRNA Gas5, lncRNA Airn and lncRNA Meg3) in phase of cell proliferation. (A) Flower plot diagram displays the overlap of lncRNAs in GSE989/990, GSE110742, GSE108040 and GSE16992 datasets. (B) Bar graphs presenting the differentially expressed lncRNAs (lncRNA Xist, lncRNA Pvt1, lncRNA Gas5, lncRNA Airn and lncRNA Meg3) in cell proliferation. Bar graphs was used to illustrate the differentially expressed lncRNAs. The y-axis is Log2 fold changes in expression and x-axis is lncRNAs. (C) The expression of lncRNA Xist, lncRNA Pvt1, lncRNA Gas5, lncRNA Airn and lncRNA Meg3 during cell proliferation. (D) The expression of key myogenic regulators during cell proliferation. (E) The expression of cell cycle related protein and inhibitor during cell proliferation. The data are presented as the means ± S.D. of the samples from all different samples. The p-values were calculated using Student’s t-test. NS, non-significant; *p < 0.05; **p < 0.01; ***p < 0.0001. Pro, proliferation; GSE989/990, GSE989 and GSE990.
FIGURE 6
FIGURE 6
Functional analysis of differentially expressed lncRNAs (lncRNA Xist, lncRNA Pvt1, lncRNA Gas5, lncRNA Airn and lncRNA Meg3) in phase of cell differentiation. (A) Flower plot diagram illustrates the intersection of the 13 datasets analyzed (GSE989/990, GSE102098, GSE101499 and so on). (B) The expression of cell cycle related protein and inhibitor during cell differentiation. (C) The expression of lncRNA Xist, lncRNA Pvt1, lncRNA Gas5, lncRNA Airn and lncRNA Meg3 during cell differentiation. (D) Bar graphs showing the differentially expressed lncRNAs (lncRNA Xist, lncRNA Pvt1, lncRNA Gas5, lncRNA Airn and lncRNA Meg3) in cell differentiation. Bar graphs was used to illustrate the differentially expressed lncRNAs. The y-axis is Log2 fold changes in expression and x-axis is lncRNAs. (E) The expression of key myogenic regulators during cell differentiation. The data are presented as the means ± S.D. of the samples from all different samples. The p-values were calculated using Student’s t-test. NS, non-significant; *p < 0.05; **p < 0.01; ***p < 0.0001. Diff, Differentiation; GSE989/990, GSE989 and GSE990.
FIGURE 7
FIGURE 7
Flowchart indicating the downstream analysis of the lncRNAs (lncRNA Xist, lncRNA Pvt1, lncRNA Gas5, lncRNA Airn and lncRNA Meg3) and Verification of miRNA differential expression. (A) Flow chart of the ceRNA network construction. Three independent lncRNA target databases (miRcode, lncBaseV2 and Enco/PV4) were used to predict the potential miRNAs, and screening for miRNAs highly related to microgravity-induced muscle atrophy or regeneration. Subsequently, four independent miRNAs target databases (miRcode, DIANA, miRDB and Target7) were used to predict the potential mRNAs, and using to constructing lncRNA–miRNA–mRNA ceRNA regulatory network. (B) The heat map showing the differentially expressed miRNA during HS 0day, HS 3 dayS, HS 7 dayS HS 14 dayS, RE 1day and RE 14days (C) Alluvial diagram demonstrates the relationships of lncRNA-miRNA-mRNA ceRNA regulatory network. The interaction network was constructed with there were 5 lncRNAs, 36 miRNAs, and approximately 100 mRNAs. Enco/PV4, ENCORI and NPInterv4; Target7, Targetscan7; GSE989/990, GSE989 and GSE990; HS, hindlimb suspension; RE, Recovery exercise.
FIGURE 8
FIGURE 8
GO enrichment analysis for the lncRNA-miRNA-mRNA ceRNA regulatory network of various stages of skeletal muscle development. (A) The workflow showed that the mRNA expression of various stages of skeletal muscle development were enriched with GO enrichment analysis. (B) The bubble pattern and bar chart show the 10 randomly chosen biological process with GeneRatio and gene count. The skeletal muscle development, wounding respond and protein secretion et al. correlated with gene enrichment. (C) The bubble pattern and bar chart display the 10 randomly chosen cellular component with GeneRatio and gene count. The cell membrane, microtubule, lysosome and mitochondrial et al. associated with gene enrichment. (D) The bubble pattern and bar chart display the 10 randomly chosen molecular function with GeneRatio and gene count. The various enzymes (ubiquitin-protein transferase, ATPase, Ras GTPase and so on), transcription coregulator, transmembrane transporter, cell cycle et,al interrelated with gene enrichment. E, Embryonic; P, Postnatal; QSC, Quiescent satellite cells; ASC, Activated satellite cells; Pro, Proliferation; Diff, Differentiation.
FIGURE 9
FIGURE 9
Reactome enrichment analysis for the lncRNA-miRNA-mRNA ceRNA regulatory network of various stages of skeletal muscle development. (A) The workflow showed that the mRNA expression of various stages of skeletal muscle development were enriched with Reactome enrichment analysis. (B) The bubble pattern and bar chart display the 10 randomly chosen molecular function with GeneRatio and gene count. The various enzymes (Rho GTPases, MAPK family signaling cascades, RAF/MAP kinase cascade, PIP3 activates AKT signaling, deubiquitination and so on), cell cycle, cell cycle checkpoints, metabolism, immune system et,al interrelated with gene enrichment. E, Embryonic; P, Postnatal; QSC, Quiescent satellite cells; ASC, Activated satellite cells; Pro, Proliferation; Diff, Differentiation.
FIGURE 10
FIGURE 10
KEGG enrichment analysis for the lncRNA-miRNA-mRNA ceRNA regulatory network of various stages of skeletal muscle development. (A) The workflow indicated that the mRNA expression of various stages of skeletal muscle development were enriched with KEGG enrichment analysis. (B) The bubble pattern and bar chart show the 10 randomly chosen signaling pathway with GeneRatio and gene count. The PI3K-Akt, MAPK, Calcium, Ras, Rap signaling pathway et al. involved in regulating various stages of skeletal muscle development and muscle atrophy (waste). E, Embryonic; P, Postnatal; QSC, Quiescent satellite cells; ASC, Activated satellite cells; Pro, Proliferation; Diff, Differentiation.
FIGURE 11
FIGURE 11
GSEA enrichment analysis for the lncRNA-miRNA-mRNA ceRNA regulatory network of various stages of skeletal muscle development. (A) The workflow indicated that the mRNA expression of various stages of skeletal muscle development were enriched with GSEA enrichment analysis. (B) The bubble pattern and bar chart show the 10 randomly chosen signaling pathway with GeneRatio and gene count. The Wnt, Hippo, Ampk, Chemokine, Apelin, PI3K-Akt, MAPK, Calcium, Ras, Rap signaling pathway et al. involved in regulating various stages of skeletal muscle development and muscle atrophy (waste). GSEA is a method that determines whether a set of genes shows differences between two biological states. The normalized enrichment score (NES) reflects the degree to which a gene set is upregulated (positive NES) or downregulated (negative NES). Corresponding p values are indicated. (C) GSEA plots showing enrichment of Wnt signaling pathway during skeletal muscle development and microgravity-induced muscle atrophy (waste). (D) GSEA plots showing enrichment of PI3K-Akt signaling pathway during skeletal muscle development and microgravity-induced muscle atrophy (waste). (E) GSEA plots showing enrichment of NOD-like receptor signaling pathway during skeletal muscle development and microgravity-induced muscle atrophy (waste). (F) GSEA plots showing enrichment of MAPK signaling pathway during skeletal muscle development and microgravity-induced muscle atrophy (waste). (G) GSEA plots showing enrichment of JAK-STAT signaling pathway during skeletal muscle development and microgravity-induced muscle atrophy (waste). (H) GSEA plots showing enrichment of Hippo signaling pathway during skeletal muscle development and microgravity-induced muscle atrophy (waste). (I) GSEA plots showing enrichment of Chemokine signaling pathway during skeletal muscle development and microgravity-induced muscle atrophy (waste). (J) GSEA plots showing enrichment of cGMP-PKG signaling pathway during skeletal muscle development and microgravity-induced muscle atrophy (waste). (K) GSEA plots showing enrichment of cAMP signaling pathway during skeletal muscle development and microgravity-induced muscle atrophy (waste). (L) GSEA plots showing enrichment of Calcium signaling pathway during skeletal muscle development and microgravity-induced muscle atrophy (waste). Normalized enrichment scores (NESs), FDR and nominal p values (Nom p value), as calculated by GSEA, are provided. skeletal muscle development stages contain E12.5 days VS P 0days, P 0days VS P 12 days, QSC 0days VS ASC 3 days, Pro 0days VS Pro 3 days, Diff 0 days VS Diff 3 days and Diff 4 days VS Diff 8 days. Microgravity-induced muscle atrophy (waste) is Static VS Microgravity. E, Embryonic; P, Postnatal; QSC, Quiescent satellite cells; ASC, Activated satellite cells; Pro, Proliferation; Diff, Differentiation.

Similar articles

References

    1. Adhikari A., Mainali P., Davie J. K. (2019). JARID2 and the PRC2 complex regulate the cell cycle in skeletal muscle. J. Biol. Chem. 294 (51), 19451–19464. 10.1074/jbc.ra119.010060 - DOI - PMC - PubMed
    1. Agarwal V., Bell G. W., Nam J. W., Bartel D. P. (2015). Predicting effective microRNA target sites in mammalian mRNAs. Elife 4, e05005. 10.7554/elife.05005 - DOI - PMC - PubMed
    1. Aguilar C. A., Pop R., Shcherbina A., Watts A., Matheny R., Jr., Cacchiarelli D., et al. (2016). Transcriptional and chromatin dynamics of muscle regeneration after severe trauma. Stem Cell Rep. 7 (5), 983–997. 10.1016/j.stemcr.2016.09.009 - DOI - PMC - PubMed
    1. Alessio E., Buson L., Chemello F., Peggion C., Grespi F., Martini P., et al. (2019). Single cell analysis reveals the involvement of the long non-coding RNA Pvt1 in the modulation of muscle atrophy and mitochondrial network. Nucleic Acids Res. 47 (4), 1653–1670. 10.1093/nar/gkz007 - DOI - PMC - PubMed
    1. Ballarino M., Morlando M., Fatica A., Bozzoni I. (2016). Non-coding RNAs in muscle differentiation and musculoskeletal disease. J. Clin. Invest 126 (6), 2021–2030. 10.1172/jci84419 - DOI - PMC - PubMed

LinkOut - more resources