

SARS-CoV-2 CoCoPUTs: analyzing GISAID and NCBI data to obtain codon statistics, mutations, and free energy over a multiyear period
- PMID: 39882309
- PMCID: PMC11776705
- DOI: 10.1093/ve/veae115
SARS-CoV-2 CoCoPUTs: analyzing GISAID and NCBI data to obtain codon statistics, mutations, and free energy over a multiyear period
Abstract
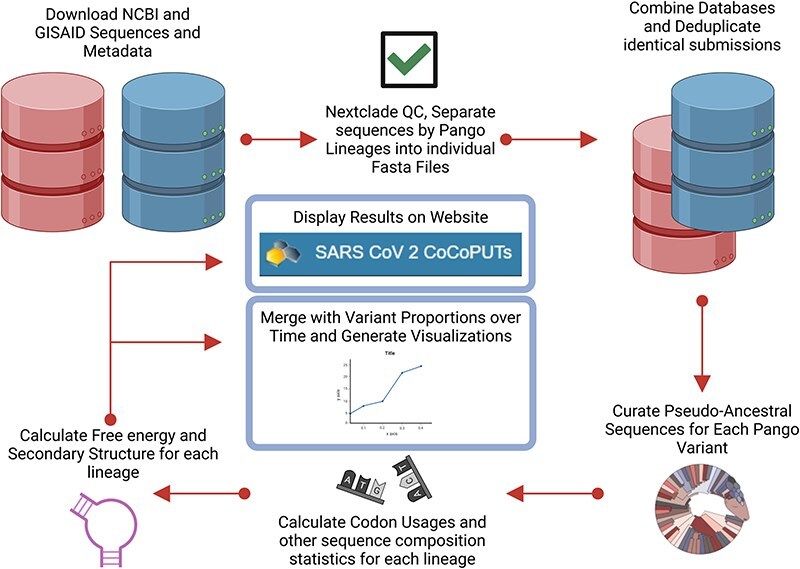
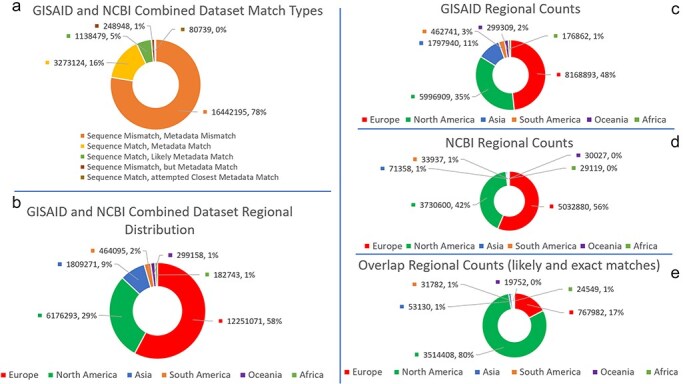
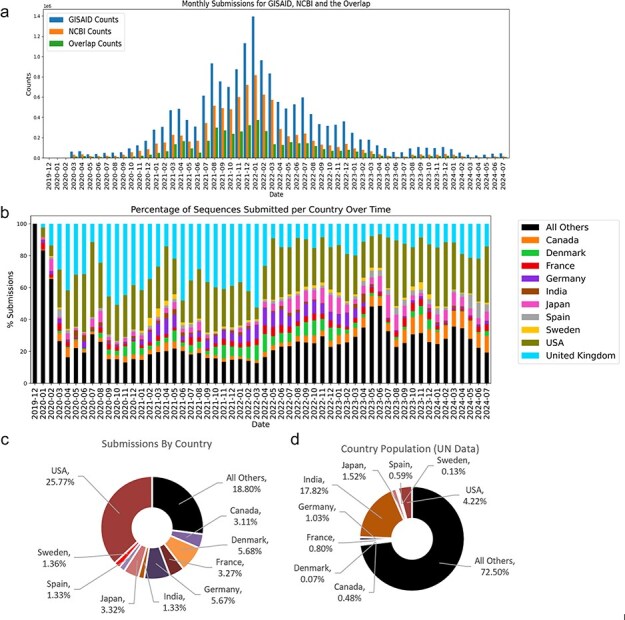
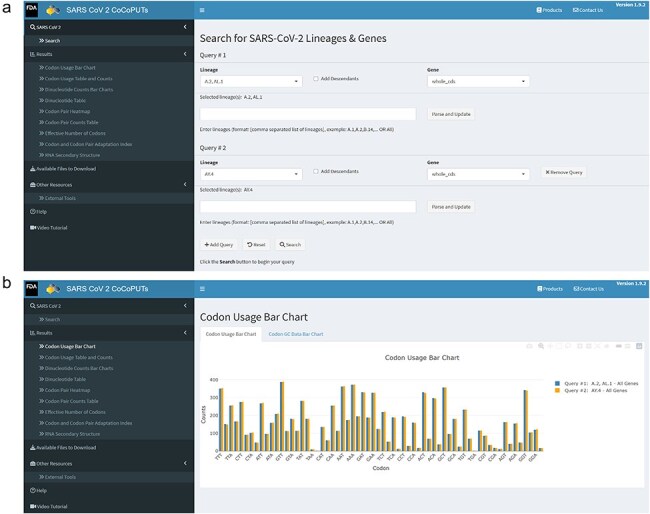
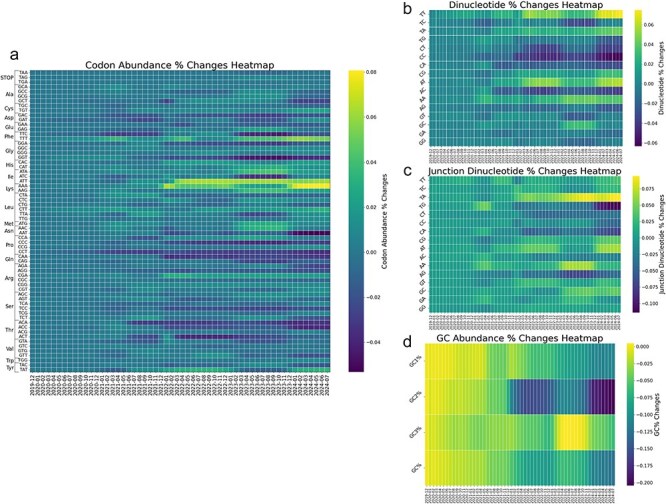
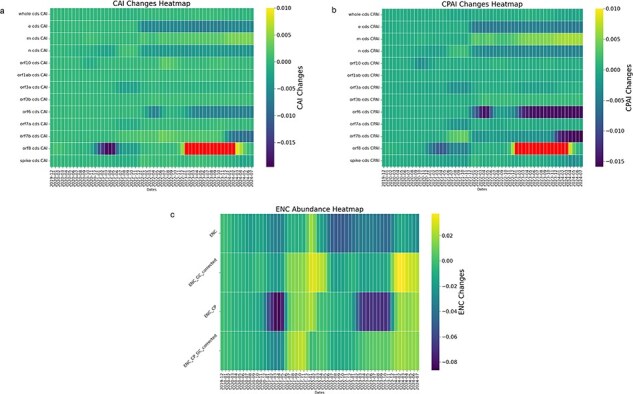
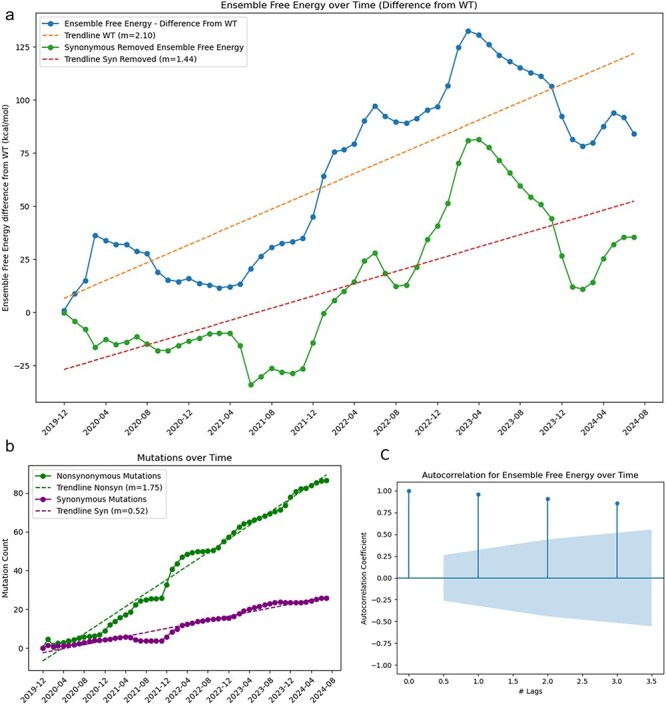
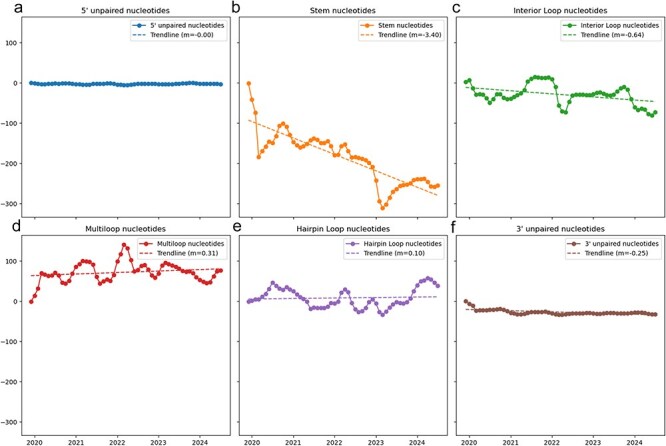
A consistent area of interest since the beginning of the severe acute respiratory syndrome coronavirus 2 (SARS-CoV-2) pandemic has been the sequence composition of the virus and how it has changed over time. Many resources have been developed for the storage and analysis of SARS-CoV-2 data, such as GISAID (Global Initiative on Sharing All Influenza Data), NCBI, Nextstrain, and outbreak.info. However, relatively little has been done to compile codon usage data, codon-level mutation data, and secondary structure data into a single database. Here, we assemble the aforementioned data and many additional virus attributes in a new database entitled SARS-CoV-2 CoCoPUTs. We begin with an overview of the composition and overlap between two of the largest sources of SARS-CoV-2 sequence data: GISAID and NCBI Virus (GenBank). We then evaluate different types of sequence curation strategies to reduce the dataset of millions of sequences to only one sequence per Pango lineage variant. We then performed specific analyses on the coding sequences (CDSs), including calculating codon usage, codon pair usage, dinucleotides, junction dinucleotides, mutations, GC content, effective number of codons (ENCs), and effective number of codon pairs (ENCPs). We have also performed whole-genome secondary RNA structure prediction calculations for each variant, using the LinearPartition software and modified selective 2'-hydroxyl acylation analyzed by primer extension (SHAPE) data that are available online. Finally, we compiled all the data into our resource, SARS-CoV-2 CoCoPUTs, and paired many of the resulting statistics with variant proportion data over time in order to derive trends in viral evolution. Although the overall codon usage of SARS-CoV-2 did not change drastically, in line with the previous literature on this subject, we did observe that while overall GC% content decreased, GC% of the third position in the codon was more positive relative to overall GC% content between February 2021 and July 2023. Over the same interval, we noted that both synonymous and nonsynonymous mutations increased in number, with nonsynonymous mutations outpacing synonymous mutations at a rate of 3:1. We noted that the predicted whole-genome secondary structures nearly all contained the previously described virus-activated inhibitor of translation (VAIT) stem loops, validating for the first time their existence in a whole-genome secondary structure prediction for many SARS-CoV-2 variants (as opposed to previous local secondary structure predictions). We also separately produced a synonymous mutation-deprived set of SARS-CoV-2 variant sequences and repeated the secondary structure calculations on this set. This revealed an interesting trend of reduced ensemble free energy compared to the unaltered variant structures, indicating that synonymous mutations play a role in increasing the free energy of viral RNA molecules. These data both validate previous studies describing increases in viral free energy in human viruses over time and indicate a possible role for synonymous mutations in viral biology.
Keywords: SARS-CoV-2; VAIT; bioinformatics; codon usage; secondary structure.
Published by Oxford University Press 2025. This work is written by (a) US Government employee(s) and is in the public domain in the US.
Conflict of interest statement
None declared.
Figures
Similar articles
-
Prediction of the effects of the top 10 synonymous mutations from 26645 SARS-CoV-2 genomes of early pandemic phase.F1000Res. 2024 Sep 18;10:1053. doi: 10.12688/f1000research.72896.4. eCollection 2021. F1000Res. 2024. PMID: 39268187 Free PMC article.
-
Measures implemented in the school setting to contain the COVID-19 pandemic.Cochrane Database Syst Rev. 2022 Jan 17;1(1):CD015029. doi: 10.1002/14651858.CD015029. Cochrane Database Syst Rev. 2022. Update in: Cochrane Database Syst Rev. 2024 May 2;5:CD015029. doi: 10.1002/14651858.CD015029.pub2. PMID: 35037252 Free PMC article. Updated.
-
Signs and symptoms to determine if a patient presenting in primary care or hospital outpatient settings has COVID-19.Cochrane Database Syst Rev. 2022 May 20;5(5):CD013665. doi: 10.1002/14651858.CD013665.pub3. Cochrane Database Syst Rev. 2022. PMID: 35593186 Free PMC article.
-
Systemic pharmacological treatments for chronic plaque psoriasis: a network meta-analysis.Cochrane Database Syst Rev. 2021 Apr 19;4(4):CD011535. doi: 10.1002/14651858.CD011535.pub4. Cochrane Database Syst Rev. 2021. Update in: Cochrane Database Syst Rev. 2022 May 23;5:CD011535. doi: 10.1002/14651858.CD011535.pub5. PMID: 33871055 Free PMC article. Updated.
-
The Black Book of Psychotropic Dosing and Monitoring.Psychopharmacol Bull. 2024 Jul 8;54(3):8-59. Psychopharmacol Bull. 2024. PMID: 38993656 Free PMC article. Review.
References
Grants and funding
LinkOut - more resources
Full Text Sources
Miscellaneous
