. 2025 Dec;17(1):2457471.
doi: 10.1080/19420862.2025.2457471. Epub 2025 Jan 30.

Biparatopic binding of ISB 1442 to CD38 in trans enables increased cell antibody density and increased avidity

Affiliations

Biparatopic binding of ISB 1442 to CD38 in trans enables increased cell antibody density and increased avidity

Jeremy Loyau et al. MAbs. 2025 Dec.

Abstract

ISB 1442 is a bispecific biparatopic antibody in clinical development to treat hematological malignancies. It consists of two adjacent anti-CD38 arms targeting non-overlapping epitopes that preferentially drive binding to tumor cells and a low-affinity anti-CD47 arm to enable avidity-induced blocking of proximal CD47 receptors. We previously reported the pharmacology of ISB 1442, designed to reestablish synthetic immunity in CD38+ hematological malignancies. Here, we describe the discovery, optimization and characterization of the ISB 1442 antigen binding fragment (Fab) arms, their assembly to 2 + 1 format, and present the high-resolution co-crystal structures of the two anti-CD38 Fabs, in complex with CD38. This, with biophysical and functional assays, elucidated the underlying mechanism of action of ISB 1442. In solution phase, ISB 1442 forms a 2:2 complex with CD38 as determined by size-exclusion chromatography with multi-angle light scattering and electron microscopy. The predicted antibody-antigen stoichiometries at different CD38 surface densities were experimentally validated by surface plasmon resonance and cell binding assays. The specific design and structural features of ISB 1442 enable: 1) enhanced trans binding to adjacent CD38 molecules to increase Fc density at the cancer cell surface; 2) prevention of avid cis binding to monomeric CD38 to minimize blockade by soluble shed CD38; and 3) greater binding avidity, with a slower off-rate at high CD38 density, for increased specificity. The superior CD38 targeting of ISB 1442, at both high and low receptor densities, by its biparatopic design, will enhance proximal CD47 blockade and thus counteract a major tumor escape mechanism in multiple myeloma patients.

Keywords: Biparatopic bispecific antibody; CD38; CD47; CDC; co-crystal structures; innate cell modulator.


Conflict of interest statement

No potential conflict of interest was reported by the author(s).

Figures
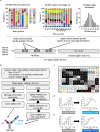
Figure 1.
Figure 1.
Identification of anti-CD47 and anti-CD38 common light chain fabs for the generation of ISB 1442. a Design of common light chain scFv phage display library. Library framework is based on 4 VH germlines, VH1–69, VH3–15, VH3–23 and VH3–53, and a fixed Vκ3–15/Jκ1 light chain. HCDRs were randomized using trinucleotide primers mimicking natural position-specific diversity and HCDR3 length distribution. b overview of the antibody discovery workflow for the generation of ISB 1442. c epitope binning results showing plot of saturating antibody in rows against competing antibodies in columns. Values indicate percentage of binding of competing antibody to CD38 relative to maximum binding in the absence of saturating antibody. Values less than 30 were assigned as competing antibodies and shaded in black, values between 30 and 50 were assigned as partially competing antibodies and shaded in light gray, while values greater than 50 were assigned as non-competing antibodies. Self-blocks are outlined by a dark-gray box. NT = not tested. Cross-competition results between: E2 and B6; E2 and daratumumab; B6 and daratumumab are outlined in blue, yellow and red, respectively. d-e. Fitted sensorgrams of a representative measurement show the binding of E2 and E2-RecA fabs (d), and B6 and B6-D9 fabs (e) at increasing concentrations onto immobilized human CD38. Colored curves represent experimental data and black curves represent 1:1 kinetic fits.
Figure 2.
Figure 2.
Crystal structure of human CD38 in complex with the anti-CD38 B6-D9 and anti-CD38 E2-RecA fabs. a Overall structure of CD38 in complex with the B6-D9 fab from ISB 1442 BEAT® as determined from the crystal structures of CD38/B6-D9 (PDB 9GOX). hsCD38 (uniprot ID P28907) as a space filling representation is shaded in white with B6-D9 epitope colored in light blue, ribbon diagrams of the fab heavy chain in blue and fab common light chain (cLC) in gray. b footprint of B6-D9 fab on human CD38 highlighting CD38 epitope residues interacting with B6-D9. c surface representation of the B6-D9 epitopes on CD38 with side chains of interacting paratope residues from the fab shown and colored by CDR loop. d structure representation of CD38 in complex with the E2-RecA fab as determined from the crystal structures of CD38/E2-RecA (PDB 9GOY). hsCD38 is shaded in white with E2-RecA epitope colored in light cyan, fab heavy chain in cyan and fab cLC in gray. e footprint of E2-RecA fab on human CD38 epitope with E2-RecA interacting residues numbered. f surface representation of the E2-RecA epitope on CD38 with side chains of interacting paratope residues from E2-RecA shown and colored by CDR loop. HCDR1, blue; HCDR2, orange; HCDR3, pink; LCDR3, grey.
Figure 3.
Figure 3.
Anti-CD38 B6-D9, anti-CD38 E2-RecA, daratumumab and isatuximab bind to distinct epitopes on human CD38. a Footprint of B6-D9 and E2-RecA on the hsCD38 highlighting CD38 residues interacting with B6-D9 in light blue and E2-RecA in light cyan. b footprint of daratumumab on the hsCD38 highlighting CD38 residues interacting with daratumumab in limon. c footprint of isatuximab on the hsCD38 highlighting CD38 residues interacting with isatuximab in yellow. d surface representation of the epitopes of B6-D9, E2-RecA, daratumumab and ixatuximab. Residues labeled correspond to overlapping residues between the epitope of B6-D9 and daratumumab (light green), the epitope of B6-D9 and isatuximab (brown) and the epitope of E2-RecA and isatuximab (green). e the binding modes of anti-CD38 B6-D9, E2-RecA and daratumumab on CD38 show that all fabs can bind simultaneously to the surface of CD38. CD38 is represented as a space filling representation with B6-D9 and E2-RecA epitopes in light blue and light cyan, respectively. The B6-D9 and E2-RecA fabs are depicted and colored as described in Figure 1. f while E2-RecA and isatuximab can bind simultaneously to CD38, the binding orientations of B6-D9 and isatuximab clearly cause steric collision between both fabs, preventing their simultaneous binding to CD38. The light chain of the anti-CD38 B6-D9 fab sterically clashes with the heavy chain of isatuximab (heavy chain in orange and light chain in yellow space filling). The steric collision of the two antibodies is indicated with a dashed ellipse. B6-D9 epitope is highlighted in light blue.
a Superposition of the structures of B6-D9 and E2-RecA Fabs bound to human CD38 showing that the distance between the C-terminal part of B6-D9 and the N-terminal part of E2-RecA is more than 96 Å. b Model of an artificial (G4S)8 linker between B6-D9 and E2-RecA illustrating the minimum length required to enable ISB 1442 to bind to the same antigen.
Figure 4.
ISB 1442 dual fab arm cannot bind CD38 in cis. B6-D9 and E2-RecA Fabs bind distinct epitopes located on opposite side of hsCD38. a The distance between the C-terminal extremity of B6-D9 and the N-terminal extremity of E2-RecA is more than 95 Å. b to allow both Fabs to bind simultaneously to the same antigen it would require at least a (G4S)8 linker to cover the distance of 96 Å (yellow line, left panel)). Artificial (G4S)8 linker is colored in red (right panel). VH and CH1 domains of the anti-CD38 B6-D9 and E2-RecA are represented blue and magenta, respectively.
a Light scattering data and measured molecular mass of ISB 1442, CD38 and ISB 1442/CD38 complex were assessed by SEC-MALS. The plot shows an overlay of the chromatograms as a function of elution time. b Single-particle 2D class average reconstructions of the ISB 1442/CD38 complex (left) and schematic diagram (right) illustrating the stoichiometry of the complex observed from negative-stained images. c 360 degrees views of low-resolution negative-stain electron microscopy maps of the ISB 1442/CD38 complex in different orientations, showing two ISB 1442 dual fab arm bound to two CD38 in an antiparallel fashion. d The envelope from the negative-stain electron microscopy map is shown as a transparent surface overlaying the modeled crystal structure of the Fabs and CD38 antigen complex.
Figure 5.
ISB 1442 forms 2:2 heterodimer complexes in solution binding to two CD38 in an antiparallel fashion. a ISB 1442:CD38 binding stoichiometry. SEC-MALS profiles for CD38, ISB 1442 and ISB 1442/CD38 complex in the presence of excess of CD38 after overnight incubation. The relative absorbance at 280 nm (right y-axis) is plotted against elution volume from a Shodex column (protein LW-803) and overlaid with the molar mass determined for each peak (left y-axis). Predicted and calculated molecular masses are shown in the table. b Representative cryo-em 2D class average (left) and a schematic diagram of the ISB 1442/CD38 complex (right). c low resolution negative-stain (NS) EM maps showing two ISB 1442 dual fab arm bound to two CD38 in an antiparallel fashion. d overlay of the model NS EM map with the crystal structure.
a Cartoon depicting at which position each of the anti-CD38 Fab or the dummy Fab is placed in ISB 1442, CD47_CD38-1+1, CD47_CD38-2+2, CD47_CD38-1_DU and CD47_CD38-2_DU. b Two plots showing differences in binding responses to human CD38 between antibodies at different concentration to 10 RU CD38 surface density on the left and to 300 RU CD38 surface density on the right, measured by SPR. c Table showing the percent of theoretical Rmax for each antibody at each CD38 surface density. d Table showing the percent of theoretical Rmax of antibodies relative to ISB 1442 at each CD38 surface density.
Figure 6.
Binding comparison of ISB 1442 and monoparatopic control antibodies to different human CD38 surface densities by SPR. a schematic view of ISB 1442, CD38-monoparatopic bivalent and CD38-monoparatopic monovalent control antibodies used in the assay. Immunoglobulin domains are shown as rectangles. VH of anti-CD38 fab domains are shown in two different shades of blue. VH of anti-CD47 is depicted in pink. All fab domains make use of an identical common light chain (cLC) depicted in gray. The BEAT® interface in the CH3 domains is depicted by the yellow and black dots. b plots of binding response at end of association (in response units, RU, y-axis) vs analyte concentration (in nM, x-axis) for ISB 1442 and control antibodies to human CD38 immobilized at a 10 RU surface density (left panel) or at a 300 RU surface density (right panel) on a sensor CHIP as determined by SPR. All blank-subtracted binding levels were normalized to capture levels. Curves are colored by antibody used as analyte. c table shows percent of theoretical rmax (% Rmaxtheo) calculated for a 1:1 antibody:CD38 interaction using a 1:1 kinetic fit. d table shows percent Rmaxtheo of control antibodies as compared to ISB 1442 at different CD38 surface density. * in (c) and (d): data less precise (estimates) as CD47_CD38-2_DU did not reach surface saturation.
a Five SPR binding sensorgrams showing differences in dissociation of ISB 1442, CD47_CD38-1+1 and CD47_CD38-2+2 antibodies, and no difference in dissociation of CD47_CD38-1_DU, CD47_CD38-2_DU, at different CD38 densities. b Table showing the relative dissociation of ISB 1442, CD47_CD38-1+1, CD47_CD38-2+2, CD47_CD38-1_DU and CD47_CD38-2_DU at CD38 densities of 30 RU, 100 RU and 300 RU as compared to 10 RU.
Figure 7.
ISB 1442 binding affinity to CD38 is increased at high CD38 surface density. a. SPR binding sensorgrams of ISB 1442 and control antibodies injected in single-cycle at concentrations from 0.41 nM to 100 nM in 1/3 dilution series over immobilized human CD38. Binding response curves to human CD38 immobilized at 10 RU, 30 RU, 100 RU and 300 RU are displayed in single plot per antibody. Binding response curves were aligned on the y-axis on the CD38 capture level and normalized to the end of the last concentration of antibody injection to allow direct comparison of dissociation curves. Plots embedded in larger plots show amplified dissociation phases, respectively. Data show normalized response (RU, y-axis) over time (s, x-axis). Curves are colored by CD38 capture level. b table shows fold increase stability of each antibody at 30 RU, 100 RU and 300 RU CD38 capture level as compared to 10 RU CD38 capture level.
Figure 8.
Figure 8.
Biparatopic versus monovalent CD38 targeting. a schematic view of ISB 1442 and dummy control antibodies. b-d cancer cell lines were incubated with varying antibody concentrations and analyzed by flow cytometry. Upper row: representative experiment shows relative fluorescent intensity (RFI) plotted against antibody concentration for CD38low cells (KMS-12-BM) (b), CD38low-intermediate cells (NCI-H929) (c) and CD38high cells (Daudi) (d). Lower row: respective plots of mean RFI ± standard deviation (SD) in at least 3 independent experiments. Statistics: ns = not significant, *p < 0.05 **p < 0.01 (RM one-way ANOVA followed by šidák’s multiple comparisons tests).
Figure 9.
Figure 9.
Structural modeling of biparatopic interactions of ISB 1442 BEAT® with human CD38. a from left to right, computational model of two ISB 1442 molecules interacting with the same membrane integrated CD38 monomer (2:1); two ISB 1442 molecules interacting with two different membrane integrated CD38 monomers (2:2); three ISB 1442 molecules interacting with two different membrane integrated CD38 monomers (3:2); and four ISB 1442 molecules interacting with three different membrane integrated CD38 monomers (~4:3). VH domains of the anti-CD38 B6-D9 and E2-RecA are represented in blue and cyan, respectively. VH domain of the anti-CD47 binder is represented in purple. All binders make use of a common light chain (cLC) depicted in gray (VL) and light gray (CL). CH1 domain is represented in black and the Fc domain in white. Membrane lipid bilayer is depicted in brown. b-d. Schematic representation of the different binding modes of ISB 1442 (b), a CD38 monoparatopic bivalent anti-CD38×CD47 bispecific antibody (c) and a CD38 monovalent anti-CD38×CD47 bispecific antibody (d) depending on the expression of CD38 at the cell surface. Dual biparatopic arm enables to increase target occupancy and antibody densities on the target cell surface (particularly for low CD38 expressing cells) favoring overall functional activity. Antibodies colored as in Figure 8a, with chain a IgG1 CH2 and chain B engineered human IgG1 CH2-CH3 represented as solid line white square and chain a engineered IgG3 CH3 represented in dash line white square. CD38 monomer is depicted in green. The BEAT® interface shown in the CH3 domains is depicted by the green and black dots.

References

    1. Spiess C, Zhai Q, Carter PJ.. Alternative molecular formats and therapeutic applications for bispecific antibodies. Mol Immunol. 2015;67(2):95–25. doi:10.1016/j.molimm.2015.01.003. - DOI - PubMed
    1. Cho S-F, Yeh T-J, Anderson KC, Tai Y-T.. Bispecific antibodies in multiple myeloma treatment: a journey in progress. Front Oncol. 2022;12:1032775. doi:10.3389/fonc.2022.1032775. - DOI - PMC - PubMed
    1. Lancman G, Sastow DL, Cho HJ, Jagannath S, Madduri D, Parekh SS, Richard S, Richter J, Sanchez L, Chari A. Bispecific antibodies in multiple myeloma: present and future. Blood Cancer Discov. 2021;2(5):423–433. doi:10.1158/2643-3230.BCD-21-0028. - DOI - PMC - PubMed
    1. Labrijn AF, Janmaat ML, Reichert JM, Parren PWHI. Bispecific antibodies: a mechanistic review of the pipeline. Nat Rev Drug Discov. 2019;18(8):585–608. doi:10.1038/s41573-019-0028-1. - DOI - PubMed
    1. Wei J, Yang Y, Wang G, Liu M. Current landscape and future directions of bispecific antibodies in cancer immunotherapy. Front Immunol. 2022;13:1035276. doi:10.3389/fimmu.2022.1035276. - DOI - PMC - PubMed

MeSH terms

LinkOut - more resources