. 2025 Jan 30:14:e85999.
doi: 10.7554/eLife.85999.

A hierarchical pathway for assembly of the distal appendages that organize primary cilia

Affiliations

A hierarchical pathway for assembly of the distal appendages that organize primary cilia

Tomoharu Kanie et al. Elife. .

Abstract

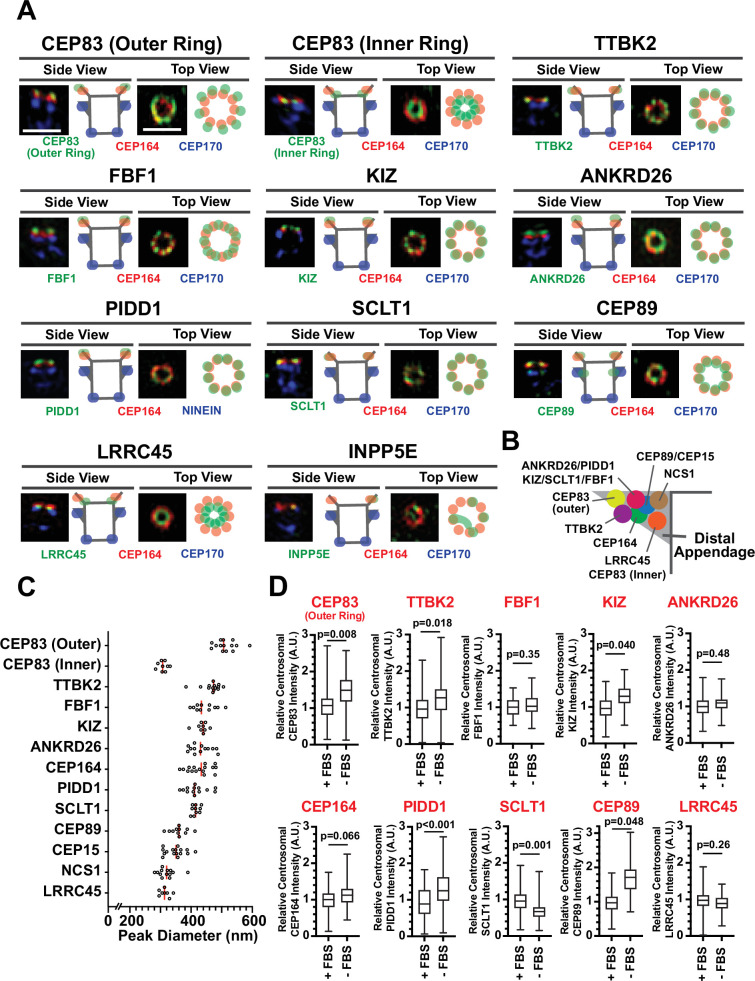
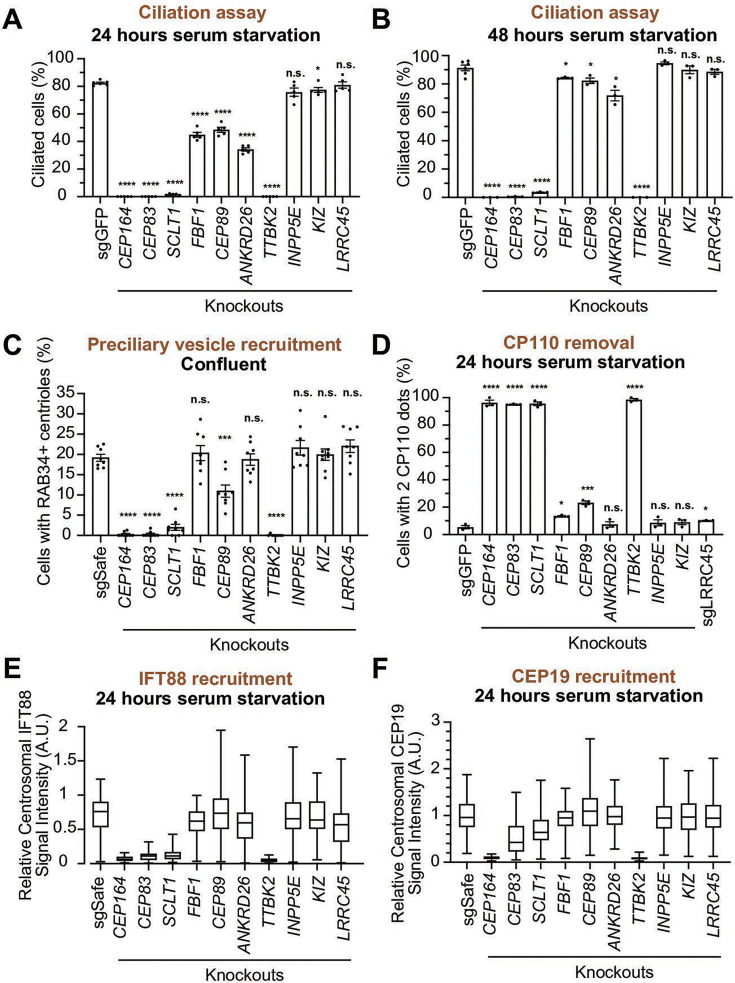
Distal appendages are ninefold symmetric blade-like structures attached to the distal end of the mother centriole. These structures are critical for the formation of the primary cilium, by regulating at least four critical steps: preciliary vesicle recruitment, recruitment and initiation of intraflagellar transport (IFT), and removal of CP110. While specific proteins that localize to the distal appendages have been identified, how exactly each protein functions to achieve the multiple roles of the distal appendages is poorly understood. Here, we comprehensively analyze known and newly discovered distal appendage proteins (CEP83, SCLT1, CEP164, TTBK2, FBF1, CEP89, KIZ, ANKRD26, PIDD1, LRRC45, NCS1, CEP15) for their precise localization, order of recruitment, and their roles in each step of cilia formation. Using CRISPR-Cas9 knockouts, we show that the order of the recruitment of the distal appendage proteins is highly interconnected and a more complex hierarchy. Our analysis highlights two protein modules, CEP83-SCLT1 and CEP164-TTBK2, as critical for structural assembly of distal appendages. Functional assays revealed that CEP89 selectively functions in the RAB34+ vesicle recruitment, while deletion of the integral components, CEP83-SCLT1-CEP164-TTBK2, severely compromised all four steps of cilium formation. Collectively, our analyses provide a more comprehensive view of the organization and the function of the distal appendage, paving the way for molecular understanding of ciliary assembly.

Keywords: cell biology; centrosome; cilia; ciliogenesis; distal appendage; human; super-resolution microscopy.


Conflict of interest statement

TK, BL, JL, SF, AG, PJ No competing interests declared

Figures

Figure 1.
Figure 1.. Mapping the localization of the distal appendage proteins.
(A) Retinal pigment epithelial (RPE) cells grown to confluent in FBS-containing media were fixed without serum starvation (for INPP5E), or after the serum starvation for 30 hr (CEP83) or 24 hr (all others). The fixed cells were stained with indicated antibodies and imaged via 3D structured illumination microscopy. Top or Side view pictures of the mother centriole are shown. The individual image is from a representative z-slice. The detailed staining and fixation condition is available in Figure 1—source data 1. Scale bar: 1 µm. (B) The location of each distal appendage protein on the side view of the distal appendage. The model was created from each side view shown in Figure 1A. (C) The peak-to-peak diameter of each distal appendage protein. Red bar indicates median diameter. The raw data is available in Figure 1—source data 2. (D) Quantification of centrosomal signal intensity of indicated distal appendage proteins. RPE cells were grown in FBS-containing media for 24 hr, and then grown in either FBS-containing media or serum free media for additional 24 hr (as shown in Figure 1—figure supplement 5A). Cells were fixed and stained with indicated antibodies. Centrosomal signal intensity of each marker was measured from fluorescent image with the method described in materials and methods. The data combined from three independent experiments. Statistical significance was calculated from nested t-test. The raw data, experimental condition, detailed statistics are available in Figure 1—source data 3.
Figure 1—figure supplement 1.
Figure 1—figure supplement 1.. Individual channels of the images shown in Figure 1A.
(A) 3D structured illumination images of indicated distal appendage proteins shown in Figure 1A shown in individual channels. Scale bar: 1 µm.
Figure 1—figure supplement 2.
Figure 1—figure supplement 2.. Characterization of the two CEP83 antibodies.
(A) A DNA sequencing alignment of isoform1 (identifier: Q9Y592-1) and isoform2 (identifier: Q9Y592-2) of human CEP83. The antigen of the antibody (a.a. 226–568 of the isoform 2) that recognizes the outer ring of CEP83 (cat#26013–1-AP, Proteintech) is shown in green. The antigen of the antibody (a.a. 578–677 of the isoform1) that recognizes the inner ring of CEP83 (cat#HPA0038161, SIGMA Aldrich) is shown in orange. (B) Immunoblot analysis of CEP83 in sgSafe (control) or CEP83 knockout RPE cells. The PVDF membrane detected with the antibody that recognizes the outer ring of CEP83 (cat#26013–1-AP, Proteintech) or the one that recognizes the inner ring of CEP83 (cat#HPA0038161, SIGMA Aldrich) is shown in left or right, respectively. Both antibodies specifically detect CEP83 at similar size (marked by red bar).
Figure 1—figure supplement 3.
Figure 1—figure supplement 3.. Structural model of CEP83.
(A) Structural models of CEP83 created by AlphaFold Protein Structure Database. CEP83 structures from the three different species (Homo sapiens, Mus Musculus, and Danio rerio) show extended alpha-helical structures as well as disordered regions at the N- and C- terminus of the protein.
Figure 1—figure supplement 4.
Figure 1—figure supplement 4.. Localization of N-terminally and C-terminally GFP tagged CEP83.
(A–H) Representative 3D structured illumination images of C-terminally (A and E) or N-terminally (C and G) GFP tagged CEP83, and the average peak-to-peak diameter of the ring visualized via top view (B, D, F, and H). Retinal pigment epithelial (RPE) cells stably expressing GFP tagged CEP83 were serum starved for 24 hr, fixed, stained with the indicated antibodies, and imaged via 3D structured illumination microscopy. Top or Side view pictures of the mother centrioles are shown. The individual image is from a representative z-slice. GFP fluorescence was detected using either polyclonal antibody (pAb) against GFP (A–D) or native GFP fluorescence (E–H). A black dot shown in the bar graph (B, D, F, and H) indicates the values from an individual mother centriole. Scale bar: 1 µm. Error bars represent ± SD. The raw data for the diameter measurement is available in Figure 1—figure supplement 4—source data 1.
Figure 1—figure supplement 5.
Figure 1—figure supplement 5.. Confirmation of experimental appropriateness of the data shown in Figure 1D.
(A) The graphical overview of the experimental method used in Figure 1D. (B) Quantification of the percentage of the ciliated cells in serum-fed (+FBS) or serum-starved (-FBS) retinal pigment epithelial (RPE) cells. Data obtained from three independent experiments. Each black dot indicates the data from an individual experiment. Error bars represent ± SEM. The raw data, experimental conditions, and detailed statistics are available in Figure 1—figure supplement 5—source data 1, Figure 5—figure supplement 1—source data 1. (C) Box plots showing the fluorescent intensity of centrosomal IFT88 in serum-fed (+FBS) or serum-starved (-FBS) RPE cells. The relative fluorescence signal intensity compared with the average of the serum-fed cells is shown. The data is combined from two independent experiments. The raw data and experimental conditions are available in Figure 1—figure supplement 5—source data 2.
Figure 2.
Figure 2.. The updated hierarchy of the distal appendage proteins.
(A–L) Box plots showing centrosomal signal intensity of indicated distal appendage proteins (A–K) and the subdistal appendage protein, CEP170 (L) in retinal pigment epithelial (RPE) cells (control or indicated knockouts) serum-starved for 24 hr (A, C–L) or without serum starvation (B). The relative fluorescence signal intensity compared with the average of the control is shown. The data from a representative experiment. Note that FBF1 signal remains in FBF1 knockout cells, and this issue is discussed in the main text. The raw data and experimental condition are available in Figure 2—source data 1, Figure 2—source data 2, Figure 2—source data 3,Figure 2—source data 4, Figure 2—source data 5, Figure 2—source data 6, Figure 2—source data 7, Figure 2—source data 8, Figure 2—source data 9, Figure 2—source data 10, Figure 2—source data 11 and Figure 2—source data 12. (M) The summary of the signal change in each marker in indicated knockout cells compared with a control. The summary concluded from at least two independent experiments. ↓, weakly reduced; ↓↓, moderately decreased; ↓↓↓, greatly decreased or absent; ↑, weakly increased; →, unaffected. The detailed relationship between CEP89-NCS1-CEP15 as well as localization of each distal appendage protein in NCS1 knockout cells are available in an accompanying paper (Kanie et al., 2025). (N) The updated hierarchy of the distal appendage proteins. A→B indicates that A is required for the centrosomal localization of B. CEP83 and SCLT1 are required for each other’s localization and are upstream of all the other distal appendage proteins. The outer ring, but not the inner ring, localization of CEP83 was affected by knockouts of several distal appendage proteins (ANKRD26, TTBK2, and CEP164).
Figure 2—figure supplement 1.
Figure 2—figure supplement 1.. Representative immunofluorescence images for the cells analyzed in Figure 2A–L.
The representative images of the cells analyzed in Figure 2. Retinal pigment epithelial (RPE) cells (control or indicated knockouts) without serum starvation (CEP83, inner) or serum-starved for 24 hr (the others) were stained with the indicated antibodies. Scale bar: 5 µm.
Figure 2—figure supplement 2.
Figure 2—figure supplement 2.. The expression level of distal appendage proteins in the individual distal appendage knockouts.
(A) Immunoblot (IB) analysis of indicated distal appendage proteins in indicated distal appendage knockout retinal pigment epithelial (RPE) cells grown to confluent (without serum starvation). The expression of distal appendage proteins is generally not affected by other distal appendage proteins except the dramatic reduction of Kizuna (KIZ) expression in SCLT1 knockout cells.
Figure 3.
Figure 3.. RAB34 is a marker for the centriole-associated vesicle.
(A) Retinal pigment epithelial (RPE) cells were grown in 10% FBS-containing media (serum-fed), fixed, stained with indicated antibodies, and imaged via wide-field microscopy. Arrows and arrowheads indicate RAB34/MYO5A negative or positive centrioles, respectively. Insets at the bottom right corner of each channel are the enlarged images of the smaller insets of each channel. Scale bar: 10 µm. (B–D) Quantification of the percentage of the centrioles positive for indicated markers in RPE cells grown in FBS-containing media (B) or in serum-free media for 3 (C) or 6 (D) hr. Data are averaged from three experiments. Error bars represent ± SEM. Key statistics are available in Figure 3—figure supplement 2. The raw data, sample numbers, experimental conditions, detailed statistics are available in Figure 3—source data 2, Figure 3—source data 3, and Figure 3—source data 4. (E–G) RPE cells were grown to confluent in 10% FBS-containing media (serum-fed), fixed, stained with indicated antibodies, and imaged via 3D structured illumination microscopy. Scale bar: 1 µm. (H–K) 3D super-resolution reconstructions and illustrations of RAB34 (magenta), MYO5A (green), and FOP (gray). (H) and (J) Experimental data shown for top and side views relative to the FOP ring-structure. Orientations in the microscope 3D space are indicated by the inset axes. (I) and (K) Corresponding schematics illustrating the data and highlighting the manner in which MYO5A is located at the edge of the RAB34 distribution. FOP is here visualized with ninefold symmetry. Arrows in the bottom panels indicate measurements of the distance of the RAB34 distribution from the mother centriole FOP structure. The schematics are not drawn to scale. Scale bar: 100 nm.
Figure 3—figure supplement 1.
Figure 3—figure supplement 1.. A potential problem of using MYO5A as a ciliary vesicle marker.
(A) Control (sgSafe) or CEP83 knockout retinal pigment epithelial (RPE) cells were grown to confluent in 10% FBS-containing media (serum-fed), fixed, stained with indicated antibodies, and imaged via a wide-field microscopy. Arrow and arrowheads indicate ciliary vesicle and pericentriolar non-ciliary vesicle staining, respectively. Scale bar: 10 µm. Pericentriolar staining observed in MYO5A staining is not evident in RAB34. The ciliary vesicle signal positive for MYO5A and RAB34 is not visible in CEP83 knockout cells, while the pericentriolar staining (arrowhead) persists in the knockout cells. (B–C) Control (sgGFP), RAB34 knockout, or MYO5A knockout RPE cells were grown to confluent in 10% FBS-containing media (serum-fed), fixed, stained with indicated antibodies, and imaged via a wide-field microscopy. Scale bar: 10 µm. RAB34 and MYO5A signals observed at the mother centrioles (marked by CEP164) and cytoplasm in the control cells are almost completely lost in the respective knockout cells, suggesting that both RAB34 and MYO5A localizes to the mother centrioles and cytoplasm.
Figure 3—figure supplement 2.
Figure 3—figure supplement 2.. RAB34 and MYO5A are recruited to the mother centriole earlier than EHD1 and PACSIN2.
(A) Quantification of the percentage of the centrioles positive for RAB34 in retinal pigment epithelial (RPE) cells grown to 40–50% confluency (subconfluent) or 100% confluency (confluent). The data are from two independent experiments. Error bars represent ± SD. (B–D) Key statistics of the data shown in Figure 3B–D. Statistical significance was calculated from two-way ANOVA with Tukey’s multiple comparisons test. Sample numbers and more detailed statistics are available in Figure 3—source data 2, Figure 3—source data 3. (E–H) Quantification of the percentage of mother centrioles positive for the indicated markers differently processed from the data shown in Figure 3B–D. Statistical significance was calculated from Tukey’s multiple comparisons test. Sample numbers and more detailed statistics are available in Figure 3—figure supplement 2—source data 2, Figure 3—figure supplement 2—source data 3, and Figure 3—figure supplement 2—source data 4. Error bars represent ± SEM.
Figure 3—figure supplement 3.
Figure 3—figure supplement 3.. 3D structured illumination images of RAB34 and MYO5A.
(A–B) 3D structured illumination images of indicated distal appendage proteins shown in Figure 3E and G shown in individual channels. Scale bar:1 µm.(C–E) Additional 3D structured illumination images of the mother centrioles stained with RAB34 and MYO5A. Scale bar: 1 µm. (F) 3D structured illumination image of indicated distal appendage proteins shown in Figure 3F shown in individual channels. Scale bar: 1 µm. (G–J) Additional 3D structured illumination top view image of the mother centrioles stained with RAB34 and CEP164. Scale bars: 1 µm. Confluent cells without serum starvation were analyzed.
Figure 3—figure supplement 4.
Figure 3—figure supplement 4.. Super-resolution reconstructions of RAB34 and MYO5A manually isolated from the data shown in Figure 3H and J with corresponding normalized histograms.
(A) and (C) Super-resolution reconstructions of the localizations of MYO5A (green) and RAB34 (magenta). (B) and (D) Normalized histograms of the RAB34 and MYO5A localizations shown in (A) and (C) along each axis with the direction specified by the double-sided arrow shown in (A) and (C).
Figure 3—figure supplement 5.
Figure 3—figure supplement 5.. Registration of the 3D single-molecule super-resolution data by imaging of FOP.
(A) and (B) 3D single-molecule data from Figure 3H and J showing FOP data from the two channels separately. The manually isolated localizations of CF568-labeled FOP (blue) and Alexa Fluor 647 (AF647)-labeled FOP (orange), shown for top and side views, along with CF568-labeled MYO5A (green) and AF647-labeled RAB34 (magenta) for the two samples. Orientations in the microscope 3D space are indicated by the inset axes. The opacities used for visualization in Vutara SRX are as follows: Sample 1, RAB34: 0.03, MYO5A: 0.08, FOP-CF568: 0.05, FOP-AF647: 0.05; sample 2, RAB34: 0.02, MYO5A: 0.09, FOP-CF568: 0.05, FOP-AF647: 0.05. (C–F) Example of reconstructions of the FOP ring structures in the two color channels after channel transformation and cross-correlation of FOP that is labeled in both channels. (C–D) Example of the AF647-labeled (magenta) and CF568-labeled (green) FOP structures at the mother and daughter centrioles used for cross-correlation. (E–F) The FOP structures from the two channels after channel transformation and data cross-correlation. The opacities for the visualization are set in Vutara SRX to 0.07 for AF647 FOP and 0.02 for CF568 FOP.
Figure 3—figure supplement 6.
Figure 3—figure supplement 6.. Control of the registration of the 3D single-molecule super-resolution data by imaging of RAB34.
(A) Super-resolution reconstructions from the localizations of CF568-labeled RAB34 and Alexa Fluor 647 (AF647)-labeled RAB34. The double-sided arrows specify the axes of the histograms shown in (B). (B) Offsets between the center of masses of CF568-labeled RAB34 and AF647-labeled RAB34 were found by fitting normalized histograms along each axis to Gaussian functions and calculating the difference between the two peaks. This was done in the x, y, and z directions before finding the total offset in 3D space. The offset between the localizations was found to be 20 nm in this sample, and there were 1705 localizations in the red channel and 1228 localizations in the green channel for RAB34. (C) Super-resolution reconstruction of RAB34 and FOP in both channels shown for top view (top) and side view (bottom) after channel registration. Visualizations were rendered in Vutara SRX as 3D Gaussians with 20 nm diameter. The opacities used for visualization are as follows: (A) RAB34-Alexa647: 0.06, RAB34-CF568: 0.06; (C) RAB34-AF647: 0.1, RAB34-CF568: 0.1, FOP-AF647: 0.05, FOP-CF568: 0.05.
Figure 3—figure supplement 7.
Figure 3—figure supplement 7.. Schematic of the optical setup used to collect 3D single-molecule super-resolution data.
Single fluorophores of CF568 and AF647 are excited by 560 nm and 642 nm lasers, respectively, using widefield epi-illumination. A 100 x objective lens serves for both illumination and collection of emitted light. A 4 f optical relay system is used to image the emitted light, which is split by a dichroic mirror into two emission paths. Transmissive phase masks in the Fourier plane of both paths modulate the emission light, thereby changing the shape of the point spread function (PSF) to that of the double helix PSF, which encodes the 3D position of the emitter. The two paths which are split in the 4 f system are imaged onto separate regions of an EMCCD camera. FOP is labeled with both dyes and is imaged in both channels, whereas MYO5A and RAB34 are labeled and imaged in channels 1 and 2, respectively, as indicated above. The inset shows the shape of the double helix PSF in both channels at different axial (z) positions. Scale bar is 1 µm. The schematic is not drawn to scale.
Figure 4.
Figure 4.. The distal appendage plays a role in preciliary vesicle recruitment, intraflagellar transport (IFT) recruitment, and CEP19 recruitment independently.
(A) Cilium formation assay in control (sgGFP), RAB34 knockout, or MYO5A knockout retinal pigment epithelial (RPE) cells serum starved for 24 hr. Data are averaged from three independent experiments, and each black dot indicates the value from an individual experiment. Error bars represent ± SEM. Statistics obtained through comparing between each knockout and control by Welch’s t-test. The raw data, experimental conditions, and detailed statistics are available in Figure 4—source data 1. (B) Transmission electron microscopy analysis of the mother centriole in control (sgGFP) or RAB34 knockout RPE cells serum starved for 3 hr. The representative images of the mother centrioles without (left) or with (right) a vesicle at the distal appendages are shown. (C) Quantification of the data shown in (B). The raw data and detailed statistics are available in Figure 4—source data 2. (D) CP110 removal assay in control (sgGFP), RAB34 knockout, or MYO5A knockout RPE cells serum starved for 24 hr. Data are averaged from three independent experiments, and each black dot indicates the value from an individual experiment. Error bars represent ± SEM. Statistics obtained through comparing between each knockout and control by Welch’s t-test. The raw data, experimental conditions, and detailed statistics are available in Figure 4—source data 3. (E–J) Box plots showing centrosomal signal intensity of IFT88 (E, G, and J), CEP19 (F and I), or IFT57 (H) in sgGFP control (E, F, I, and J), parental RPE-BFP-Cas9 control (G and H), indicated knockouts (E, F, I, and J), or RPE cells expressing sgIFT52 (G and H) serum starved for 24 hr. At least 40 cells were analyzed per each sample. The relative fluorescence signal intensity compared with the average of the control is shown. Data from a representative experiment are shown. The raw data and experimental conditions are available in Figure 4—source data 4,Figure 4—source data 5,Figure 4—source data 6,Figure 4—source data 7,Figure 4—source data 8 and Figure 4—source data 9. (K) Preciliary vesicle recruitment assay in control (sgSafe) or indicated knockout RPE cells grown to confluent (without serum starvation). At least 90 cells were analyzed per each sample. The data is averaged from five independent experiments. Error bars represent ± SEM. Statistics obtained through comparing between each knockout and control by Welch’s t-test. The raw data, experimental conditions, and detailed statistics are available in Figure 4—source data 10. (L) Summary of the role of the distal appendage. The distal appendage independently regulates IFT/CEP19 recruitment and preciliary vesicle recruitment, whereas CP110 removal is partially downstream of preciliary vesicle recruitment. A.U., arbitrary units; n.s., not significant; *p<0.05, **p<0.01, ***p<0.001.
Figure 4—figure supplement 1.
Figure 4—figure supplement 1.. Confirmation of MYO5A and RAB34 knockouts by immunoblot.
(A) Immunoblot (IB) analysis of MYO5A (IB: MYO5A) and RAB34 (IB: RAB34) in the single-cell clones of RAB34 or MYO5A knockout RPE cells. The cells were grown to confluent (without serum starvation), and analyzed by immunoblot. α-Tubulin (IB: Tubulin) serves as a loading control.
Figure 4—figure supplement 2.
Figure 4—figure supplement 2.. Characterization of IFT52 depleted cells.
(A) Immunoblot (IB) analysis of IFT52 in either control RPE-BFP-Cas9 or the cells stably expressing sgIFT52. The cells were grown to confluent (without serum starvation), lysed, and analyzed by immunoblot using indicated antibodies. α-Tubulin (IB: Tubulin) serves as a loading control. (B) Cilium formation assay in control (sgGFP), FOP knockout, or sgIFT52 expressing RPE cells serum starved for 24 hr. Data are averaged from three independent experiments, and each black dot indicates the value from an individual experiment. Error bars represent ± SEM. Statistics obtained through comparing between each knockout and control by Welch’s t-test. The raw data, experimental conditions, and detailed statistics are available in Figure 4—figure supplement 2—source data 3. (C–E) Box plots showing centrosomal signal intensity of IFT81 (C), TRAF3IP1 (D), or CLUAP1 (E) in control (RPE-BFP-Cas9) or retinal pigment epithelial (RPE) cells stably expressing sgIFT52. The relative fluorescence signal intensity compared with the average of the control is shown. At least 40 cells were analyzed per sample. The data from a representative experiment are shown. The raw data and experimental conditions are available in Figure 4—figure supplement 2—source data 4,Figure 4—figure supplement 2—source data 5 and Figure 4—figure supplement 2—source data 6. A.U., arbitrary units; n.s., not significant; *p<0.05, **p<0.01, ***p<0.001.
Figure 5.
Figure 5.. Functional analysis of distal appendage proteins reveals CEP89 as a protein important for preciliary vesicle recruitment.
(A–B) Cilium formation assay in control (sgGFP) and indicated knockout retinal pigment epithelial (RPE) cells serum starved for 24 hr (A) or 48 hr (B). Data are averaged from five (A) or three (B) independent experiments, and each black dot indicates the value from an individual experiment. Error bars represent ± SEM. Statistics obtained through comparing between each knockout and control by Welch’s t-test. The raw data, experimental conditions, and detailed statistics are available in Figure 5—source data 1 and Figure 5—source data 2. (C) Preciliary vesicle recruitment assay in control (sgSafe) or indicated knockout RPE cells grown to confluent (without serum starvation). The data are averaged from eight independent experiments. Error bars represent ± SEM. Statistics obtained through comparing between each knockout and control by Welch’s t-test. The raw data, experimental conditions, and detailed statistics are available in Figure 5—source data 3. (D) CP110 removal assay in control (sgGFP) and indicated knockout RPE cells serum starved for 24 hr. Data are averaged from three independent experiments, and each black dot indicates the value from an individual experiment. Error bars represent ± SEM. Statistics obtained through comparing between each knockout and control by Welch’s t-test. The raw data, experimental conditions, and detailed statistics are available in Figure 5—source data 4. (E–F) Box plots showing centrosomal signal intensity of IFT88 (E) or CEP19 (F) in control (sgSafe) and indicated knockout RPE cells serum starved for 24 hr. The relative fluorescence signal intensity compared with the average of the control is shown. The data from a representative experiment are shown. The raw data and experimental conditions are available in Figure 5—source data 5 and Figure 5—source data 6.A.U., arbitrary units; n.s., not significant; *p<0.05, **p<0.01, ***p<0.001.
Figure 5—figure supplement 1.
Figure 5—figure supplement 1.. ARL13B intensity was reduced in the various distal appendage knockouts.
(A–B) Cilium length in control (sgSafe or sgGFP) and indicated knockout retinal pigment epithelial (RPE) cells serum-starved for 24 hr (A) or 48 hr (B). The data from a representative experiment are shown. Each circle indicates the cilium length of the individual cells. Red bars indicate median value. Statistics obtained through comparing between each knockout and control by Welch’s t-test. The raw data, experimental conditions, and detailed statistics are available in Figure 5—figure supplement 1—source data 1 and Figure 5—figure supplement 1—source data 2. (C–D) Box plots showing ciliary signal intensity of ARL13B in control (sgSafe) and indicated knockout RPE cells serum starved for 24 hr (C) or 48 hr (D) The relative fluorescence signal intensity compared with the average of the control is shown. The data from three independent experiments are shown. Statistics obtained through comparing between each knockout and control by nested one-way ANOVA with Dunnett’s multiple comparisons test. The raw data and experimental conditions are available in Figure 5—figure supplement 1—source data 3 and Figure 5—figure supplement 1—source data 4. A.U., arbitrary units; n.s., not significant; *p<0.05, **p<0.01, ***p<0.001.
Figure 6.
Figure 6.. Model of the function of the distal appendage proteins.
(A) CEP83 appears to form an extended structure that spans from the innermost region to the outermost region of the distal appendage to serve as a scaffold for the other distal appendages. SCLT1 stabilizes CEP83 especially at the outer region of the protein, and the CEP83-SCLT1 module recruits all the other distal appendage proteins. TTBK2 together with its upstream protein, CEP164, confers structural integrity to the distal appendage by stabilizing outer region of CEP83, and the other downstream proteins (ANKRD26, FBF1, and NCS1). The efficient localization of CEP164 to the distal appendage also requires TTBK2. ANKRD26 plays an important role in maintaining stability of outer region of CEP83, and recruits PIDD1. Kizuna (KIZ) is recruited to the distal appendage likely via direct interaction with SCLT1, as SCLT1 strongly affects protein stability of KIZ (Figure 2—figure supplement 2). LRRC45 is recruited to the innermost region of the distal appendage. The distal appendage is indispensable for cilium biogenesis by independently regulating IFT recruitment, CEP19 recruitment, CP110 removal, and preciliary vesicle recruitment, while the CP110 removal is partially downstream of preciliary vesicle recruitment. The CEP164-TTBK2 module may be the most critical regulator of these processes. The CEP89-CEP15-NCS1 module is recruited to the inner region of the distal appendage and is primarily important for the recruitment of the preciliary vesicle (described in greater detail in Kanie et al., 2025 the accompanying paper). The red arrows indicate positive feedback; The blue arrows indicate functions achieved by the distal appendage; The dotted gray arrows indicate the recruitment of the proteins to the distal appendage.
Author response image 1.
Author response image 2.
Author response image 3.

Update of

References

    1. Acs P, Bauer PO, Mayer B, Bera T, Macallister R, Mezey E, Pastan I. A novel form of ciliopathy underlies hyperphagia and obesity in Ankrd26 knockout mice. Brain Structure & Function. 2015;220:1511–1528. doi: 10.1007/s00429-014-0741-9. - DOI - PMC - PubMed
    1. Ainavarapu SRK, Brujic J, Huang HH, Wiita AP, Lu H, Li L, Walther KA, Carrion-Vazquez M, Li H, Fernandez JM. Contour length and refolding rate of a small protein controlled by engineered disulfide bonds. Biophysical Journal. 2007;92:225–233. doi: 10.1529/biophysj.106.091561. - DOI - PMC - PubMed
    1. Anderson RG, Brenner RM. The formation of basal bodies (centrioles) in the Rhesus monkey oviduct. The Journal of Cell Biology. 1971;50:10–34. doi: 10.1083/jcb.50.1.10. - DOI - PMC - PubMed
    1. Anderson RG. The three-dimensional structure of the basal body from the rhesus monkey oviduct. The Journal of Cell Biology. 1972;54:246–265. doi: 10.1083/jcb.54.2.246. - DOI - PMC - PubMed
    1. Bayas C, Diezmann AV, Gustavsson AK, Moerner WE. Easy-DHPSF 2.0: open-source software for three-dimensional localization and two-color registration of single molecules with nanoscale accuracy. Protocol Exchange. 2019;01:e9151/v1. doi: 10.21203/rs.2.9151/v1. - DOI

LinkOut - more resources