. 2025 Jan 30;135(6):e176865.
doi: 10.1172/JCI176865.

Monocytes and interstitial macrophages contribute to hypoxic pulmonary hypertension

Affiliations

Monocytes and interstitial macrophages contribute to hypoxic pulmonary hypertension

Rahul Kumar et al. J Clin Invest. .

Abstract

Hypoxia is a major cause of pulmonary hypertension (PH) worldwide, and it is likely that interstitial pulmonary macrophages contribute to this vascular pathology. We observed in hypoxia-exposed mice an increase in resident interstitial macrophages, which expanded through proliferation and expressed the monocyte recruitment ligand CCL2. We also observed an increase in CCR2+ macrophages through recruitment, which express the protein thrombospondin-1, which functionally activates TGF-β to cause vascular disease. Blockade of monocyte recruitment with either CCL2-neutralizing antibody treatment or CCR2 deficiency in the bone marrow compartment suppressed hypoxic PH. These data were supported by analysis of plasma samples from humans who traveled from low (225 m) to high (3500 m) elevation, revealing an increase in thrombospondin-1 and TGF-β expression following ascent, which was blocked by dexamethasone prophylaxis. In the hypoxic mouse model, dexamethasone prophylaxis recapitulated these findings by mechanistically suppressing CCL2 expression and CCR2+ monocyte recruitment. These data suggest a pathologic cross talk between 2 discrete interstitial macrophage populations, which can be therapeutically targeted.

Keywords: Chemokines; Hypoxia; Inflammation; Monocytes; Vascular biology.


Conflict of interest statement

Conflict of interest: The authors have declared that no conflict of interest exists.

Figures

Figure 1
Figure 1. Exposure to high altitude results in PH and increased secretion of inflammatory classical monocyte ligands from the lungs.
(A) Schematic showing hypoxia exposure time course in WT mice. Duration of hypoxia exposure is directly proportional to (B) RVSP and RV hypertrophy as measured by Fulton Index (n = 6–13/group). At 3 days of hypoxia, increased protein expression of classical monocyte ligands (C) CCL2 (n = 6–11/group) and (D) CCL12 (n = 6–11/group), whereas significantly lower levels of nonclassical monocyte ligand (E) CX3CL1 (n = 6/group) in the lungs. (F) Higher CCL2 gradient in lungs and in the (G) peripheral blood of WT mice following 3 days of hypoxia exposure (n = 5/group). Data in all panels were obtained from female mice. Statistical analysis was conducted using ANOVA, followed by Tukey’s post hoc test. *P < 0.05, **P < 0.01, ****P < 0.0001. n = number of animals, mean ± SD; CI, confidence interval.
Figure 2
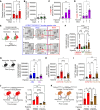
Figure 2. Classical monocytes serve as a precursor of inflammatory IMs following hypoxia exposure.
Time course–based flow cytometry analysis showed increased numbers of (A) classical and (B) nonclassical monocytes in circulation and (C) recruitment of IMs with (D) higher proliferation after 3 days of hypoxia in lungs (n = 6/group; all female mice). (E) Double reporter (Ccr2RFPCx3cr1GFP) mice flow cytometry revealed extravascular IMs subsets: RFP+ (recent recruitment from the circulatory CCR2+ monocytes) and another RFP GFP+ resident (FOLR2+) IMs (representative image of n = 12–13/group). (F) Quantitative analysis showed significant increases in CCR2+ IMs and FOLR2+ resident IMs following hypoxia exposure (n = 13 in Nx; 8 female, 5 male; n = 12 in Hx, 8 female, 4 male). (G) WT mice flow cytometry showed elevated total IMs after hypoxia (n = 7/group; all female mice). (H) Both CCR2+ IMs and FOLR2+ resident IMs increased significantly following hypoxia exposure (n = 7/group; all female mice). (I) FOLR2+ IMs were highly positive for the proliferation marker Ki-67 after hypoxia exposure (n = 7/group; all female mice). (J) Ccr2ERT2–Cre x R26Stop(fl/fl)tdTomato lineage tracing system efficiently labeled CCR2+ IMs with tdT in hypoxia compared with FOLR2+ IMs following tamoxifen injection (n = 4/group; 2 male, 2 female in Nx; 2 male, 2 female in Hx group). (K) Cx3cr1ERT2–Cre x R26Stop(fl/fl)tdTomato lineage tracing system efficiently marks resident FOLR2+ IMs with tdTomato (tdT); circulatory CCR2+ monocytes also showed slightly higher tdT+ labeled in hypoxia compared with normoxia (n = 4–5/group; 2 male, 2 female in Nx; 2 male and 3 female in Hx group). ANOVA followed by Tukey’s post hoc test was conducted for Panels A, B, F, J, and K. Kruskal-Wallis ANOVA followed by Dunn’s post hoc test was used for panels C, D, and GI. mean ± SD plotted. #P < 0.05, **P < 0.01, ***P < 0.001, ****P < 0.0001. n, number of animals; NC, nonclassical; Nos., number; IMs, interstitial macrophages.
Figure 3
Figure 3. Higher number and increased proliferation of classical monocytes and their precursors in BM following hypoxia exposure.
(A) Schematic showing myeloid progenitor phylogeny in the BM compartment. Hypoxia exposure leads to (B) a higher number and (C) a trend toward higher proliferation of MDPs (n = 6–12/group). Hypoxia results in (D) a higher number (n = 6–12/group) and (E) increased proliferation of cMoP in the BM compartment (n = 6–12/group). There was (F) no difference in number (n = 6–12/group) but (G) higher proliferation of classical monocytes (n = 6–12/group) following 3 days of hypoxia exposure. There was a (H) higher number (n = 6–12/group), with no change in the (I) proliferation of nonclassical monocytes in hypoxia (n = 6–12/group). For all panels, data were not normally distributed. Therefore, the Kruskal-Wallis ANOVA test, followed by Dunn’s post hoc test was used. Data were obtained from the female mice. mean ± SD plotted. *P < 0.05, **P < 0.01. n, number of animals; HSC, hematopoietic stem cells; MDP, monocytes dendritic cells progenitor; cMoP, common monocytes progenitor cells; Mo, monocytes, MΦ, macrophages, BM, bone marrow.
Figure 4
Figure 4. Genetic and pharmacologic blockade of CCR2-CCL2 axis protects from hypoxic PH.
(A) Schematic showing the BM reconstitution of Ccr2–/– and WT BM into lethally irradiated WT mice. WT mice reconstituted with Ccr2–/– BM were protected from hypoxic PH by attenuated (B) RVSP (n = 7–11/group) and (C) RV hypertrophy (n = 7–11/group) as measured by Fulton Index, compared with WT mice that were reconstituted with WT BM. (D) Schematic showing pharmacological blockade of CCR2 ligands CCL2 or CCL7 using anti-CCL2 or anti-CCL7 neutralizing antibody treatment. Hypoxia-exposed WT mice treated with CCL2 NAb but not CCL7 NAb showed lower (E) RVSP (n = 6/group) and (F) RV hypertrophy (n = 6/group). TSP-1 levels in (G) lungs (n = 6/group) and (H) blood (n = 6/group); and TGF-β1 levels in (I) lungs (n = 6/group) and (J) blood (n = 6/group) compared with WT mice treated with isotype control antibody. Data in all panels followed a normal distribution. ANOVA with the Tukey test was performed for multiple comparisons. Data were obtained from the female mice. mean ± SD plotted. *P < 0.05, **P < 0.01, ***P < 0.001, ****P < 0.0001. n, number of animals; TSP-1, thrombospondin-1; TGF-β1, transforming growth factor-1; IMs, Interstitial macrophages; Ab, antibody; Nab, neutralizing antibody.
Figure 5
Figure 5. Resident IMs are a major source of CCL2 and recruited IMs are a major source of pathologic TSP-1 in hypoxic PH.
(A) Flow cytometry analysis using Ccl2RFP–fl reporter mice showed a higher number of CCL2+ IMs (n = 14/group; n = 14/group, 9 female and 5 male in Nx; 8 female and 6 male in Hx), and (B) FOLR2+ IMs are a major source of CCL2 (n = 14/group). (C) Hypoxia-exposed WT mice following intracellular CCL2 staining by flow cytometry also showed a higher number of CCL2+ IMs (n = 7/group, female mice). (D). IM subpopulation analysis using flow cytometry also showed FOLR2+ resident IMs are a major source of CCL2 (n = 7/group, female mice). (E) Schematic of Tamoxifen-induced ablation of CCL2 FOLR2+ IMs using cre-lox system. Deletion of both copies of the Ccl2 in Cx3cr1-expressing FOLR2 IMs showed blunted (F) RVSP and (G) Fulton Index following hypoxia exposure (n = 4–7/ mice group with 3 female, 2 male (WT/WT); 3 female, 4 male (WT/Fl) and 2 female, 2 male (fl/fl). (H) Intracellular TSP-1 staining using flow cytometry revealed recruited a higher number of TSP-1+ IMs (n = 7/group; female mice), and further analysis showed (I) CCR2+ IMs are a major source of TSP-1 in hypoxic PH (n = 7/group, female mice).ANOVA followed by Tukey’s post hoc test was conducted for Panels C, D, G, and H. Kruskal-Wallis ANOVA followed by Dunn’s post hoc test was used for panels A, B, F, and I. mean ± SD plotted. *P < 0.05, **P < 0.01, ***P < 0.001, ****P < 0.0001. Nx, Normoxia; Hx, hypoxia; IMs, Interstitial macrophages.
Figure 6
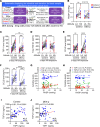
Figure 6. DEX prophylaxis in humans to travel to high elevation suppresses inflammatory proteins in the blood.
(A) Schematic reviewing the study design, in which 27 individuals from cohort-1 and 40 individuals from cohort-2 were flown from LA to HA. Individuals in the control group were not treated, whereas individuals in the DEX-P group were treated with 4 mg oral twice-daily DEX prophylaxis starting 1 day prior to travel, in an unblinded manner. Blood samples were drawn before (at LA) and after 3 days of HA exposure (at HA). Samples from both cohort-1 and cohort-2 were combined and analyzed together to increase statistical power. (B) Paired ECHO analysis showed higher RVSP 3 days after exposure to HA, and DEX prophylactic treatment showed a mild trend toward lowering RVSP in both cohorts. This clinical data of cohort-1 was previously published (47) and is reproduced here. HA exposure resulted in higher levels of (C) TSP-1 and (D) TGF-β1, while DEX prophylaxis blunted TSP-1 (C) and TGF-β1 (D) after 3 days at HA. DEX prophylaxis showed (E) no effect on blood CCL2 expression at HA day 3, but (F) significantly lowered CCL2 at HA day 1. There was a significant correlation of (G) RVSP with the cytokines TSP-1 and, mildly, with TGF-β1, as well as between (H) TSP-1 and TGF-β1 in the untreated participants. (I) DEX prophylaxis abrogated the (I) RVSP-cytokine and (J) TSP-1—TGF-β1 correlations. Paired t tests were performed within the individuals of the same group, while unpaired t tests were performed between control and DEX-p HA-exposed individuals. **P < 0.01, ***P < 0.001, ****P < 0.0001.
Figure 7
Figure 7. DEX prophylaxis protects from hypoxic PH by blocking inflammatory cytokines both in the lungs and in circulation.
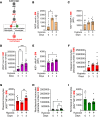
(A) Schematic showing the experimental design and the dosing of DEX prophylaxis. Hypoxia-exposed WT mice treated with DEX prophylaxis had lower (B) RVSP and RVH by RHC (n = 13–16/group). The blood (C) TSP-1 (n = 5–11/group) and (D) TGF-β1 (n = 5–9/group) levels were blunted by DEX prophylaxis treatment in hypoxic PH. The blood monocytes ligands (E) CCL2 (n = 11/group) was significantly upregulated whereas (F) CCL12 (n = 11/group) was downregulated following hypoxia exposure in the DEX prophylactically treated group. The levels of inflammatory proteins (G) TSP-1 (n = 11/group) and (H) TGF-β1 (n = 5–9/group) were significantly lower in the lung WT mice treated with DEX prophylaxis. DEX prophylaxis blunted classical monocyte ligands (I) CCL2 (n = 11/group) and (J) CCL12 (n = 11/group) in lung tissue lysates by ELISA. Data in all panels were obtained from female mice and followed a normal distribution. Statistical analysis was conducted using ANOVA, followed by Tukey’s post hoc test. mean ± SD plotted. *P < 0.05, **P < 0.01, ***P < 0.001, ****P < 0.0001. RVSP, right ventricular systolic pressure; RV, right ventricle; IMs, interstitial macrophages; DEX, Dexamethasone.
Figure 8
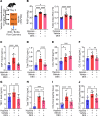
Figure 8. DEX prophylaxis blunts CCL2 production by resident IMs and blocks the recruitment of TSP-1–producing CCR2+ IMs in hypoxia.
(A) DEX prophylactically treated, hypoxia-exposed Ccl2RFP–fl reporter mice exhibited a significant reduction in CCL2+ IMs, particularly in (B) CCL2RFP+ resident IMs (n = 7/group). Additionally, (C) intracellular CCL2 flow cytometry analysis in DEX prophylactically treated hypoxia-exposed WT mice revealed a decrease in CCL2 expressing FOLR2+ resident IMs (n = 7/group, female mice). (D) qPCR on flow-sorted FOLR+ IM from DEX-prophylactically treated hypoxia-exposed WT mice showed lower Ccl2 expression. (E) DEX prophylaxis attenuated the TSP-1 expressing CCR2+ IMs in hypoxia (n = 7/group, female mice). (F) qPCR on flow-sorted CCR2+ IM from DEX prophylactically treated hypoxia-exposed WT mice showed lower Thbs1 expression (n = 5/group, female mice). (G) Double-reporter mice displayed a marked reduction in RFP+ IMs and resident IMs in the hypoxia-exposed DEX prophylatically treated group (n = 9/group; 4 female, 5 male in vehicle; 5 female, 4 male in DEX group). Moreover, DEX prophylaxis further decreased (H) total IMs (n = 7/group, female mice) by abrogating the recruitment of (I) CCR2+ IMs and reducing the number of FOLR2+ IMs (n = 7/group, female mice) via (J) blocking proliferation, as indicated by Ki-67 expression (n = 7–13/group, female mice). Statistical analysis was conducted using ANOVA, followed by Tukey’s post hoc test for all the panels except panel J. Kruskal-Wallis ANOVA followed by Dunn’s post hoc test was used for panel J. mean ± SD plotted. *P < 0.05, **P < 0.01, ***P < 0.001, ****P < 0.0001.

Comment in

  • Macrophages: Key conductors behind perivascular inflammation and vascular remodeling in hypoxia induced pulmonary hypertension

References

    1. Simonneau G, et al. Updated clinical classification of pulmonary hypertension. J Am Coll Cardiol. 2013;62(25 suppl):D34–D41. doi: 10.1016/j.jacc.2013.10.029. - DOI - PubMed
    1. Frid MG, et al. Hypoxia-induced pulmonary vascular remodeling requires recruitment of circulating mesenchymal precursors of a monocyte/macrophage lineage. Am J Pathol. 2006;168(2):659–669. doi: 10.2353/ajpath.2006.050599. - DOI - PMC - PubMed
    1. Pugliese SC, et al. A time- and compartment-specific activation of lung macrophages in hypoxic pulmonary hypertension. J Immunol. 2017;198(12):4802–4812. doi: 10.4049/jimmunol.1601692. - DOI - PMC - PubMed
    1. D’Alessandro A, et al. Hallmarks of pulmonary hypertension: mesenchymal and inflammatory cell metabolic reprogramming. Antioxid Redox Signal. 2018;28(3):230–250. doi: 10.1089/ars.2017.7217. - DOI - PMC - PubMed
    1. Stenmark KR, et al. Metabolic reprogramming and inflammation act in concert to control vascular remodeling in hypoxic pulmonary hypertension. J Appl Physiol (1985) 2015;119(10):1164–1172. doi: 10.1152/japplphysiol.00283.2015. - DOI - PMC - PubMed

MeSH terms