. 2025 Jan 30;10(5):e180226.
doi: 10.1172/jci.insight.180226.

Characterization of cognitive decline in long-duration type 1 diabetes by cognitive, neuroimaging, and pathological examinations

Affiliations

Characterization of cognitive decline in long-duration type 1 diabetes by cognitive, neuroimaging, and pathological examinations

Hetal S Shah et al. JCI Insight. .

Abstract

BACKGROUNDWe aimed to characterize factors associated with the under-studied complication of cognitive decline in aging people with long-duration type 1 diabetes (T1D).METHODSJoslin "Medalists" (n = 222; T1D ≥ 50 years) underwent cognitive testing. Medalists (n = 52) and age-matched nondiabetic controls (n = 20) underwent neuro- and retinal imaging. Brain pathology (n = 26) was examined. Relationships among clinical, cognitive, and neuroimaging parameters were evaluated.RESULTSCompared with controls, Medalists had worse psychomotor function and recall, which associated with female sex, lower visual acuity, reduced physical activity, longer diabetes duration, and higher inflammatory cytokines. On neuroimaging, compared with controls, Medalists had significantly lower total and regional brain volumes, equivalent to 9 years of accelerated aging, but small vessel disease markers did not differ. Reduced brain volumes associated with female sex, reduced psychomotor function, worse visual acuity, longer diabetes duration, and higher inflammation, but not with glycemic control. Worse cognitive function, lower brain volumes, and diabetic retinopathy correlated with thinning of the outer retinal nuclear layer. Worse baseline visual acuity associated with declining psychomotor function in longitudinal analysis. Brain volume mediated the association between visual acuity and psychomotor function by 57%. Brain pathologies showed decreased volumes, but predominantly mild vascular or Alzheimer's-related pathology.CONCLUSION To our knowledge, this is the first comprehensive study of cognitive function, neuroimaging, and pathology in aging T1D individuals demonstrated that cognitive decline was related to parenchymal rather than neurovascular abnormalities, unlike type 2 diabetes, suggestive of accelerated aging in T1D. Improving visual acuity could perhaps be an important preventive measure against cognitive decline in people with T1D.FUNDINGThe Beatson Foundation, NIH/NIDDK grants 3P30DK036836-34S1 and P30DK036836-37, and Mary Iacocca fellowships.

Keywords: Aging; Dementia; Diabetes; Endocrinology.


Conflict of interest statement

Conflict of interest: The authors have declared that no conflict of interest exists.

Figures

Figure 1
Figure 1. Associations of clinical characteristics with cognitive function in T1D (n = 222).
Heatmaps showing bivariate standardized estimates of associations between clinical characters as independent variables and cognitive function domains as dependent variables in linear regression models. The estimates represent changes in cognitive function per 1 SD change in the clinical predictor. Color and intensity represent the strength and direction (positive, zero or no, and negative) of association. Better cognitive function is represented by more blue estimates, and worse by red. MIS, memory index score. Blank squares not significant. *P < 0.05, **P < 0.01, ***P < 0.0001. (A) Markers of sociodemographics and lifestyle. (B) Glycemic markers. Life.Hypog, lifetime hypoglycemia severity; CV, coefficient of variation of glucose on CGM; TAR>250, time above range of glucose > 250 mg/dL; TIR 70–180, time-in-range 70–180 mg/dL; TBR<70, time below range of glucose < 70 mg/dL; CEL, CML, and MGH1 are advanced glycation end products. (C) Cardiometabolic markers. DBP and SBP, diastolic and systolic blood pressure; CRP, C-reactive protein; IL, interleukin; IFN-γ, interferon γ; TNF-α, tumor necrosis factor α. (D) Insulin resistance markers. BMI, body mass index; eGDR, estimated glucose disposal rate; eIS, estimated insulin sensitivity; VAI, visceral adiposity index; TG:HDL, triglyceride/HDL ratio; WHR, waist/hip ratio. (E) Complications. ACR, urine albumin/creatinine ratio; eGFR, estimated glomerular filtration rate; D and ND, dominant and nondominant hands; DN, diabetic nephropathy; RHA, reduced hypoglycemia awareness; DPN, diabetic peripheral neuropathy; AN, autonomic neuropathy; CVD, cardiovascular disease; CAC, coronary artery calcification; VA, visual acuity; PDR, proliferative diabetic retinopathy.
Figure 2
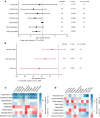
Figure 2. Brain structure and cognitive function in Medalists (T1D, n = 52) versus nondiabetic controls (NDM, n = 20).
(A and B) Differences in brain volumes between T1D and NDM. Forest plots showing β estimates and 95% confidence intervals from linear regression associations between regional (A) and total (B) brain volumes and case (T1D) versus control (NDM) status, adjusted by intracranial volumes. Eq.yrs of age, equivalent years of aging of T1D brain compared to NDM; Alz.Ds.Sig., Alzheimer’s disease signature region. (C and D) Associations between brain volumes and cognitive function. Heatmaps showing bivariate standardized estimates of associations between brain volumes and cognitive function in T1D (C) and NDM controls from linear regression models (D). Better cognitive function is represented by more blue estimates, and worse cognitive function by red. D and ND, dominant and nondominant hands; MIS, memory index score; Deep GM, deep gray matter. Blank squares not significant. *P < 0.05, **P < 0.01, ***P < 0.0001.
Figure 3
Figure 3. Associations of clinical characteristics with brain volumes in T1D (n = 52).
Heatmaps showing bivariate standardized estimates of associations between clinical characters as independent variables and brain volumes as dependent variables from linear regression models. The estimates represent changes in brain volume per 1 SD change in the clinical predictor. Color and intensity represent the strength and direction (positive, zero or no, and negative) of association. Higher brain volume is represented by more blue estimates, and lower by red. Blank squares not significant. *P < 0.05, **P < 0.01, ***P < 0.0001. (A) Markers of sociodemographics and lifestyle. (B) Glycemic markers. Life.Hypog, lifetime hypoglycemia severity; CV, coefficient of variation of glucose on CGM; TAR>250, time above range of glucose > 250 mg/dL; TIR 70–180, time-in-range 70–180 mg/dL; TBR<70, time below range of glucose <70 mg/dL; CEL, CML, and MGH1 are advanced glycation end products. (C) Cardiometabolic markers. DBP and SBP, diastolic and systolic blood pressure; CRP, C-reactive protein; IL, interleukin; IFN-γ, interferon γ; TNF-α, tumor necrosis factor α. (D) Insulin resistance markers. BMI, body mass index; eGDR, estimated glucose disposal rate; eIS, estimated insulin sensitivity; VAI, visceral adiposity index; TG:HDL, triglyceride/HDL ratio; WHR,waist/hip ratio. (E) Complications. ACR, urine albumin/creatinine ratio; eGFR,estimated glomerular filtration rate; DN, diabetic nephropathy; RHA, reduced hypoglycemia awareness; DPN, diabetic peripheral neuropathy; AN, autonomic neuropathy; CVD, cardiovascular disease; CAC, coronary artery calcification; VA, visual acuity; PDR, proliferative diabetic retinopathy.
Figure 4
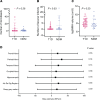
Figure 4. Vascular imaging in Medalists (T1D, n = 52) versus nondiabetic (NDM, n = 20) controls.
Differences between T1D and NDM for counts of microbleeds (A) and lacunar infarcts (B), volume of white matter hyperintensities (WMHs) (C) and regional cerebral perfusion (D). Dot plots show mean ±SD. Mann-Whitney U tests were used to test for significant differences in microbleeds and lacunar infarcts. WMH volumes were log-normalized and then differences were examined by Student’s t test. Linear regression models tested for relationship between cerebral perfusion and case-control status; β estimates and 95% confidence intervals are shown in the forest plot.
Figure 5
Figure 5. Gross and histopathological exams of 26 brains from T1D Medalists.
(A) Causes of death among 26 brain donors. CVD, cardiovascular disease. (B) Distribution of brain weights in Medalists. Data are presented as mean ± SD. (C) Comparison of mean (±SD) brain weights for T1D Medalists (n = 19 males and 7 females) compared to summary data from normal referenced aging population (n = 546 males and 465 females). *P < 0.05, ***P < 0.0001 from standardized t tests. (D) Arteriolosclerosis and Alzheimer’s pathology. Hematoxylin and eosin (H&E) staining of normal vessel with thin wall (upper left, arrow), mild arteriolosclerosis with thickening of vessel wall and widened perivascular space (upper middle), and moderate-to-severe arteriolosclerosis with thickened vessel wall and surrounding parenchymal damage (upper right). Scale bar: 50 μm. Immunohistochemistry (IHC) staining of amyloid plaque (lower left, arrow), neurofibrillary tangle (lower middle, arrow), and vessel involved by cerebral amyloid angiopathy (lower right, arrow). (E) Summary of brain gross and histopathological exams (n = 26).
Figure 6
Figure 6. Relationships between outer nuclear layer (ONL) thickness, visual acuity, and brain volumes in T1D (n = 52).
(A) ONL thickness and brain volumes in T1D. Linear regression β estimates and 95% confidence intervals shown in forest plot. Alz.Ds.Sig., Alzheimer’s disease signature region; Deep_GM, deep gray matter. (B and C) Mediation analysis. Estimating how much of the association between visual acuity (B) or ONL thickness (C) and brain volume is mediated by psychomotor function. Each arrow represents a linear regression model with the dependent variable at the arrowhead and the independent variable at the arrow base. βobs, observed β; βexp, expected β; SE, standard error of the mean.

References

    1. CDC. National Diabetes Statistics Report, 2020. https://www.cdc.gov/diabetes/php/data-research/index.html Accessed January 27, 2024.
    1. Biessels GJ, et al. Risk of dementia in diabetes mellitus: a systematic review. Lancet Neurol. 2006;5(1):64–74. doi: 10.1016/S1474-4422(05)70284-2. - DOI - PubMed
    1. Gudala K, et al. Diabetes mellitus and risk of dementia: a meta-analysis of prospective observational studies. J Diabetes Investig. 2013;4(6):640–650. doi: 10.1111/jdi.12087. - DOI - PMC - PubMed
    1. American Diabetes Association. Economic costs of diabetes in the U.S. in 2012. Diabetes Care. 2013;36(4):1033–1046. doi: 10.2337/dc12-2625. - DOI - PMC - PubMed
    1. Munshi MN. Cognitive dysfunction in older adults with diabetes: what a clinician needs to know. Diabetes Care. 2017;40(4):461–467. doi: 10.2337/dc16-1229. - DOI - PubMed