. 2025 Jan 30;135(7):e187024.
doi: 10.1172/JCI187024.

Elevated protein lactylation promotes immunosuppressive microenvironment and therapeutic resistance in pancreatic ductal adenocarcinoma

Affiliations

Elevated protein lactylation promotes immunosuppressive microenvironment and therapeutic resistance in pancreatic ductal adenocarcinoma

Kang Sun et al. J Clin Invest. .

Abstract

Metabolic reprogramming shapes the tumor microenvironment (TME) and may lead to immunotherapy resistance in pancreatic ductal adenocarcinoma (PDAC). Elucidating the impact of pancreatic cancer cell metabolism in the TME is essential to therapeutic interventions. "Immune cold" PDAC is characterized by elevated lactate levels resulting from tumor cell metabolism, abundance of protumor macrophages, and reduced cytotoxic T cells in the TME. Analysis of fluorine-18 fluorodeoxyglucose (18F-FDG) uptake in patients showed that increased global protein lactylation in PDAC correlates with worse clinical outcomes in immunotherapy. Inhibition of lactate production in pancreatic tumors via glycolysis or mutant-KRAS inhibition reshaped the TME, thereby increasing their sensitivity to immune checkpoint blockade (ICB) therapy. In pancreatic tumor cells, lactate induces K63 lactylation of endosulfine α (ENSA-K63la), a crucial step that triggers STAT3/CCL2 signaling. Consequently, elevated CCL2 secreted by tumor cells facilitates tumor-associated macrophage (TAM) recruitment to the TME. High levels of lactate also drive transcriptional reprogramming in TAMs via ENSA-STAT3 signaling, promoting an immunosuppressive environment. Targeting ENSA-K63la or CCL2 enhances the efficacy of ICB therapy in murine and humanized pancreatic tumor models. In conclusion, elevated lactylation reshapes the TME and promotes immunotherapy resistance in PDAC. A therapeutic approach targeting ENSA-K63la or CCL2 has shown promise in sensitizing pancreatic cancer immunotherapy.

Keywords: Cancer; Cancer immunotherapy; Immunology; Macrophages; Oncology.


Figures
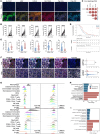
Figure 1
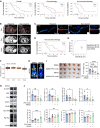
Figure 1. Elevated lactylation is correlated with immunosuppressive TME in PDAC.
(A) Representative images of mIHC staining in paracancerous (Para) and tumor tissues. Paracancerous and tumor tissues on tissue microarray were stained. Scale bar: 0.1 cm. (B) Expression differences of indicated genes between paracancerous and tumor tissues. Histochemistry score (h-score) was used to measure the expression of these genes in each region. Intact tissues were included in follow-up analysis. Statistical analyses were performed with the paired sample t test (41 pairs). (C) Correlation analysis between SLC2A1, HK2, LDHA, SLC16A3, and Pan-Kla levels. Forty-one pairs of paracancerous and tumor tissues were included in the analysis. H-score was used to measure the expression of these genes in each region and then perform Pearson’s correlation analysis (n = 82). (D) Kaplan-Meier survival curves of overall survival (OS) for patients with PDAC in an in-house TMA. TMAs were stained using anti–Pan-Kla antibodies. Patients were divided into 2 groups according to median amount of h-score. Intact tumor tissues with survival data were included in follow-up analysis. Statistical analyses were performed with log-rank test (n = 116). (E) Twenty fresh pancreatic tumor samples were processed into a single-cell suspension and flow cytometry was performed using Cytek. Samples were divided into 2 groups according to Pan-Kla expression. Statistical analyses were performed with Student’s t test (n = 20). (F) Representative images and statistical chart of mIHC staining of pancreatic cancer samples. TMAs of 140 pancreatic cancer samples were stained. Intact tissues were included in follow-up analysis. Samples were divided into 2 groups according to h-score of Pan-Kla. Proportion of each cell type in total cells was calculated. Statistical analyses were performed with Student’s t test (n = 140). Scale bar: 0.1 cm. (G) Pan-Kla expression and 2-NBDG uptake tested using flow cytometry by each cell type in human paired tumors and peripheral blood. (H and I) Gene ontology enrichment analysis of macrophages (H) and CD8+ T cells (I). *P < 0.05; **P < 0.01; ****P < 0.0001.
Figure 2
Figure 2. Elevated lactylation is associated with immunotherapy resistance in PDAC.
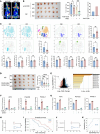
(A) Kaplan-Meier survival curves of PFS for patients with PDAC based on the impact of 18F-FDG uptake with treatment. The median of 18F-FDG SUVmax was used to divide the cohort (cut off: 8.1). Statistical analyses were performed with log-rank test. (B) Representative images of 18F-FDG PET/CT and computed tomography angiography (CTA) of patients. Tumors are shown with a blue arrow. (C) Pan-Kla levels were analyzed by immunostaining of 31 biopsy specimens. Representative images of patients are shown. Scale bars: 2 cm. (D) Overall survival analysis was performed based on mean fluorescence intensity of Pan-Kla immunostaining. (E) ROC-AUC plot analysis was performed based on mean fluorescence intensity of Pan-Kla. Statistical analyses were performed with log-rank test. Prediction model of immunochemotherapy response situation was established. (F) Glycolysis score of patients with different KRAS mutation status using TCGA-PAAD database. Statistical analyses were performed with 1-way ANOVA. (G) Protein expression analysis of KPC cells treated with MRTX1133 (1 μM, 24 hours) or DMSO. (H) Representative images of 18FDG PET/CT of KPC orthotopic transplantation model treated with MRTX1133 (0.2 mg/mouse, i.p., qd) or DMSO. Tumors are shown with a white arrow. (I) Orthotopic transplantation tumors and statistical analysis are shown. KPC mice were individually treated by anti–PD-1 mAb (100 μg/mouse, i.p., tid) or MRTX1133 (0.2 mg/mouse, i.p., qd). Statistical analyses were performed with 1-way ANOVA (n = 5). (J) Proportions of each type of immunocytes and function markers in CD8+ T cells. The immune microenvironments of orthotopic transplantation model with different treatments were compared. Statistical analyses were performed with 1-way ANOVA (n = 5). *P < 0.05; **P < 0.01; ***P < 0.001.
Figure 3
Figure 3. Inhibiting glycolysis reduces the levels of CCL2 secreted by tumor.
(A) Representative images of 18FDG PET/CT of Hk2-NC and Hk2-KD KPC orthotopic transplantation models. Tumors are shown with a white arrow. (B) Hk2-NC and Hk2-KD KPC orthotopic transplantation mice were individually treated with or without anti-CD8 mAb (100 μg/mouse, i.p., tid). Statistical analyses were conducted with 1-way ANOVA (n = 6). (C) t-Distributed stochastic neighbor embedding (t-SNE) analysis and proportions of each type of immunocytes. Statistical analyses were performed with Student’s t test (n = 6). (D) Hk2-NC and Hk2-KD KPC orthotopic transplantation mice were individually treated with or without clodronate liposomes (1mg/mouse, i.p, q7d). Statistical analyses were performed with 1-way ANOVA (n = 5). (E) Volcano map of the RNA-Seq and transcriptional activity assay. KPC cells were treated with 2-DG (HK2 inhibitor, 10 mM, 24 hours), and differentially expressed genes are shown. Ccl2 was significantly downregulated when treated with 2-DG. Top 1,000 downregulated genes were validated by transcriptional activity assay using Metascape. (F) Relative Ccl2 mRNA expression is shown. (G) Relative CCL2 secretion tested by ELISA is shown. (H) Concentration of serum CCL2. A total of 20 fresh PDAC samples were divided into 2 groups according to Pan-Kla expression. Statistical analyses were performed with Student’s t test (n = 20). (I) Overall survival analysis was performed based on concentration of serum CCL2. Patients were divided into 2 groups according to the medium amount of serum CCL2. Statistical analyses were performed with log-rank test (n = 36). (J) Concentration of serum CCL2 tested by ELISA. Thirty-one PDAC samples involved in the CISPD3 RCT study were divided into 2 groups according to their response to immunochemotherapy. (K) ROC-AUC plot analysis was performed based on the concentration of CCL2. Prediction model of immunochemotherapy response situation was established. *P < 0.05; **P < 0.01; ***P < 0.001; ****P < 0.0001.
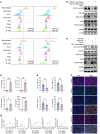
Figure 4
Figure 4. ENSA K63 lactylation upregulates STAT3/CCL2 signaling via PP2A and SRC.
(A) Volcano map of the RNA-Seq analysis. Top 1,000 upregulated genes were deconvoluted to reveal related transcriptional factors using Metascape. (B) Protein expression analysis of KPC cells treated with 2-DG (10 mM, 24 hours) or NALA (40 mM, 24 hours). (C) Relative Ccl2 mRNA expression is shown with 3 technical replicates. KPC cells were treated with STAT3-IN-11 (1 μM, 24 hours) or NALA (40 mM, 24 hours). (D) Protein expression analysis of KPC cells treated with A-485 (EP300 inhibitor, 1 μM, 24 hours) or NALA (40 mM, 24 hours). (E) Protein expression and immunoprecipitation-immunoblotting analyses of KPC cells treated with 2-DG (10 mM, 24 hours) or NALA (40 mM, 24 hours). Anti-FLAG antibody was used to immunoprecipitate ENSA-FLAG proteins. (F) Protein expression analysis of Ensa-NC and Ensa-KO KPC cells treated with 2-DG (10 mM, 24 hours) or NALA (40 mM, 24 hours). (G) Protein expression analysis of each Ensa-KO KPC cell line overexpressing ENSA-NC, ENSA-WT-FLAG, ENSA-K40R-FLAG, ENSA-K56R-FLAG, ENSA-K63R-FLAG, ENSA-K74R-FLAG, or ENSA-K80R-FLAG. (H) Mass spectrum analysis revealed that ENSA is lactylated at K63 site. (I) Relative Ccl2 mRNA expression of each Ensa-KO KPC cell line overexpressing vector control, ENSA-WT, or ENSA-K63R is shown. (J) Protein expression and immunoprecipitation-immunoblotting analyses of KPC-HA-PPP2R2D cell line treated with 2-DG (10 mM, 24 hours) or NALA (40 mM, 24 hours). Anti-HA antibody was used to immunoprecipitate HA-PPP2R2D proteins. (K) Protein expression and immunoprecipitation-immunoblotting analysis of KPC-HA-PPP2CA cell line treated with 2-DG (10 mM, 24 hours) or NALA (40 mM, 24 hours). Anti-HA antibody was used to immunoprecipitate HA-PPP2CA proteins. (L) Protein expression analysis of each KPC cell line overexpressing vector (control), SRC-WT, SRC-S12A, or SRC-S12D. (M) SRC-pS12-specific activity of PP2A phosphatase. SRC-pS12 cell-penetrating peptide (HLYVSPWGG-SKPKDApSQRRRSL) was incubated with KPC cells treated with 2-DG (10 mM, 24 hours) or NALA (40 mM, 24 hours). (N) Protein expression analysis of KPC and PANC-1 cells treated with 2-DG (10 mM, 24 hours) or NALA (40 mM, 24 hours).
Figure 5
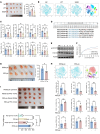
Figure 5. Design of a peptide inhibitor specifically targeting ENSA-K63la.
(A) Ensa-KO KPC cells stably expressing vector control, ENSA-WT, and ENSA-K63R were orthotopically transplanted into mice and tumor growth was analyzed. Statistical analyses were performed with 1-way ANOVA (n = 5). (B and C) t-SNE analysis (B) and proportions (C) of each type of immunocytes in the tumors in A. The immune profiling was analyzed using Cytek. Statistical analyses were performed with 1-way ANOVA (n = 5). (D) Human and mouse ENSA protein sequences are shown. Cell-penetrating peptide targeting ENSA-K63la was designed around K63 site. (E) Protein expression analysis of KPC cells treated with individual K63-peptide (10μM, 24h). (F) Relative inhibition rate of STAT3-Y705 phosphorylation. KPC cells treated with K63-peptide inhibitor 3 (HLYVSPWGG-LMKRLQKGQKYFD) and K63la-peptide control 3 (HLYVSPWGG-LMKRLQKGQKlaYFD) with different concentrations (0 μM; 0.5 μM; 1 μM; 2 μM; 4 μM; 8 μM; 16 μM) for 24 hours. Immunoblotting band intensity was measured using Image J. The relative levels of ENSA-K63la and STAT3-pY705 were normalized by the levels of ACTB. The relative inhibition rate at a certain concentration was calculated by 1– expression (K63 inhibitor 3)/expression (K63la control 3). IC50 was calculated by nonlinear regression. (G) Orthotopic transplantation tumors and statistical analysis are shown. KPC orthotopic transplantation mice were treated with K63la-pe control 3 (control) or K63-pe inhibitor 3 (0.2 mg/mouse, i.p., qd). Tumor growth was analyzed with Student’s t test (n = 5). (H) t-SNE analysis and proportions of each type of immunocytes in the tumors in G. The immune profile of tumors was analyzed using Cytek. Statistical analyses were performed with Student’s t test (n = 5). (I) Orthotopic transplantation tumors and statistical analysis are shown. KPC mice were treated with anti-PD-1 mAb (100 μg/mouse, i.p., tid), K63la-pe control 3, or K63-pe inhibitor 3 (0.2 mg/mouse, i.p., qd). Tumor growth was analyzed with 1-way ANOVA (n = 5). *P < 0.05; **P < 0.01; ***P < 0.001; ****P < 0.0001.
Figure 6
Figure 6. Lactate accumulation reprograms TAMs by ENSA lactylation.
(A) Pan-Kla and p-STAT3 expression were tested using intracellular flow cytometry in each cell type from Hk2-NC and Hk2-KD KPC orthotopic tumors. (B) Protein expression analysis of BMDMs pretreated with Hk2-NC and Hk2-KD KPC cell supernatant and then treated with NALA (10 mM, 24 hours). (C) Protein expression analysis of BMDMs pretreated with KPC cell supernatant (1:1, 24 hours) and then treated with K63la-pe control 3 or K63-pe inhibitor 3 (10 μM, 24 hours). (D) BMDMs were pretreated with KPC supernatant (1:1, 24 hours) and then treated with NALA (40 mM, 24 hours). Relative Ccl2, Arg1, S100A9, and Il10 mRNA expression levels are shown. (E) CCL2, IL10, ARG1, and S100A9 expression in TAMs. Flow cytometry was used. Statistical analyses were performed with Student’s t test (n = 5). (F) Representative images of mIHC staining of KTC tumor samples from transgenic mice (LSL-Kras [G12D/+]; Tgfbr2 [flox/flox]; p48 [Cre/+]). Representative images of paraffin sections with high or low Pan-Kla expression are shown. (G) Simple linear regression was used to reveal correlation of p-STAT3, CCL2, ARG1, S100A9, and Pan-Kla (n = 12). *P < 0.05; **P < 0.01; ***P < 0.001; ****P < 0.0001.
Figure 7
Figure 7. ENSA-K63la/STAT3-pY705/CCL2 axis is a therapeutic target for human PDAC.
(A) Representative images of mIHC of human PDAC tumor tissues. (B) Simple linear regression was used to reveal correlation of ENSA-K63la and STAT3-pY705. Intact tissues with survival data were included in follow-up analysis (n = 116). (C) Overall survival analysis was performed based on maximum fluorescence intensity of ENSA-K63la. Statistical analyses were performed with log-rank test (n = 116). (D) Overall survival analysis was performed based on mean fluorescence intensity of STAT3-pY705. Statistical analyses were performed with log-rank test (n = 116). (E) Schematic diagram for generating humanized PDAC models. (F) Subcutaneous transplantation tumors and statistical analysis are shown. Statistical analyses were performed with 1-way ANOVA (n = 5). (G) Proportions of each cell type of immunocytes and each function marker in CD8+ T cells.

Comment in

  • Targeting lactylation and the STAT3/CCL2 axis to overcome immunotherapy resistance in pancreatic ductal adenocarcinoma

References

    1. Hu ZI, O’Reilly EM. Therapeutic developments in pancreatic cancer. Nat Rev Gastroenterol Hepatol. 2024;21(1):7–24. - PubMed
    1. Bear AS, et al. Challenges and opportunities for pancreatic cancer immunotherapy. Cancer Cell. 2020;38(6):788–802. - PMC - PubMed
    1. Fu Q, et al. Sintilimab plus modified FOLFIRINOX in metastatic or recurrent pancreatic cancer: the randomized Phase II CISPD3 Trial. Ann Surg Oncol. 2023;30(8):5071–5080. doi: 10.1245/s10434-023-13383-w. - DOI - PubMed
    1. Zhang J, et al. Turning cold tumors hot: from molecular mechanisms to clinical applications. Trends Immunol. 2022;43(7):523–545. doi: 10.1016/j.it.2022.04.010. - DOI - PubMed
    1. Pavlova NN, Thompson CB. The emerging hallmarks of cancer metabolism. Cell Metab. 2016;23(1):27–47. doi: 10.1016/j.cmet.2015.12.006. - DOI - PMC - PubMed

MeSH terms