. 2025 Jan 30;10(5):e186062.
doi: 10.1172/jci.insight.186062.

Multimodal integration of blood RNA and ctDNA reflects response to immunotherapy in metastatic urothelial cancer

Affiliations

Multimodal integration of blood RNA and ctDNA reflects response to immunotherapy in metastatic urothelial cancer

Sandra van Wilpe et al. JCI Insight. .

Abstract

Background: Previously, we demonstrated that changes in circulating tumor DNA (ctDNA) are promising biomarkers for early response prediction (ERP) to immune checkpoint inhibitors (ICIs) in metastatic urothelial cancer (mUC). In this study, we investigated the value of whole-blood immunotranscriptomics for ERP-ICI and integrated both biomarkers into a multimodal model to boost accuracy.

Methods: Blood samples of 93 patients were collected at baseline and after 2-6 weeks of ICI for ctDNA (n = 88) and immunotranscriptome (n = 79) analyses. ctDNA changes were dichotomized into increase or no increase, the latter including patients with undetectable ctDNA. For RNA model development, the cohort was split into discovery (n = 29), test (n = 29), and validation sets (n = 21). Finally, RNA- and ctDNA-based predictions were integrated in a multimodal model. Clinical benefit (CB) was defined as progression-free survival beyond 6 months.

Results: Sensitivity (SN) and specificity (SP) of ctDNA increase for predicting non-CB (N-CB) was 59% and 92%, respectively. Immunotranscriptome analysis revealed upregulation of T cell activation, proliferation, and interferon signaling during treatment in the CB group, in contrast with N-CB patients. Based on these differences, a 10-gene RNA model was generated, reaching an SN and SP of 73% and 79%, respectively, in the test and 67% and 67% in the validation set for predicting N-CB. Multimodal model integration led to superior performance, with an SN and SP of 79% and 100%, respectively, in the validation cohort.

Conclusion: The combination of whole-blood immunotranscriptome and ctDNA in a multimodal model showed promise for ERP-ICI in mUC and accurately identified patients with N-CB.

Funding: Eurostars grant E! 114908 - PRECISE, Paul Speth Foundation (Bullseye project).

Keywords: Bioinformatics; Cancer immunotherapy; Immunology; Oncology; Urology.


Figures

Figure 1
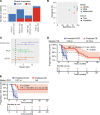
Figure 1. Circulating tumor DNA (ctDNA) dynamics predicts clinical benefit (CB) to immune checkpoint inhibitor (ICI) therapy in metastatic urothelial cancer (mUC) patients.
(A) Sample collection and analysis schematic: mUC patients were treated with an ICI (pembrolizumab, nivolumab, or avelumab) until disease progression. Blood was collected at baseline (BL, before cycle 1) and on-treatment (OT, after 2–6 weeks) for both ctDNA and RNA analysis. The primary endpoint was CB. This was defined as progression-free survival (PFS) for at least 6 months. (B) Kaplan-Meier (KM) curve comparing the PFS of patients with PD-L1–positive tumor (orange curve, PD-L1 combined positive score < 10) and patients with PD-L1–negative tumor (green curve, PD-L1 combined positive score < 10). (C) KM curve comparing the PFS of patients with a high tumor mutational burden (TMB) (orange curve, TMB ≥ 10 mutations/Mb) and TMB low patients (green curve, TMB < 10 mutations/Mb). (D) KM curve comparing the PFS of ctDNA-based patient stratification. The predicted CB population (orange curve) contains patients who had a decrease in ctDNA fraction from BL to OT or undetected at both time points. The predicted non-clinical benefit (N-CB, green curve) population contains patients where the ctDNA fraction increased from BL to OT or was stable. P values were determined by a Mantel-Haenszel test. HR, hazard ratio; CI, confidence interval.
Figure 2
Figure 2. Blood immunotranscriptome dynamics in CB patients reveal the biological mode of action of early response to ICIs.
(A) Over-representation analysis (ORA) performed on the upregulated differentially expressed genes at OT (edgeR fold-change > 0) found by differential expression analysis (DEA) comparing paired BL to OT samples of CB patients (longitudinal CB DEA). The top enriched gene ontology biological processes (GO BPs) are shown (based on an enrichment-adjusted P value 0.05), highlighting pathways upregulated at OT. (B) Largest gene clusters identified by STRING analysis of all DEGs in the longitudinal CB DEA. Each node represents 1 gene and each segment an interaction defined by STRING analysis. (C) ORA performed on the genes included in the clusters showed in B. The top GO BPs are shown (based on an enrichment-adjusted P value 0.05, green terms are associated to cluster 1, orange terms with cluster 2, and violet terms with cluster 3). (D) Venn diagram showing the DEGs intersect between the longitudinal CB DEA (395 DEGs), the DEA comparing paired BL to OT samples of N-CB patients (longitudinal N-CB DEA, 53 DEGs), and the DEA comparing CB to N-CB patients at the OT time point (OT DEA, 551 DEGs). The 49-gene intersect between the longitudinal CB DEA to the OT DEA is highlighted. (E) Box-and-whisker plot comparing the mean expression of the 49-gene set highlighted in D in the N-CB and CB patient group at the OT time point. Gene expression is defined for each patient by the mean of the trimmed mean of M values (TMM) for each gene in the 49-gene set. (F) Expression heatmap and hierarchical clustering of the 49-gene set in N-CB and CB patients at the OT time point. Columns and rows are hierarchically clustered. Patient group and best overall response (BOR) are annotated per row. NA, not annotated; CPD, clinical progressive disease; PD, progressive disease; SD, stable disease; PR, partial response; CR, complete response. **P < 0.01 by Wilcoxon’s test.
Figure 3
Figure 3. Blood-based immunotranscriptome predictive model forecasts CB in an independent cohort.
(A) Modeling approach schematic: Biomarker discovery was performed in the discovery cohort (patients with paired BL and OT RNA-seq data, n = 29) by DEA. Model training was performed in the same cohort by multiple iterations of random features reduction of the biomarker/gene list, followed by model testing in the independent test cohort (patients with paired BL and OT RNA-seq data, n = 29). The best CB predictive model was selected by area under the curve (AUC) ranking of each model receiver operating characteristics (ROC) curve and by ranking the difference in median PFS between the predicted CB and N-CB groups in the test cohort (n = 29). Last, the best performing model was validated in the validation cohort (patients with paired BL and OT RNA-seq data, n = 21). (B) ROC curve showing model performance of the best performing model in the independent test cohort (n = 29). Specificity is calculated with respect to CB patients (true negative cases), while sensitivity to N-CB (true positive cases). (C) Kaplan-Meier (KM) curve comparing the PFS of model-based predicted CB population (red) and predicted N-CB population (blue) in the independent test cohort (n = 29). (D) Attention map contextualizing the biology of the 10 genes used to craft the model shown in B and C showing in which DEA the genes were identified. The genes have also been mapped to a selection of significantly enriched pathways of different ontologies in the longitudinal CB DEA (enrichment-adjusted P ≤ 0.05) and to the STRING network clusters shown in Figure 2B. Genes included in the DEGs of the longitudinal CB DEA or the OT DEA are highlighted in orange (upregulated, based on edgeR FC ≥ 0) or in blue (downregulated, based on edgeR FC < 0). Genes associated with enriched pathways or STRING clusters are highlighted in yellow. (E) ROC curve showing model performance assessment in the independent blinded validation cohort (n = 21). Specificity is calculated with respect to CB patients (true negative cases) and sensitivity to N-CB (true positive cases). (F) KM curve comparing the PFS of RNA model–based predicted CB population (red) and N-CB population (blue) in the independent blinded validation cohort (n = 21). P values were determined by a Mantel-Haenszel test. HR, hazard ratio (predicted CB population as reference); CI, confidence interval.
Figure 4
Figure 4. Integration of ctDNA- and RNA-based biomarkers boosts the performance of a multimodal model in an independent blinded validation cohort.
(A) Prediction comparison: Patients of the independent test cohort (n = 27, where both RNA-seq and ctDNA data were available) were categorized based on the RNA and ctDNA model predictions, highlighting convergent or divergent readouts by the 2 approaches. Column color coding reflects the actual CB group defined by clinical assessment (red = CB, blue = N-CB). (B) Model performance comparison of the different model approaches (ctDNA model in orange, RNA model in green, multimodal model in violet) in the independent test cohort (circles, n = 27, where both RNA-seq and ctDNA data were available) and blinded validation cohort (triangles, n = 19, where both RNA-seq and ctDNA data were available). (C) Hazard ratio (HR) for PFS of the 3 modeling approaches used for patient stratification (ctDNA model in orange, RNA model in green, multimodal model in violet) in the independent test (circles, n = 27, where both RNA-seq and ctDNA data were available) and blinded validation cohorts (triangles, n = 19, where both RNA-seq and ctDNA data were available). The bars represent the confidence of interval for each HR. The dashed line represents HR = 1. (D and E) Kaplan-Meier curves comparing the PFS of the multimodal model–based predicted CB population (red) and N-CB population (blue) in (D) the independent test cohort (n = 27, where both RNA-seq and ctDNA data were available) and (E) in an additional blinded and independent validation cohort (n = 19, where both RNA-seq and ctDNA data were available). P values were determined by a Mantel-Haenszel test. HR, hazard ratio (predicted CB population as reference); CI, confidence interval.

References

    1. Bellmunt J, et al. Pembrolizumab as second-line therapy for advanced urothelial carcinoma. N Engl J Med. 2017;376(11):1015–1026. doi: 10.1056/NEJMoa1613683. - DOI - PMC - PubMed
    1. Powles T, et al. Avelumab maintenance therapy for advanced or metastatic urothelial carcinoma. N Engl J Med. 2020;383(13):1218–1230. doi: 10.1056/NEJMoa2002788. - DOI - PubMed
    1. Powles T, et al. ESMO Clinical Practice Guideline interim update on first-line therapy in advanced urothelial carcinoma. Ann Oncol. 2024;35(6):485–490. doi: 10.1016/j.annonc.2024.03.001. - DOI - PubMed
    1. Powles T, et al. Enfortumab vedotin and pembrolizumab in untreated advanced urothelial cancer. N Engl J Med. 2024;390(10):875–888. doi: 10.1056/NEJMoa2312117. - DOI - PubMed
    1. van der Heijden MS, et al. Nivolumab plus gemcitabine–cisplatin in advanced urothelial carcinoma. N Engl J Med. 2023;389(19):1778–1789. doi: 10.1056/NEJMoa2309863. - DOI - PubMed