. 2025 Feb 25;44(2):115237.
doi: 10.1016/j.celrep.2025.115237. Epub 2025 Feb 1.

G3BP1 ribonucleoprotein complexes regulate focal adhesion protein mobility and cell migration

Affiliations

G3BP1 ribonucleoprotein complexes regulate focal adhesion protein mobility and cell migration

Liana C Boraas et al. Cell Rep. .

Abstract

The subcellular localization of mRNAs plays a pivotal role in biological processes, including cell migration. For instance, β-actin mRNA and its associated RNA-binding protein (RBP), ZBP1/IGF2BP1, are recruited to focal adhesions (FAs) to support localized β-actin synthesis, crucial for cell migration. However, whether other mRNAs and RBPs also localize at FAs remains unclear. Here, we identify hundreds of mRNAs that are enriched at FAs (FA-mRNAs). FA-mRNAs share characteristics with stress granule (SG) mRNAs and are found in ribonucleoprotein (RNP) complexes with the SG RBP. Mechanistically, G3BP1 binds to FA proteins in an RNA-dependent manner, and its RNA-binding and dimerization domains, essential for G3BP1 to form RNPs in SG, are required for FA localization and cell migration. We find that G3BP1 RNPs promote cell speed by enhancing FA protein mobility and FA size. These findings suggest a previously unappreciated role for G3BP1 RNPs in regulating FA function under non-stress conditions.

Keywords: CP: Cell biology; CP: Molecular biology; G3BP1; RNA localization; cell migration; focal adhesions; protein mobility; ribonucleoprotein complexes.


Conflict of interest statement

Declaration of interests S.W. is a co-inventor on a patent applied for by Harvard University related to the MERFISH technology. S.W. is a shareholder and consultant of Translura, Inc. M.H. is a current employee of Merck Research Laboratories.

Figures

Figure 1.
Figure 1.. A distinct subpopulation of mRNAs is localized to FAs
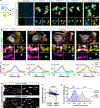
(A) Schematic of focal adhesion (FA) isolation protocol for poly(A) RNA sequencing (poly(A)-RNA-seq). (B) Representative images of HDFs before and after FA isolation. Cells were stained for F-ACTIN (phalloidin, yellow), vinculin (VCL; magenta), and DAPI (white). (C) mRNA-seq results for whole cells vs. isolated FAs in HDFs. Data are plotted as log10 average expression vs. log2 fold change with padj < 0.01 (determined using DESeq) for significantly localized mRNAs with four independent replicates per group. (D) RT-qPCR for FA-mRNAs (TRAK2 and KIF1C) or ectopically expressed iRFP from whole cells, isolated FAs, or isolated FAs in cells treated with blebbistatin (Blebb; 25 μM for 30 min) (two-way ANOVA with multiple comparisons, p < 0.0001 or p > 0.05 for all comparisons, n = 3 replicates per group, mean ± SD). (E) Representative images of KPNA4 or TRAK2 (cyan) and an FA counterstain (PXN, magenta) in HDFs. Dotted outlines in mRNA images represent the outline of the cell. Dotted boxes in FA images represent the region highly magnified on the right. Solid circles represent mRNA directly on top of FA in the highly magnified images. (F) Log2 of FA enrichment for mRNA foci directly on top of FA (co-localization) for non-localized (SKP1 and KPNA4) and FA-localized mRNA in HDFs (n = 10–20 cells for all mRNAs, individual two-way unpaired t tests were used to determine significance between SKP1 or KPNA4 and all other mRNAs, p < 0.001). (G) Composite MERFISH images of control mRNAs or FA-mRNAs (colored dots) after all hybridization rounds with FAs marked by PXN (white arrows) in HDFs. Dotted boxes in the images represent the regions highly magnified. (H) Boxplots of log2 of FA enrichment for mRNA foci directly on top of FA (co-localization) for the control mRNA, protrusion mRNA, or FA-mRNA determined by MERFISH (one-way ANOVA with multiple comparisons, p = 0.003 control vs. protrusion mRNA, p < 0.0001 control vs. FA-mRNA, and p = 0.0063 protrusion vs. FA-mRNA). (I) Histogram of log2 of FA enrichment for mRNA foci directly on top of FA (co-localization) for the control or FA-mRNA MERFISH libraries (n = 136 control mRNA and n = 122 FA-mRNA species averaged across independent experiments; control, n = 3 experiments, n = 486 cells; FA-mRNA, n = 4 experiments, n = 617 cells). 96% of FA-mRNAs have more enrichment than 95% of control mRNAs. See also Figure S1 and Tables S2 and S3.
Figure 2.
Figure 2.. G3BP1 co-localizes and interacts with FA proteins in an RNA-dependent manner
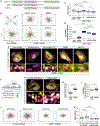
(A) Schematic of FA isolation protocol using untreated or RNase A-treated HDFs (1 mg/mL for 10 min). (B) Expression of G3BP1 with RNase A treatment from proteomics analysis of FA isolates from control or RNase A-treated HDFs (mean ± SD, two-way unpaired t test, p = 0.0003, n = 4 independent replicates). (C) Representative image of G3BP1 (yellow) and iRFP (cyan) within control or RNase A-treated cells (1 mg/mL for 10 min) co-stained with PXN (magenta) and DAPI (white). Dotted boxes in the left images represent the highly magnified region along the bottom. (D) Boxplots of FA-G3BP1 or FA-iRFP correlation coefficient from control or RNase A-treated cells. Paired measurements from G3BP1 and iRFP are from the same cells (two-way ANOVA with multiple comparisons, Con G3BP1 vs. Con iRFP p = 0.0088, vs. RNase G3BP1 p = 0.0005, and vs. RNase iRFP p = 0.0016; n = 25 cells). (E) Representative images of G3BP1 (yellow) and PXN (magenta) from cells treated with RNase A (1 mg/mL for 10 min), Blebb (25 μM for 30 min), or sodium arsenite (SA; 500 μM for 45 min). (F) Boxplots of FA-G3BP1 correlation coefficient from control or SA-treated cells (two-way unpaired t test, p < 0.0001, n = 14–21 cells). (G) Schematic of sample preparation for G3BP1 co-immunoprecipitation (coIP) for liquid chromatography-mass spectrometry (LC-MS). Cells were treated with RNase A (1 mg/mL for 10 min) or Blebb (25 μM for 30 min) before being lysed for coIP. (H) Heatmap of FA proteins lost or with decreased binding to G3BP1 following treatment (n = 3 biological replicates). (I) Western blots of coIP samples of G3BP1, ACTN1, TLN1, or immunoglobulin (Ig)G controls for control or treated cells. Samples were treated under the same conditions as the LC-MS screen. See also Figure S2 and Tables S3 and S4.
Figure 3.
Figure 3.. G3BP1 forms RNPs with FA-mRNA and is required for the enrichment of these mRNAs at FAs
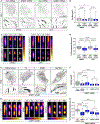
(A) Schematic and confocal images of GFP-G3BP1 protein (10 μM, yellow) mixed with in-vitro-transcribed mRNAs (50 nM, cyan). Dotted lines represent the outlines of the G3BP1 RNP complexes. (B) High-resolution confocal images of HDFs after immunofluorescence staining of G3BP1 (yellow) and paxillin (PXN; magenta) and smFISH of endogenous mRNA (TRAK2, KIF1C, DCBLD2, and IMPAD in cyan). Dotted lines represent outlines of proteins and mRNA. Dotted boxes in whole-cell images represent the region highly magnified along the bottom. (C) Normalized (to max intensity) profiles of G3BP1, PXN, and mRNA fluorescent intensities averaged across multiple FAs for mRNA directly co-localizing with FAs (mean ± SD, n = 20 mRNA/protein complexes, two-tailed correlation matrix for each mRNA vs. G3BP1 and PXN, where p < 0.0001 for all Pearson correlation coefficients where r = 0.849–0.947). (D) Composite MERFISH images for FA-mRNAs after all hybridization rounds with FAs marked by PXN (white arrows) in HDFs with a G3BP1 or control shRNA. (E and F) Boxplot (E) and histogram (F) of log2 of FA enrichment for FA-mRNAs determined by MERFISH in G3BP1 or control shRNA-treated HDFs (n = 122 FA-mRNA species averaged across 3 or 4 independent experiments, p < 0.0001, two-way paired t test). See also Figures S3 and S4 and Table S2.
Figure 4.
Figure 4.. G3BP1 regulates individual cell migration through its function as an RNP
(A) Schematic of G3BP1 protein domains and mutants used. (B and C) Rose plots (B) and quantification of speed (μm/min), represented as boxplots, (C) from individually migrating cells from control or G3BP1 shRNA-treated cells with either no G3BP1, full-length (FL), ΔRBD, or ΔNTF2L re-expression (one-way ANOVA with multiple comparisons, p < 0.0001 for Con or FL vs. shRNA alone, ΔRBD, or ΔNTF2L, and p = 0.0445 for ΔRBD vs. ΔNTF2L; n = 247–346 cells per group). (D) Boxplots of FA-G3BP1 correlation coefficient from control or re-expression cells in E (one-way ANOVA with multiple comparisons, p < 0.0001 for G3BP1 shRNA only vs. all other comparisons, for Con shRNA vs. ΔRBD or ΔNTF2L, or FL vs. ΔNTF2L; p = 0.0115 for FL vs. ΔRBD; n = 15 for all groups, but n = 7 for G3BP1 shRNA alone). (E) Representative images of G3BP1 (yellow) and PXN (magenta) in control or G3BP1 shRNA-treated cells with G3BP1 re-expression. Dotted lines represent outlines of proteins. Dotted boxes in the whole-cell image represent the region highly magnified along the bottom below. (F) Schematic of MS2-MCP-GFP-PXN system. TRAK2-MS2-tagged mRNA was co-expressed with an MCP-GFP-PXN fusion protein to directly link RNA to FAs. (G) Representative images of G3BP1 RNP complexes (yellow) and TRAK2-MS2 (cyan) in HDFs co-expressing MCP-GFP-PXN, which is incorporated into the FAs (magenta). Dotted lines represent outlines of protein/mRNA. Dotted boxes in images represent the highly magnified regions below. (H) Quantification of smFISH images taken of cells expressing MCP-GFP-PXN and either MS2 alone or TRAK2-MS2. Boxplots represent the log2 of FA enrichment for mRNA foci directly on top of FA (co-localization) (two-way unpaired t test, p < 0.0001, n = 21 cells). (I) Boxplots of FA-G3BP1 correlation coefficient from MS2-only- or TRAK2-MS2-expressing cells (two-way unpaired t test, p = 0.0472, n = 25 cells). (J and K) Rose plots (microns) (J) and quantification of speed (μm/min), represented as boxplots, (K) from individually migrating cells from control or G3BP1 shRNA-treated cells with either MS2 only or TRAK2-MS2 (one-way ANOVA with multiple comparisons, p < 0.0001 for MS2 only vs. TRAK2-MS2 Con shRNA and MS2 only or TRAK2-MS2 Con shRNA vs. both G3BP1 shRNA groups; n = 498–755 cells/group). See also Figure S5 and Videos S2, S3, S4, S5, S6, S7, S8, S9, and S10.
Figure 5.
Figure 5.. Analysis of protein abundance with loss of G3BP1
(A and B) Western blot images and quantification of puromycin incorporation after 5 min of puromycin treatment (5 μM) in (A) whole cells or (B) isolated FAs from control or G3BP1 shRNA-treated cells. Puromycin intensity was normalized to total protein visualized via ponceau S staining (see Figures S6A and S6B) (mean ± SD, two-way unpaired t test, p = 0.4024 with n = 3 replicates for whole cells, p = 0.6837 with n = 2 replicates [4 pooled dishes for each replicate] for isolated FAs). (C) Western blot images and quantification for FA-mRNA encoding proteins (TRAK2, KIF1C, LPAR1, PPFIBP1, IQGAP1, NET1, RAI14, and CTNNB1), FA/cytoskeletal proteins (ACTB, VCL, PXN, TLN1, and ACTN1), or G3BP1 in Con shRNA or G3BP1 shRNA-treated cells. Protein intensity was normalized to GAPDH (mean ± SD, two-way unpaired t tests for all, n = 3 replicates, p > 0.05 for all comparisons except for G3BP1, where p = 0.0014). (D and E) Rose plots (D) and quantification of speed (μm/min), represented as boxplots, (E) from individually migrating cells from control or G3BP1 shRNA-treated cells with either DMSO or CHX (100 μg/mL added at the start of imaging and continued for the 2-h video acquisition) (one-way ANOVA with multiple comparisons, p < 0.0001 for all comparisons except for Con shRNA CHX vs. G3BP1 shRNA DMSO [p = 0.0023] and Con shRNA CHX vs. G3BP1 shRNA CHX [p = 0.0008]; n = 284–382 cells per group). See also Figure S6 and Videos S11, S12, S13, and S14.
Figure 6.
Figure 6.. G3BP1 RNP function regulates FA size and FA protein mobility
(A and B) Representative images (A) and quantification (B) of FA size in HDF expressing a control or a G3BP1-targeting shRNA and treated with either DMSO or CHX (100 μg/mL for 1 h). Quantification is represented as boxplots (two-way ANOVA with multiple comparisons, Con shRNA [DMSO or CHX] vs. G3BP1 shRNA [DMSO or CHX] p < 0.0001 and Con shRNA DMSO vs. Con shRNA CHX p = 0.0316; n = 999–2,362 FAs per group). (C and D) Representative images (C) and quantification (D) of FRAP of PXN+ FAs in cells expressing a control or a G3BP1-targeting shRNA and treated with either DMSO or CHX (100 μg/mL for 1 h). PXN was ectopically expressed as PXN-iRFP. Quantification is represented as boxplots (two-way ANOVA with multiple comparisons, p < 0.0001 for all comparisons shown and p > 0.05 for all other comparisons; n = 47–49 FA FRAPs per group). (E and F) Representative images (E) and quantification (F) of FA size in control or G3BP1 shRNA-treated cells with either no G3BP1, full-length (FL), ΔRBD, or ΔNTF2L re-expression. Quantification is represented as boxplots (one-way ANOVA with multiple comparisons, p < 0.0001 for Con shRNA or FL vs. all other groups, n = 292–480 FA per group). (G and H) Representative images (G) and quantification of (H) FRAP of PXN+ FAs in cells expressing a control or a G3BP1-targeting shRNA with G3BP1 re-expression. PXN was ectopically expressed as PXN-mCherry. Quantification is represented as boxplots (one-way ANOVA with multiple comparisons, p < 0.0001 for Con shRNA or FL vs. all other groups, n = 46–55 FA FRAPs per group). See also Figure S7 and Videos S15, S16, S17, S18, S19, S20, and S21.
Figure 7.
Figure 7.. Proposed working model suggesting a role for G3BP1 RNPs in promoting FA protein mobility to maintain FA size and regulate cell migration speed
We demonstrate that focal adhesions (FAs) are enriched with mRNAs that have longer coding and untranslated regions, exhibit lower translation levels, and contain AU-rich elements, forming G3BP1 ribonucleoprotein (RNP) complexes essential for cell migration. In normal cells, G3BP1 localizes at FAs, and FA protein mobility is enhanced, leading to increased FA size and faster cell migration. Removing G3BP1 inhibits FA protein mobility and halts cell migration without affecting FA proteins or general protein translation. Our findings indicate that G3BP1 RNPs regulate cell migration by modulating FA protein dynamics.

References

    1. Franz CM, Jones GE, and Ridley AJ (2002). Cell migration in development and disease. Dev. Cell 2, 153–158. 10.1016/s1534-5807(02)00120-x. - DOI - PubMed
    1. Parsons JT, Horwitz AR, and Schwartz MA (2010). Cell adhesion: integrating cytoskeletal dynamics and cellular tension. Nat. Rev. Mol. Cell Biol. 11, 633–643. 10.1038/nrm2957. - DOI - PMC - PubMed
    1. Krause M, and Gautreau A (2014). Steering cell migration: lamellipodium dynamics and the regulation of directional persistence. Nat. Rev. Mol. Cell Biol. 15, 577–590. 10.1038/nrm3861. - DOI - PubMed
    1. Geiger B, Spatz JP, and Bershadsky AD (2009). Environmental sensing through focal adhesions. Nat. Rev. Mol. Cell Biol. 10, 21–33. 10.1038/nrm2593. - DOI - PubMed
    1. Kanchanawong P, Shtengel G, Pasapera AM, Ramko EB, Davidson MW, Hess HF, and Waterman CM (2010). Nanoscale architecture of integrin-based cell adhesions. Nature 468, 580–584. 10.1038/nature09621. - DOI - PMC - PubMed

Publication types

MeSH terms

Associated data

LinkOut - more resources