. 2025 Jan 30;20(1):e0315394.
doi: 10.1371/journal.pone.0315394. eCollection 2025.

Distinguishing classes of neuroactive drugs based on computational physicochemical properties and experimental phenotypic profiling in planarians

Affiliations

Distinguishing classes of neuroactive drugs based on computational physicochemical properties and experimental phenotypic profiling in planarians

Danielle Ireland et al. PLoS One. .

Abstract

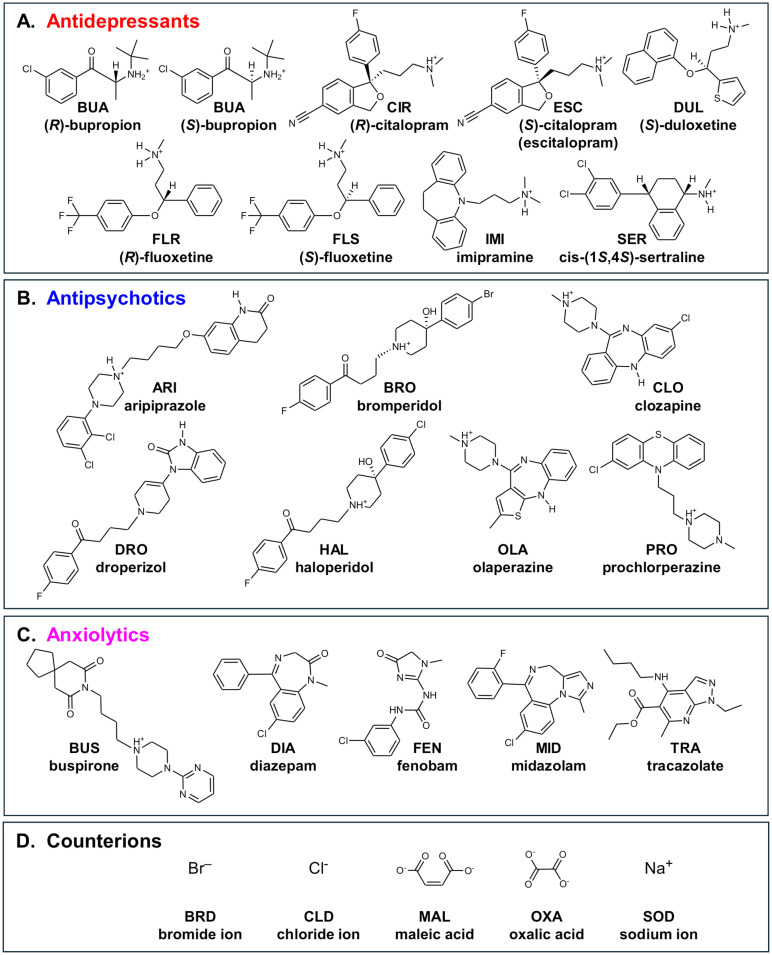
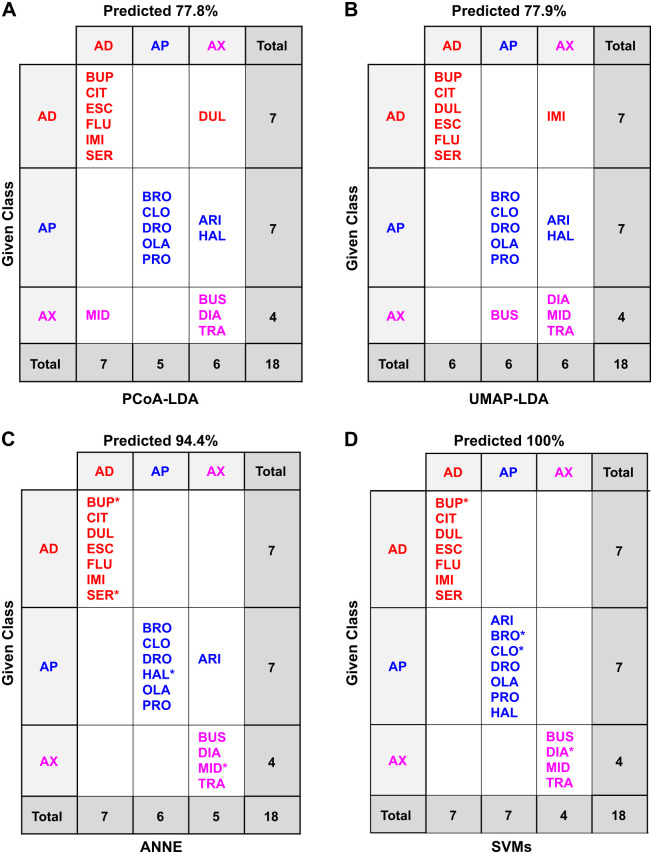
Mental illnesses put a tremendous burden on afflicted individuals and society. Identification of novel drugs to treat such conditions is intrinsically challenging due to the complexity of neuropsychiatric diseases and the need for a systems-level understanding that goes beyond single molecule-target interactions. Thus far, drug discovery approaches focused on target-based in silico or in vitro high-throughput screening (HTS) have had limited success because they cannot capture pathway interactions or predict how a compound will affect the whole organism. Organismal behavioral testing is needed to fill the gap, but mammalian studies are too time-consuming and cost-prohibitive for the early stages of drug discovery. Behavioral medium-throughput screening (MTS) in small organisms promises to address this need and complement in silico and in vitro HTS to improve the discovery of novel neuroactive compounds. Here, we used cheminformatics and MTS in the freshwater planarian Dugesia japonica-an invertebrate system used for neurotoxicant testing-to evaluate the extent to which complementary insight could be gained from the two data streams. In this pilot study, our goal was to classify 19 neuroactive compounds into their functional categories: antipsychotics, anxiolytics, and antidepressants. Drug classification was performed with the same computational methods, using either physicochemical descriptors or planarian behavioral profiling. As it was not obvious a priori which classification method was most suited to this task, we compared the performance of four classification approaches. We used principal coordinate analysis or uniform manifold approximation and projection, each coupled with linear discriminant analysis, and two types of machine learning models-artificial neural net ensembles and support vector machines. Classification based on physicochemical properties had comparable accuracy to classification based on planarian profiling, especially with the machine learning models that all had accuracies of 90-100%. Planarian behavioral MTS correctly identified drugs with multiple therapeutic uses, thus yielding additional information compared to cheminformatics. Given that planarian behavioral MTS is an inexpensive true 3R (refine, reduce, replace) alternative to vertebrate testing and requires zero a priori knowledge about a chemical, it is a promising experimental system to complement in silico cheminformatics to identify new drug candidates.


Conflict of interest statement

I have read the journal’s policy and the authors of this manuscript have the following competing interests: E-MC is the founder of Inveritek, LLC, which offers planarian HTS commercially. RJR currently serves as a member of the advisory board of NeuroX1, a startup biotechnology company that is developing a software platform for the discovery and development of drugs for neurodegenerative diseases. The remaining authors declare no conflict of interest. This does not alter our adherence to PLOS ONE policies on sharing data and materials.

Figures

Fig 1
Fig 1. Chemical structures.
Molecular structures depicted as 2D with stereochemistry indicated by wedged bonds are provided for the different chemical classes: A) Antidepressants, B) Antipsychotics, C) Anxiolytics, and D) Counterions. Counterions are not shown with their respective drug because they were not included in the computational studies. Table 1 lists the experimental compounds, including counterions, that were tested in planarians. Protonation states were based on the dominant form at pH 7.4 as determined by the protonation module in the ChemAxon Marvin suite (https://www.chemaxon.com).
Fig 2
Fig 2. Study overview.
Chemical and behavioral profiles were determined for 19 neuroactive drugs, consisting of 7 antidepressants, 7 antipsychotics, and 5 anxiolytics. Using quantitative analyses, we then determined molecular and phenotypic barcodes for each compound. These barcodes were used in the same computational models to determine how well each method performed at classifying the 3 neuroactive drug classes. Created with BioRender.com.
Fig 3
Fig 3. Tanimoto similarity coefficients.
Chemical similarity was quantified using the Tanimoto coefficient (Tc). Overlaps were determined after 3D alignment of each structure with the reference compound, ARI. ARI was chosen as the reference compound as it had the largest molecular volume as assessed by the van der Waals radii of the constituent covalently bonded atoms (see Methods). Tc Shape refers to similarity based on overlap of molecular volume. Tc Color refers to similarity based on overlap of 6 pharmacophores (H-bond acceptor, H-bond donor, anion, cation, hydrophobe, or ring). Tc Combined = Tc Shape + Tc Color. Range of Tc Shape and Tc Color = (0,1); range of Tc Combined = (0,2). Chemicals are ordered by their Tc Combined scores and color-coded by functional class.
Fig 4
Fig 4. Functional pharmacological classification of the study compounds based on their 2D chemical descriptors using LDA-based approaches.
Computational methods are arranged by rows: (A) PCoA-LDA; (B) UMAP-LDA. Counterion inclusion/exclusion is arranged by columns: (1) with counterions; (2) without counterions. Ellipses represent 95% confidence intervals. The axes show the percentage of the total eigenvalues; this does not sum to 100% in (A1) because there was a third axis that accounted for the remaining 0.60%.
Fig 5
Fig 5. Confusion matrices of the classification methods based on 2D chemical descriptors of the drugs and counterions.
Confusion matrices for the different classification methods: (A) PCoA-LDA; (B) UMAP-LDA; (C) ANNE; (D) SVMs; AD: antidepressant, AP: antipsychotic, AX: anxiolytic; CI: counterion. In A and B, predicted accuracy was calculated following an exhaustive jackknifing. In C and D, predicted accuracy refers to the overall accuracy of the best of 10 models of each type. *indicates randomly chosen members of the test set. In (D) two models were tied for the best so that the test set members are marked with both * (model 07_2i) and + (model 09_2i). See the Methods for model selection. Test set accuracies were 80.0% for ANNE (S2 Table) and 100% for SVMs (S4 Table).
Fig 6
Fig 6. Confusion matrices of the classification methods based on 2D chemical descriptors of the drugs only.
Confusion matrices for the different classification methods: (A) PCoA-LDA; (B) UMAP-LDA; (C) ANNE; (D) SVMs; AD: antidepressant, AP: antipsychotic, AX: anxiolytic. In A and B, predicted accuracy was calculated following an exhaustive jackknifing. In C and D, predicated accuracy refers to the overall accuracy of the best of 10 models of each type. *indicates randomly chosen members of the test set. See the Methods for model selection. Test set accuracies were 100% for ANNE (S3 Table) and 100% for SVMs (S5 Table).
Fig 7
Fig 7. Overview of planarian screening and data analysis.
A) Schematic of plate setup, including the orientations used in the triplicate runs, and representative image of a 48-well plate containing one planarian per well. Each plate contained a solvent control (c0) and 5 concentrations of a chemical and was tested acutely in phototaxis, stickiness, and noxious heat assays. B-G) Examples of various planarian body shapes: B) Normal planarian with smooth gliding. C) Contracted with shortened length and often associated with ruffling of the edges of the planarian. D) C-shape/curled and often on its side. E) Corkscrew showing multiple twists across the body axis. F) Pharynx extrusion. Arrow points at the unpigmented pharynx protruding from the underside of the planarian. G) Example image sequence of a planarian undergoing scrunching in response to chemical exposure at room temperature, showing oscillations of body length. This is one type of behavior, among others, which constitute the hyperkinesis category. Each frame is 1 sec apart. Examples shown are exposed to 0.5% (v/v) DMSO (B), 10 μM DRO (C and D), 10 μM BRO (E), 10 μM DUL (F), and 1 μM OLA (G). Scale bars: 2 mm. H) Representative plot of speed over time during the phototaxis assay. During a normal phototaxis response, planarians increase their speed during the blue light period. I) Minimum intensity projections of the shaking portion of the stickiness assay. A “stuck” planarian adheres to the bottom of the well and is not displaced, whereas an “unstuck” planarian dislodges and is displaced around the well. J) Length over time plots showing normal gliding or the oscillatory scrunching gait [49] that is induced during the noxious heat assay. Given that scrunching is the expected behavior during the noxious heat assay, we scored the number of planarians that do not scrunch. K) Example schematic representation of the behavioral barcodes. First, a barcode is created for each chemical concentration, consisting of a numerical vector of the compiled normalized score for each endpoint (columns). One master barcode is made for each chemical by concatenating the barcodes for the individual concentrations. For details, see Methods.
Fig 8
Fig 8. Activity of neuroactive drugs in planarians.
Heatmap comparing the benchmark concentrations (BMCs) for all neuroactive compounds in planarians after acute exposure. The first column shows the highest tested concentration. As both “speed_blue” endpoints had similar BMC scores, only “speed_blue2” is shown as this was the more sensitive of the two timepoints. AD: antidepressant, AP: antipsychotic, AX: anxiolytic, NS: noxious stimuli.
Fig 9
Fig 9. The drug classes showed different planarian phenotypic profiles.
Radar plots showing the percentage of chemicals in each class that had a hit at any concentration in (A) any endpoint or (B) specific body shape classes. In (A) speed and resting endpoints in each light period were combined into a “motility” readout. LB: locomotor bursts; NS: noxious stimuli.
Fig 10
Fig 10. Classification of planarian behavioral phenotyping based on LDA-based approaches.
Computational methods are arranged by rows: (A) PCoA-LDA; (B) UMAP-LDA. Counterion inclusion/exclusion is arranged by columns: (1) with counterions; (2) without counterions. Ellipses represent 95% confidence intervals. The axes show the percentage of the total eigenvalues.
Fig 11
Fig 11. Confusion matrices of the classification methods based on planarian behavioral phenotyping of the drugs and counterions.
Confusion matrices for the different classification methods: (A) PCoA-LDA; (B) UMAP-LDA; (C) ANNE; (D) SVMs. AD: antidepressant, AP: antipsychotic, AX: anxiolytic; CI: counterion. In A and B, predicted accuracy was calculated following an exhaustive jackknifing. In C and D, predicated accuracy refers to the overall accuracy. *indicates randomly chosen members of the test set. See the Methods for model selection. Test set accuracies were 80.0% for ANNE (S15 Table) and 100% for SVMs (S17 Table).
Fig 12
Fig 12. Confusion matrices of the classification methods based on planarian behavioral phenotyping of the drugs only.
Confusion matrices for the different classification methods: (A) PCoA-LDA; (B) UMAP-LDA; (C) ANNE; (D) SVMs. AD: antidepressant, AP: antipsychotic, AX: anxiolytic; CI: counterion. In A and B, predicted accuracy was calculated following an exhaustive jackknifing. In C and D, predicated accuracy refers to the overall accuracy. *indicates randomly chosen members of the test set. See the Methods for model selection. Test set accuracies were 100% for ANNE (S16 Table) and 100% for SVMs (S18 Table).

Similar articles

References

    1. World Health Organization. Mental disorders [Internet]. 2022 [cited 2024 Apr 17]. https://www.who.int/news-room/fact-sheets/detail/mental-disorders.
    1. Council of Economic Advisers. Reducing the Economic Burden of Unmet Mental Health Needs. 2022 May.
    1. World Health Organization. Mental Health and COVID-19: Early evidence of the pandemic ‘ s impact. Sci Br. 2022;2(March):1–11.
    1. Trautmann S, Rehm J, Wittchen H. The economic costs of mental disorders. EMBO Rep. 2016. Sep;17(9):1245–9. - PMC - PubMed
    1. Doran CM, Kinchin I. A review of the economic impact of mental illness. Aust Heal Rev. 2019. Nov 13;43(1):43–8. doi: 10.1071/AH16115 - DOI - PubMed